www.atmos-meas-tech.net/7/4049/2014/ doi:10.5194/amt-7-4049-2014
© Author(s) 2014. CC Attribution 3.0 License.
Constrained two-stream algorithm for calculating aerosol light
absorption coefficient from the Particle Soot Absorption Photometer
T. Müller1, A. Virkkula2,3,4, and J. A. Ogren5
1Leibniz Institute for Tropospheric Research, Leipzig, Germany
2Finnish Meteorological Institute, Air Quality Research, Helsinki, Finland 3University of Helsinki, Department of Physics, Helsinki, Finland
4Institute for Climate and Global Change Research, School of Atmospheric Sciences Nanjing,
University Nanjing, Nanjing, China
5NOAA, Earth System Research Laboratory, Boulder, CO 80305, USA Correspondence to: T. Müller ([email protected])
Received: 18 October 2013 – Published in Atmos. Meas. Tech. Discuss.: 18 December 2013 Revised: 8 May 2014 – Accepted: 24 July 2014 – Published: 2 December 2014
Abstract. We present a new correction scheme for filter-based absorption photometers filter-based on a constrained two-stream (CTS) radiative transfer model and experimental cal-ibrations. The two-stream model was initialized using ex-perimentally accessible optical parameters of the filter. Ex-perimental calibrations were taken from the literature and from dedicated experiments for the present manuscript. Un-certainties in the model and calibration experiments are dis-cussed and uncertainties for retrieval of absorption coeffi-cients are derived. For single-scattering albedos lower than 0.8, the new CTS method and also other correction schemes suffer from the uncertainty in calibration experiments, with an uncertainty of about 20 % in the absorption coefficient. For high single-scattering albedos, the CTS correction signif-icantly reduces errors. At a single-scattering albedo of about 0.98 the error can be reduced to 30 %, whereas errors using the Bond correction (Bond et al., 1999) are up to 100 %. The correction scheme was tested using data from an indepen-dent experiment. The tests confirm the modeled performance of the correction scheme when comparing the CTS method to other established correction methods.
1 Introduction
Absorption of solar radiation by particles plays an important role in the Earth’s radiative balance. The sign of the forc-ing, which determines whether the particles cause a
warm-ing or a coolwarm-ing of the Earth, strongly depends on the parti-cles’ ability to absorb and scatter radiation. Absorption coef-ficients can vary by many orders of magnitude. For instance, Delene and Ogren (2002) reported yearly averaged values of 0.38 Mm−1 for the background station Barrow (Alaska), and Andreae et al. (2008) gave a monthly average absorp-tion coefficient of 91 Mm−1in Guangzhou, a strongly
pol-luted area in China. Generally, the ratios of particle absorp-tion (σap)and scattering coefficients (σsp)change
depend-ing on the particle composition. The sdepend-ingle-scatterdepend-ing albe-dosω0=σsp/(σsp+σap)were 0.965 and 0.83 for the clean
(Barrow) and the polluted (Guangzhou) cases, respectively. Thus it is essential to have methods for measuring the ab-sorption coefficient in environments with very different opti-cal properties and with wide ranges of values.
methods measure transmittance or reflectance, or even both, of the particle-filter system. A few methods use the transmit-tance as a measure for the particle absorption. These meth-ods suffer from a cross sensitivity to particle scattering (Bond et al., 1999; Weingartner et al., 2003; Virkkula et al., 2005; Arnott et al., 2005; Müller et al., 2011), as explained later in this section, but the instruments are generally less expensive and easier to operate than in situ instruments. Consequently, all of the long-term data sets of aerosol light absorption to date have been obtained with filter-based instruments.
The most widely used fiber-filter-based absorption mea-surement techniques are developed from the integrating plate method (IPM), although the IPM introduced by Lin et al. (1973) does not make use of fiber filters but instead uses polycarbonate membrane filters. The measurement principle to relate the transmittance to the particle absorption and not to the particle extinction was also used for filter-based ab-sorption photometers, since fiber filters act as angular in-tegrating media through multiple scattering of light inside the filter. There are several instruments based on this idea, e.g., the Aethalometer (Hansen et al., 1984), the Particle Soot Absorption Photometer (PSAP; Radiance Research, Seattle, WA), and the Continuous Soot Monitoring System (COS-MOS; Miyazaki et al., 2008). Since particles are embedded in a multiple-scattering medium, corrections have to be devel-oped to derive the particle absorption from measurements of transmittance. Another instrument, the Multi-Angle Absorp-tion Photometer (MAAP; Petzold and Schönlinner, 2004), also measures reflection to correct for a further artifact of particle scattering.
Section 2 gives an overview of often-used measurement systems and correction methods. The two-stream radiative transfer model for relating the particle absorption to the transmittance of the filter is introduced in Sect. 3. Calibra-tion experiments for deriving model parameters are given in Sect. 4. An error analysis of the new correction scheme and comparison to existing correction methods are given in Sects. 5 and 6, respectively.
2 Measurement principle of filter-based absorption photometers
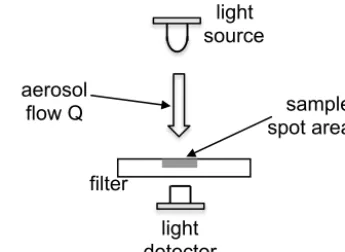
Filter-based absorption photometers measure the relative transmittance, which is the decrease in the light transmit-tance, while sample air is drawn through a filter and particles are deposited on the filter. A schematic of this technique is shown in Fig. 1. Inside a system of filter and deposited parti-cles multiple scattering of light occurs. Nevertheless, the fil-ter attenuation coefficient is calculated using an equation of the form of the Beer–Lambert law, which is not strictly valid if multiple scattering is non-negligible. The filter attenuation coefficientσ is calculated by
σ (t )= A
Q1tln
I (t−1t )
I (t )
, (1)
light detector
light source
sample spot area A aerosol
flow Q
filter
Figure 1. Functional principle of filter-based absorption
photome-ters.
whereAis the sample spot area,Qis the sample flow rate, andI is the intensity measured at the beginning and end of the time interval1t. An overview of used terms and abbre-viations is given in Appendix C.
A peculiarity of this method is that more light is absorbed by the deposited particles compared to particles suspended in air. This can be an advantage because the sensitivity to absorption is increased but a disadvantage because the en-hancement factor is not constant. This enhanced absorption is attributed to multiple scattering of light by the filter ma-trix. Insights into the radiative transfer of aerosol-loaded fil-ters have been provided by Clarke et al. (1982), Gorbunov et al. (2002), and Arnott et al. (2005). In laboratory studies it was found that the enhancement factor changes depending on the amount of collected particles. Generally, the enhance-ment factor becomes smaller with decreasing relative trans-mittance while loading the filter. Corrections to account for this effect are given for the PSAP in Bond et al. (1999) and Virkkula et al. (2005), and for the Aethalometer in Weingart-ner et al. (2003) and Arnott et al. (2005). Additionally, it was found that non-absorbing particles reduce the light transmit-tance, which can be misleadingly interpreted as absorption. This cross sensitivity to particle scattering is called apparent absorption. Corrections for the apparent absorption were de-veloped for Aethalometers (Weingartner et al., 2003; Arnott et al., 2005; Collaud Coen et al., 2010) and PSAPs (Bond et al., 1999; Virkkula et al., 2005). These corrections require simultaneous additional measurements of light-scattering co-efficient by nephelometers.
In recent years several laboratory studies have been con-ducted to test available photometer corrections for various aerosols. From Müller et al. (2011) it can be concluded that correction methods to account for the apparent absorption need to be revised. It was shown that the cross sensitiv-ity to particle scattering changes while the filter was loaded with scattering particles, and the cross sensitivity was higher at larger wavelengths. For example, when data from PSAP were corrected using the method given in Bond et al. (1999), the cross sensitivities for wavelengths 467, 531, and 650 nm were on average 0.3, 0.4, and 0.7 %, respectively. The appar-ent absorption became smaller as the filter loading increased, and at a relative transmittance of 70 % the apparent absorp-tion was about−0.5 % at wavelength 531 nm, i.e., an over-correction occurred.
3 Model for particle-laden filters
Since both the enhancement of absorption and the apparent absorption are functions of the transmittance, it is unlikely that a simple correction can be found with the relative trans-mittance being the only parameter for the loading state of particle-laden filters. In order to explain measured transmit-tances, a model for particle-loaded filters was developed. The model includes a two-stream radiative transfer model and parameterizations for the apparent absorption and the ab-sorption enhancement. Since the two-stream model is strained by the parameterizations, the model is called con-strained two-stream (CTS) model. The CTS model is basi-cally a forward calculation to simulate optical properties of the filter with known particle loading. An inversion algorithm is presented for deriving the particle absorption coefficient from transmittances, wherein the effects of particle loading are considered using the CTS model. The combination of the inversion algorithm and CTS model is called the CTS algo-rithm.
Parameterizations for apparent absorption and absorption enhancement were derived from calibration experiments. Ex-periments with non-absorbing particles led to a new param-eterization of the apparent absorption. Paramparam-eterizations of the enhancement effect for absorbing particles were taken from Bond et al. (1999) and Virkkula et al. (2005). The CTS algorithm was compared with the widely used corrections given in Bond et al. (1999) and Virkkula et al. (2005), which are referred to as B1999 and V2005 corrections throughout the rest of the manuscript. The CTS algorithm was developed for the PSAP. However, one can adopt the correction to other types of filter-based absorption photometers.
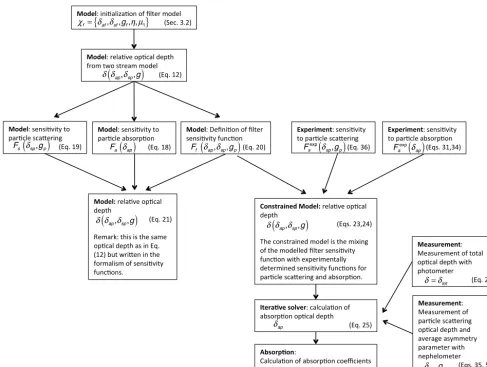
In the following sections the development of the CTS al-gorithm is explained in detail. A schematic diagram summa-rizing the main steps from model initialization to application of the model for deriving absorption coefficients is shown in Fig. 8. The scheme is helpful when reading the sections on the development of the CTS algorithm.
3.1 Two-stream radiative transfer model
The radiative transfer of pristine and particle-loaded fil-ters can be described by two-stream models (Bohren, 1987; Arnott et al., 2005; Moteki et al., 2010). In Arnott et al. (2005) such a model was used to derive absorption co-efficients from Aethalometers. That model is based on a two-layer system, a composite layer of homogeneously dis-tributed particles in a filter matrix and a particle-free layer of the filter matrix. In Moteki et al. (2010) a two-stream model for a system of many layers is given. With that model a more realistic particle concentration profile following from sam-pling theory (Lee and Mukund, 2001) can be incorporated into the radiative transfer calculations. Particle concentra-tion profiles depend on many parameters, e.g., particle size, face velocity (average velocity of aerosol perpendicular to the filter) and efficiency coefficients for different collection mechanisms. In Nakayama et al. (2010) it was shown for the PSAP that the absorption enhancement factor of 0.1 µm particles can be higher by about 60 % compared to 0.2 µm particles, and 0.2 µm particles appear to absorb about 23 % more than 0.3 µm particles. Thus it is important to consider size effects for evaluation of calibration experiments or at-mospheric measurements. In the last years, a few calibration experiments have been performed (Bond et al., 1999; Sheri-dan et al., 2005; Müller et al., 2011) without considering the size effect. In Moteki et al. (2010), the effect of different particle penetration depths was investigated experimentally. Unfortunately, the reference absorption was modeled by Mie calculations and not measured by an instrument, e.g., a pho-toacoustic photometer. Since no experimentally verified data on particle penetration depths and related enhancement fac-tors are available, sampling artifacts due to particle sizes are not considered in this manuscript and the simpler two-layer model is used.
Two-stream models are approximations to estimate the in-tensities transmitted through (It) and reflected from (Ir)a
one-dimensional homogeneous layer when illuminated with an incident intensityIi. Here we distinguish between
differ-ent optical depths. The total optical depth is defined by δtot= −ln
It
Ii
. (2)
Inside the filter, light is scattered and absorbed by de-posited particles or fibers of the filter. We define the extinc-tion optical depthδeas the sum of scattering and absorption
optical depths (subscripts s and a) caused by the particle-free filter and airborne particles (subscript f and p). If the particles are embedded in the filter, the relation between extinction and total optical depth is
δe=δsf+δsp+δaf+δap6=δtot. (3)
optical depths for the same particle population in an airborne state because of interference effects. First, there is an inter-ference because the particles are deposited on fibers and do not scatter light independently. Second, the particles are de-posited in a multiple-scattering environment because of the high number of light-scnattering fibers in the vicinity of the individual particles. Then the path length of photons passing through the filter becomes larger and the probability of being absorbed increases. Furthermore the particle concentration in the filter increases with time and particles may interfere among each other. There is no theoretical solution describ-ing such interference interactions that we can include in the radiative transfer model. Fortunately, this model uncertainty is implicitly compensated by the CTS model. The calibration experiments are subject to these interferences, which means that the parameterizations of the apparent absorption and ab-sorption enhancement implicitly contain the interference ef-fects. The CTS correction thereby inherits a compensation for the interference effects.
Scattering conserves energy but changes the direction of the propagation of light. The particle asymmetry parameter gp provides information on the direction in which light is
scattered. The probabilities that light is scattered in the for-ward and backfor-ward directions are(1+gp)/2 and(1−gp)/2,
respectively, wheregpis in the range−1≤gp≤1. In
gen-eral, asymmetry parameters for particles and fibers (gf)differ
in their value, and the asymmetry parameter for a system of fibers and particles is calculated by weighting the asymmetry parameters with their corresponding optical depths
g=gf·δsf+gp·δsp
δsf+δsp
. (4)
Therein the particle asymmetry parameter is the average weighted asymmetry parameter of all particles with
gp=
P
i
Cspi gpi
P
i
Ci sp
, (5)
whereidenotes theith particle with scattering cross section Cspi . The scattering coefficient and scattering cross section of an ensemble of particles are related by σsp=P
i
Cspi Ni, whereNi is the particle number concentration. Calculation of the asymmetry parameter using Eq. (4) is a simplifica-tion. A better representation of the angular dependence of scattered light would require the knowledge of the scatter-ing phase functions of particles, which in most cases is hard to derive. In contrast, the asymmetry parameter can be es-timated easily using nephelometers, as will be shown in Sect. 4.2.
In an optically thick layer with multiple scattering the transmittanceT =It/Ii and reflectanceR=Ir/Ii are given
by (Arnott et al., 2005; Schuster, 1905; Bohren, 1987) R= ω0(1−g)sinh(Kδe/µ1)/K
2−ω0(1+g)sinh(Kδe/µ1)/K+2 cosh(Kδe/µ1) (6)
and
T= 2
2−ω0(1+g)
sinh(Kδe/µ1)/K+2cosh(Kδe/µ1) , (7)
where
K=p(1−ω0)(1−ω0g). (8)
µ1 is typically between unity and 1/
√
3 for diffuse light propagation (Chandrasekhar, 1950; Sagan and Pollak, 1967; Liou, 2002).
The value ofµ1 accounts for the elongation of the path
length in the medium because of multiple scattering. In Eqs. (6) and (7), one can see thatµ1 scales the extinction
optical depth. A value near unity is a limiting case in which multiple scattering is negligible and does not contribute to a path length elongation. For this case (µ1→1) and negligible
backscattering (g→1), it easily can be derived that the equa-tion for the transmittance simplifies to the Beer–Lambert law with only the absorption optical depth in the exponent (T =e−δa). A value ofµ
1=1/
√
3 was found to be a suitable value for cases with considerable multiple scattering (Sagan and Pollak, 1967; Lyzenga, 1973). This supports the use of a value of 1/
√
3 in this study and in the previous study of Arnott et al. (2005).
The single-scattering albedoω0is defined by
ω0=
δsf+δsp
δsf+δsp+δaf+δap
. (9)
The solution for a two-layer system (subscript 2L) is given in Gorbunov et al. (2002) to be
R2L=R1+
(1−T2)·T12
1−R1·(1−T2)
(10) and
T2L=
T1T2
1−R1·(1−T2)
, (11)
layer 1a
layer 1b
I
iI
rI
t!"
#!$!
$
layer 2
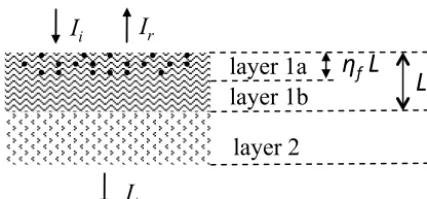
Figure 2. Transmitted and reflected intensities of a filter. The filter
consists of two parts: the fiber layer of thickness L and the backing layer. Particles are collected homogeneously in the upper part of
the fiber layer (layer 1a) with the relative thicknessηf. Layer 2 is
the backing layer for the mechanical stability of the filter. In this configuration layer 1 is illuminated directly by the light source. The arrows indicate the incident, reflected, and transmitted radiant flux, respectively.
For non-absorbing layers with R=1−T, Eq. (11) be-comes symmetric with respect to the order of the layers. In Sect. 3.2 we show that the PSAP filter is only slightly absorb-ing, and Eq. (11) can be considered to be symmetric. That implies that it does not matter from which side the filter is illuminated. This invariance with respect to the order of lay-ers implies that the filter is illuminated with diffuse light. If filters are illuminated with collimated light, the degree of dif-fuse or collimated light changes while light travels through the filter. The PSAP was designed to have a mostly diffuse illumination of the sample spot. PSAPs use either opal glass diffusing plates between light source and filter or a diffusely scattering hemisphere for illumination of the spot area. If the filter is illuminated with collimated light, radiative transfer models that account for both diffuse and collimated propa-gation of light should be used. Such a model is used for the MAAP (Petzold et al., 2005).
Filters used for the PSAP are made up of two different layers. Layer 1 is made of very fine fibers for collecting par-ticles, and layer 2 is a backing layer for mechanical strength. The relative particle penetration depthηfis a dimensionless
number between zero and unity and represents the fraction of the layer 1 (cf. Fig. 2) that particles penetrate. An assumption of the model is that particles are deposited homogeneously in that part of the layer facing to the light source. The optical properties of layer 1a are calculated by adding the particle optical depths and the fractionηfof the filter optical depths.
Optical properties of layer 1b are given by the remaining part (fraction 1−ηf)of the filter optical depths.
The relative optical depth of a particle-loaded, two-layer system is defined by
δ(δap, δsp, gp)=
−ln(T2L(δap, δsp, gp, Xf))+ln(T2L(0,0,0, Xf)), (12)
where δsp, δap, and gp are particle properties and Xf=
{δsf, δaf, gf, ηf, µ1} is a set of parameters defining the
optical properties of the pristine filter and the parti-cle concentration profile across the filter. The first term,
−ln(T2L, (δap, δsp, gp, Xf)), is the total optical depth and the
second term, ln(T2L, (0,0,0, Xf)), is the blank optical depth
of an unloaded filter. The relative optical depth is of impor-tance since it is measured by photometers, and the goal is to derive the particle optical depth from the relative optical depth.
The two-stream model is subject to a few assumptions. The parameterµ1 was motivated by the elongation of the
light path in a multiple-scattering environment. In our model, µ1is used for describing the optical properties of the blank
filter. Effects of particle loading on µ1 are desirable and
would be coupled to the relative penetration depthηf.
How-ever, loading effects onµ1 can not handled by the model.
Furthermore, the assumption of a step function of the parti-cle concentration across the filter is not realistic. From sam-pling theory the particle profile should be decreasing expo-nentially in regions of constant particle collection efficien-cies. Additionally, the collection efficiency will change with time because of previously collected particles. Other limita-tions, for example that particles and fibers are not scatter-ing independently, were discussed at the beginnscatter-ing of this section. All these model weaknesses are compensated for by matching the model to experimental calibration functions (cf. Sect. 3.3).
3.2 Characterization of the pristine filter
!
"##$
#!
%#&
%#!
'#()*+,#-
%#!
'#+#-
%#!
'#./012#
'301425634##
789121#
13
02
53
+1
#8
:2
0##
;'
5<
101
2#=
<
<
#
1>'0#8:20#
#!
'# 789121#25;'?7# @A#<<# ))BAC#
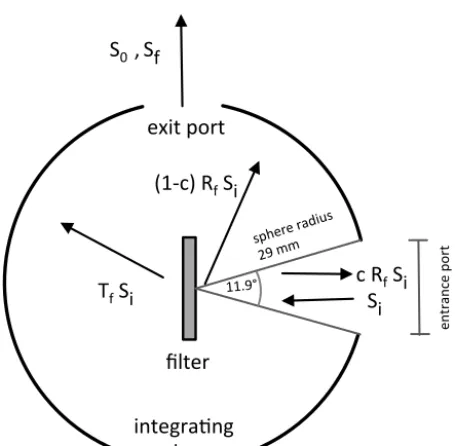
Figure 3. Setup of measurements inside the integrating sphere. The
filter is placed in the center of the sphere and illuminated through the entrance port. Reflected and transmitted light is scattered many times on the walls of the sphere before measured at the exit port. The radiant fluxes are indicated by arrows and explained in the text.
angles of incidence is not exactly known; and third, the fibers are touching each other, causing interference effects. For a diffuse illumination we derived an angular-averaged asym-metry parameter, which is about 0.70 for a range of fiber diameters between 0.4 and 0.7 µm. Average asymmetry pa-rameters for fiber diameters between 0.4 and 3 µm would be about 0.65. To cover the range of values given in Moteki et al. (2010) and this study, we have chosen an asymmetry pa-rameter of 0.75 with an uncertainty of 10 %. The sensitivity to the asymmetry parameter and its uncertainty is discussed in Sect. 5.
The filter scattering and absorption optical depths were calculated from measurements of the absorbance using an in-tegrating sphere and from transmittance and reflectance mea-sured with a polar photometer. Measurements were done for both the total filter and for the backing layer. For the lat-ter, the backing layer (layer 2) was isolated by removing the fluffy fiber layer (layer 1). The filter was fixed in the center of an integrating sphere (see Fig. 3). The orientation of the fil-ter was the same as for the PSAP. The filfil-ter was illuminated with a spectrally broad UV–VIS light source via an open in-put port of the sphere. A spectral photometer at the outin-put port of the sphere measured the spectral intensitySf.Sfcan
be calculated by a rate equation as
Sf=αsphere·Tf·Si+αsphere·Rf·(1−c)·Si, (13)
where Tf and Rf are the fractions of light transmitted and
reflected by the filter, respectively.Siis the incident intensity
andcis the fraction of light that is reflected from the filter
and leaves the sphere through the input port.αsphere is the
transmission efficiency of the sphere, which greatly depends on the value of the wall reflectivity. Without a filter inside the sphere, the intensity at the output port is given by
S0=αsphere·Si. (14)
The value ofc, which is the relative loss of energy through the input port, can be calculated by assuming a diffuse Lam-bertian reflectance of the incident light at the surface of the filter. For the sphere with radius 29 mm and a diameter of the entrance port of 6 mm, light scattered back within a cone with an opening angle of 11.9◦leaves the sphere. This is only valid for an illuminated filter area that is small compared to the diameter of the input port. Thecvalue is the ratio of the reflected energy within the cone and the energy scattered in the backward hemisphere, and is given by
c=
11.9◦/2
R
0
cos(θ )sin(θ )dθ
90
R
0
cos(θ )sin(θ )dθ
=0.04, (15)
wherein the term cos(θ )accounts for the diffuse Lambertian back scattering. The transmission efficiency of the sphere is eliminated by calculating the ratio of intensities measured with and without the filter:
rf,0:=
Sf
S0
=Tf+(1−c)·Rf. (16)
The angular intensity S(θ ) was measured with a polar photometer (Fig. 4) in forward (0◦<θ< 90◦) and backward (90◦<θ< 140◦) directions. The angular scattering functions for forward and backward scattering are close to cosine func-tions, indicating that the light is diffusely transmitted and re-flected. Thus, the angular resolution does not contain any in-formation and the reflected intensity was extrapolated to an angle ofθ=180◦using a cosine dependence. The only use-ful information from this measurement is the ratio of intensi-ties measured for two angles in transmission and reflection:
rR,T =S(0◦)/S(180◦). (17)
Measurements ofrf,0andrR,T were done for the total
fil-ter and the backing layer. Results are shown in Fig. 5a.rf,0
andrR,T were simulated using the two-layer model for the
total filter and a single-layer model for the backing layer, re-spectively (cf. Eqs. 6, 7, 10, 11) using the previously esti-mated asymmetry parameter of 0.75. Scattering and absorp-tion optical depths for both the filter and the backing layer were found by minimizing the differences between modeled and measured values forrf,0 andrR,T with an iterative
!"# !$%&# ! %# !$%#'(&# !$%&# )*+*,-*.#/"01-# -)2345"6*.#/"01-# 7/-*)# !" !" !"# !" !$%&# 2)*2#4**3#89#-1*#.*-*,-:)# "//;5"32-*.#2)*2#
Figure 4. Polar photometer. Left: the filter is illuminated with
in-tensitySi. The detector D can be turned around the center of the
fil-ter and measures the intensity of the transmitted and reflected light S(θ ), respectively. Right: the field of view of the detector is suffi-ciently large that the illuminated area is within the field of view of
the detector for all scattering anglesθ.
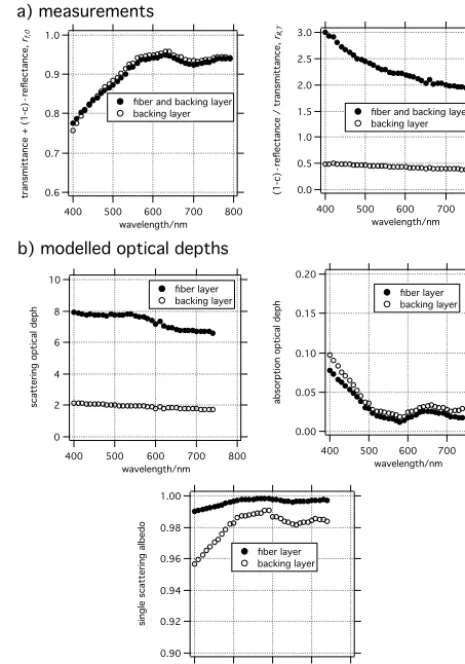
optical depths between 0 and 5 that the solutions for absorp-tion and scattering optical depths are unique. This test was successful for all wavelengths. The resulting optical depths and single-scattering albedos for both layers are shown in Fig. 5b. The single-scattering albedo for the backing layer is slightly lower than the single-scattering albedo for the fiber layer, which is almost unity for a large range of wavelengths. This can also be seen when looking at a filter, since the fiber layer is white and the backing layer is slightly grey.
The scattering optical depths of the fiber layer at the PSAP wavelengths of 467, 530, and 660 nm are 7.76, 7.69, and 7.34, respectively. The absorption optical depths for these wavelengths are 0.033, 0.038, and 0.018, respectively. While the values for scattering differ by only ±3 %, the absorp-tion shows a higher variaabsorp-tion of about 35 %. In Sect. 5 we will show that the wavelength dependence of the filter op-tical depths is negligible. For further investigations we use the optical parameters at the wavelength 530 nm. For com-parison, filter parameters from this study and from Moteki et al. (2010) are given in Table 1. The transmittance calculated from Moteki et al. (2010) is an order of magnitude smaller than observations for this study. One reason might be the dif-ferent asymmetry parameters and the choice of the value for µ1. Since for this study more experimental observations were
used for deriving optical filter parameters, the values given in Moteki et al. (2010) are not considered for further investiga-tions.
Uncertainties in the scattering and absorption optical depth were derived from the reproducibility of the experimental re-sults with a set of filters. Systematic errors were estimated to be smaller than 5 %. In total, the uncertainties in both the scattering and absorption filter optical depths are about 10 %. The relative particle penetration depth is a simplified model of the true sampling mechanism. According to Moteki et al. (2010), the penetration depth can greatly influence the sensitivity to absorbing particles. We have chosen a rela-tive penetration depth of ηf=0.2. With this value the
cal-culated enhancement factors are in good agreement with the
10 8 6 4 2 0 sc at te rin g op ti ca l d ep h 800 700 600 500 400 wavelength/nm filter layer backing layer fiber layer backing layer 3.0 2.5 2.0 1.5 1.0 0.5 0.0 (1 -c )· re fle ct an ce / t ra ns mi tt an ce ,
rR,T
800 700 600 500 400 wavelength/nm fiber and backing layer backing layer 1.0 0.9 0.8 0.7 0.6 tr an smi tt an ce + ( 1 -c )· re fle ct an ce , rf,0 800 700 600 500 400 wavelength/nm fiber and backing layer backing layer 0.20 0.15 0.10 0.05 0.00 ab sor pt ion op ti ca l d ep h 800 700 600 500 400 wavelength/nm fiber layer backing layer 1.00 0.98 0.96 0.94 0.92 0.90 single scatte ring albe do 800 700 600 500 400 wavelength/nm fiber layer backing layer a) measurements
b) modelled optical depths
Figure 5. (a) Measured sums and ratios of reflectance and
transmit-tance for the total filter and the backing layer. (b) Modeled scatter-ing and absorption optical depths, as well as sscatter-ingle-scatterscatter-ing albe-dos, for the fiber and backing layers.
enhancement factor for the PSAP given in Bond et al. (1999). Since the effective penetration depth was never measured, we assume an uncertainty of 50 % for the relative penetra-tion depth. Unfortunately, more accurate investigapenetra-tions are almost impossible or at least far out of the scope of this inves-tigation. However, it is important to have a rough idea of the magnitude of the uncertainties. The influence of the uncer-tainties in filter parameters on the uncertainty in the particle absorption coefficient will be discussed in Sect. 5.
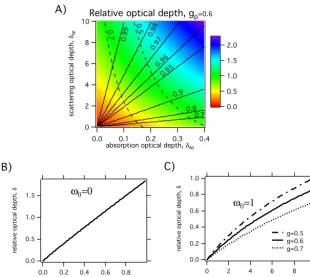
The relative optical depth of the two-layer system (layers 1a and 1b) is simulated using Eq. (12) for a range of parti-cle scattering (0 <δsp< 10) and absorption (0 <δap< 1)
opti-cal depths. Asymmetry parameters were chosen between 0.5 and 0.7, which is approximately the range of values found in an aerosol monitoring network (Fiebig and Ogren, 2006) for PM10 particles under dry conditions. In Fig. 6a the
depen-dence on particle loading in terms of relative optical depths is shown for a particle asymmetry parameter of gp=0.6.
10
8
6
4
2
0
sc
at
te
rin
g
op
ti
ca
l d
ep
th
,
δsp
0.4 0.3 0.2 0.1 0.0
absorption optical depth, δap
0 .7
0 .5
0.9 9
0.9 8
0.9 7
0.9 6
0.95
0.9
0.8 0.7
2.0
1.5
1.0
0.5
0.0
Relative optical depth, gp=0.6
1.5
1.0
0.5
0.0
re
la
ti
ve
op
ti
ca
l d
ep
th
,
δ
0.8 0.6 0.4 0.2 0.0
absorption optical depth, δap
ω0=0
1.0
0.8
0.6
0.4
0.2
0.0
re
la
ti
ve
op
ti
ca
l d
ep
th
,
δ
8 6 4 2 0
scattering optical depth, δsp
g=0.5 g=0.6 g=0.7
ω0=1
A)
B) C)
Figure 6. Modeled relative optical depth. (a) Relative optical depth for ranges of particle absorption and scattering optical depths for a
particle asymmetry parameter ofgp=0.6. The solid lines are isolines for single-scattering albedos and the dashed lines indicate isolines for
relative transmittances. (b) Relative optical depth for hypothetical absorbing but not scattering particles. (c) Relative optical depth for loading with non-absorbing particles with particle asymmetry parameters from 0.5 to 0.7.
shows the dependence of relative optical depth to scattering-only particles for different values of the asymmetry parame-ter.
3.3 Model constraints
This chapter introduces the concept of the CTS correction scheme.
A two-layer model can be used for modeling the op-tical properties of particle-loaded filters qualitatively, but not quantitatively. The basic concept for using the model quantitatively is to constrain modeled results to agree with experimental results. The relative optical depth δ is related to the transmittance when loading a filter with particles (cf. Eq. 12). We define sensitivity functions by
Fa(δap)=
δ(δap, δsp=0)
δap
(18) and
Fs(δsp, gp)=
δ(δap=0, δsp, gp)
δsp
. (19)
Equations (18) and (19) are the sensitivities to pure black and white particles, respectively. For Eq. (18) the asymmetry parameter is not defined since there is no scattering. In real-ity, scattering always occurs, so the definition ofFais merely
an idealization of the model. The error introduced by this approximation is smaller than 1 % for filter transmittances between 1.0 and 0.7. For a mixed population of absorbing and scattering particles, we introduce the mixed-term func-tionFf(δap, δsp, gp). This function is the ratio of the sum of
relative optical depths of pure scattering and absorbing parti-cles to the relative optical depth for the mixed aerosol. Ff δap, δsp, gp=
δ δap=0, δsp, gp+δ δap, δsp=0
δ δap, δsp, gp
. (20)
Then the relative optical depth can be written as δ(δap, δsp, gp)=
Fs(δsp, gp)·δsp+Fa(δap)·δap
Ff(δap, δsp, gp)
. (21)
A fundamental property ofFf(δap, δsp, gp)is that, by
def-inition, it equals unity for non-absorbing (δap=0) and
non-scattering (δsp=0) particles. Figure 7 showsFffor an
asym-metry parameter of 0.6. Single-scattering albedos from 0.7 to 0.99 and relative transmittances of 0.5 and 0.7 are indicated by isolines.
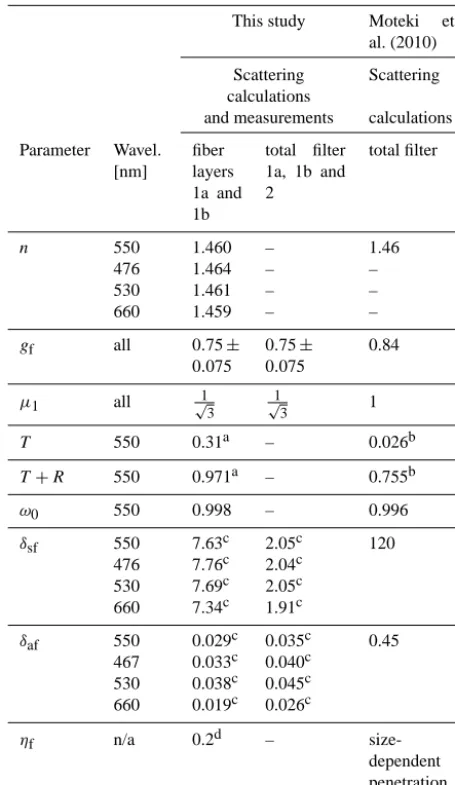
Table 1. Overview of parameters of fibrous filters. For comparison,
values are given for wavelength 550 nm and for the wavelengths of PSAP.
This study Moteki et al. (2010)
Scattering calculations
Scattering
and measurements calculations
Parameter Wavel. [nm]
fiber layers 1a and 1b
total filter 1a, 1b and 2
total filter
n 550 1.460 – 1.46
476 1.464 – –
530 1.461 – –
660 1.459 – –
gf all 0.75±
0.075
0.75±
0.075
0.84
µ1 all √1
3 1
√
3 1
T 550 0.31a – 0.026b
T+R 550 0.971a – 0.755b
ω0 550 0.998 – 0.996
δsf 550 7.63c 2.05c 120
476 7.76c 2.04c 530 7.69c 2.05c 660 7.34c 1.91c
δaf 550 0.029c 0.035c 0.45 467 0.033c 0.040c
530 0.038c 0.045c 660 0.019c 0.026c
ηf n/a 0.2d –
size-dependent penetration depth
aMeasurement.bCalculated with Eqs. (18) and (19) in Moteki et al. (2010).c10 %
uncertainty.d50 % uncertainty.
simplification. First, the model assumes that particles are uni-formly deposited within the top layer of the filter, whereas in a real filter the deposition profile would decrease exponen-tially (cf. Moteki et al., 2010). Second, the scattering of light by particles and fibers is assumed to be independent, which means that no interference between particle and fiber scatter-ing occurs. Another model simplification is the assumption of a perfectly diffuse illumination. In addition, there might be more artifacts that are not considered in the model. Based on these considerations, an experimental calibration of the theoretical model is indispensable.
From calibration experiments (superscript exp), one can calculate the sensitivitiesFsexp(δsp, gp)andF
exp
a (δap).
How-ever, it is difficult to gather enough data for an
10
8
6
4
2
0
sc
at
te
rin
g
op
ti
ca
l d
ep
th
,
!sp
0.4 0.3
0.2 0.1
0.0
absorption optical depth, !ap
0.9 9
0.9 8
0.9 7
0.96
0.95
0.9
0.8 0.7 0
.7
0
.5 1.4
1.3
1.2
1.1
1.0 Mixed term Ff , gp=0.6
Figure 7. Mixed-termFfversus scattering and absorption optical
depth for a particle asymmetry parameter of 0.6. Shown are lines for single-scattering albedos (solid lines) from 0.7 to 0.99 and for relative transmittances (dashed lines) of 0.5 and 0.7.
mental determination of the mixed-termFf(δap, δspgp), since
Ff has three independent variables. Instead, the two-stream
model is used for modeling (superscript mod) sensitivities Fsmod(δsp, gp, Xf)andFamod(δa, Xf), whereXfstands for the
model parameters of the pristine filter. Then the mixed-term Ffmod(δap, δsp, gp, Xf)is given by
Ffmod(δap, δsp, gp, Xf)=
Fsmod(δsp, gp, Xf)·δsp+Famod(δap, Xf)·δap
δmod(δ
ap, δsp, gp)
. (22)
The concept for constraining the two-stream model is to combine sensitivity functions for black and white particles derived from experiments and the modeled mixed-term func-tion for grey particles. The relative optical depth then can be written as
δ(δap, δsp, gp)=
Fsexp(δsp, gp)·δsp+Faexp(δap)·δap
Ffmod(δap, δsp, gp, χf)
. (23) The meaning of Eq. (23) is that the model is bound to experimental calibrations for pure black and pure white aerosols, and the mixed-term function can be interpreted as a modeled interpolation for cases when both absorption and scattering occur. The parameters describing the physical properties of the filter are solely used in the modeled mixed-term function. In the following, Eq. (23) is abbreviated as
δ=CTS(δap, δsp, gpXf). (24)
include filter sampling artifacts. The radiative transfer model is not able to handle these artifacts, but the CTS algorithm inherently compensates for sampling artifacts from the ex-perimental calibration corrections.
3.4 Calculation of absorption coefficients
For deriving the absorption optical depth from Eq. (24), the particle scattering optical depth and the particle asymmetry parameter must be known. In Sect. 4.2 we will show how these parameters are derived from a total and backscattering integrating nephelometer. For calculating the particle absorp-tion optical depthδap, an iterative solver is needed. We used
a Newton-type approximation because of its simplicity, but any other solver should work as well. The first step in the iterative solution is to make a first guess of the absorption optical depth δap0 and to calculate the relative optical depth δ(0) using Eq. (24). Then the absorption optical depth δap(k)
for thekth iteration step is given by δapk+1=
δap(k)−(δ(k)−δmeas)· dCTS(δ
(k)
ap, δmeassp , gmeasp )
dδ(k)ap
!−1
. (25) The iteration is stopped when the difference between mea-sured and calculated relative optical depth δ(k)−δmeasis small (∼10−6). In most cases the Newton approximation converges with less than 10 iteration steps. The number of iteration steps depends on the filter and scattering optical depths and on the choice of the starting value for δap. A
starting value close to the absorption optical depth of the previous measurement of a time series reduces the num-ber of iterations steps considerably. The CTS function in-creases strictly monotonically with increasing absorption op-tical depth. Thus the iterative solver gives a unique solution for the absorption optical depth.
The absorption coefficient is calculated from two consec-utive absorption optical depths by
σap(t )=
A
Q 1t δap(t )−δap(t−1t )
, (26)
where1tis the time step between two measurements. The basic difference between the CTS correction and the B1999 and V2005 corrections is that the CTS correction first corrects the relative optical depth for the scattering and filter artifacts. The result is the absorption optical depth, from which the absorption coefficient is calculated from the change in the optical depth with time. This is a kind of a differentiation but with discrete data. The advantage of first correcting for filter and scattering artifacts is that the loading state is specified by scattering and absorption optical depths. In contrast, the B1999 and V2005 corrections start with a differentiation of the time series of the attenuation. After the differentiation the only loading-related parameter is the rel-ative transmittance, which means that a loss of information
has occurred. Afterwards, scattering and filter artifacts are corrected but with less information on the loading state. Ad-ditionally the CTS correction accounts for the particle asym-metry parameter, which is not considered in the B1999 and V2005 corrections.
4 Calibration experiments 4.1 Black particles
The relative transmittanceτ and relative optical depthδ are derived from the ratio of the actual intensity and the intensity prior to loading the filter, and are defined by (cf. Eq. 2) δ (t )= −ln(τ (t ))= −ln
I (t )
I (0)
= −ln
I (t ) /I
i
I (0) /Ii
=δtot(t )−δtot(0) . (27)
Equation (27) also shows the connection between relative and total optical depths.
The ratio of particle absorption coefficient and filter atten-uation coefficient (σ (t ) in Eq. 1) is the filter transmission function:
ftr τ (t ), σsp(t )=
σap(t )
σ (t ) . (28)
For black particles the filter transmission function ac-counts for the enhancement effect due to scattering of light in the fiber matrix. Filter transmission functions for the PSAP were derived during calibration experiments leading to dif-ferent correction methods, i.e., the B1999 and V2005 cor-rections. For convenience, the time dependence is omitted throughout the rest of the manuscript.
Calibration of filter-based absorption photometers neces-sarily requires a reference method for measuring particle ab-sorption. In Bond et al. (1999) the PSAP was calibrated using the difference of extinction minus scattering of airborne par-ticles (unaltered/not collected on filter or other substrate) as the reference. The filter transmission function of the B1999 correction scheme is given by
ftr,B1999(τ, σsp, σ )=
1 c1·τ+c2
−sσsp
σ , (29)
with the constantsc1=1.555,c2=1.023, ands=0.0164.
The constants given here differ from values given in Bond et al. (1999), since corrections for spot size and a further wave-length adjustment are included. For details, the reader is re-ferred to Ogren (2010). Scattering coefficients in the B1999 correction are not corrected for the illumination and trunca-tion error (Anderson et al., 1996). For non-scattering parti-cles (σsp=0) the filter transmission function is
ftr,B1999,black(τ )=
1 c1·τ+c2
Constrained Model: rela&ve op&cal depth
(Eqs. 23,24) The constrained model is the mixing of the modelled filter sensi&vity func&on with experimentally determined sensi&vity func&ons for par&cle scaCering and absorp&on.
Experiment: sensi&vity to par&cle scaCering
(Eq. 36)
! !
(
ap,!sp,g)
Fs
exp !
sp,gp
(
)
Experiment: sensi&vity to par&cle absorp&on
(Eqs. 31,34)
Fa
exp !
ap
( )
Model: Defini&on of filter sensi&vity func&on
(Eq. 20)
Ff
(
!ap,!sp,gp)
Model: sensi&vity to par&cle scaCering
(Eq. 19)
Fs
(
!sp,gp)
Model: sensi&vity to par&cle absorp&on
(Eq. 18)
Fa
( )
!apModel: rela&ve op&cal depth
(Eq. 21) Remark: this is the same op&cal depth as in Eq. (12) but wriCen in the formalism of sensi&vity func&ons.
! !
(
ap,!sp,g)
Model: rela&ve op&cal depth from two stream model
(Eq. 12) ! !
(
ap,!sp,g)
Model: ini&aliza&on of filter model (Sec. 3.2) !f=
{
!af,!sf,gf,!,µ1}
Itera4ve solver: calcula&on of absorp&on op&cal depth
(Eq. 25) !ap
Measurement: Measurement of total op&cal depth with photometer
(Eq. 2) !=!tot
Measurement: Measurement of par&cle scaCering op&cal depth and average asymmetry parameter with nephelometer
(Eqs. 35, 5) !sf, gf
Absorp4on:
Calcula&on of absorp&on coefficients (Eq. 25) !ap
Figure 8. Overview of model implementation, constraints to experimental sensitivity functions, and retrieval of absorption from
measure-ments with absorption photometers and measuremeasure-ments of scattering properties.
Filter transmission functions based on “coefficients” are unhandy since radiative transfer models need optical depths. Equation (30) can be written in terms of relative optical depths by
δ(δap)=ln
ec2δap+ln(c1+c2)−c
1
c2
!
. (31)
The derivation of Eq. (31) is given in Appendix A.
During the Reno Aerosol Optics Study (RAOS; Sheridan et al., 2005), different reference methods with photoacous-tic spectrometers, extinction coefficient minus scattering co-efficient, and cavity ring-down instruments were available. Results from the RAOS experiment revealed agreement be-tween photoacoustic and extinction-minus-scattering meth-ods of ∼3–7 % for a variety of absorbing aerosols. Exper-iments with high absorption coefficients up to 800 Mm−1 showed differences of less than 3 %, indicating the good performance of these two fundamentally different reference methods. Consequently, the average of these two methods
was used as the reference absorption for evaluating the per-formance of filter-based absorption photometers, including MAAPs (Petzold et al., 2005), Aethalometers (Arnott et al., 2005), and PSAPs (Virkkula et al., 2005). In addition to a three-wavelength PSAP with modified optics, a standard single-wavelength PSAP, identical to instruments used in many laboratories and long-term monitoring sites, was com-pared to the reference absorption. Wavelengths of this type of PSAP are given to be 565 nm (Radiance Research, Operating manual), 567 nm (Bond et al., 1999), 574 nm (Virkkula et al., 2005), and 586 nm (Müller et al., 2011). The optical wave-length has to be accounted for when comparing to other in-struments. For adjusting wavelengths of the PSAP and neph-elometer, we refer the reader to Ogren (2010).
In Virkkula et al. (2005) and Virkkula (2010), the filter transmission function is given by
ftr,V2005(τ, ω0)=c1+c2(h0+h1ω0)ln(τ )−s
σsp
1.4
1.2
1.0
0.8
0.6
0.4
0.2
0.0
re
la
ti
ve
op
ti
ca
l d
ep
th
,
!
0.8 0.6
0.4 0.2
0.0
absorption optical depth, !ap unconstrained two stream model, !0=0
B1999, !0<0.5
V2005, !0"0.3
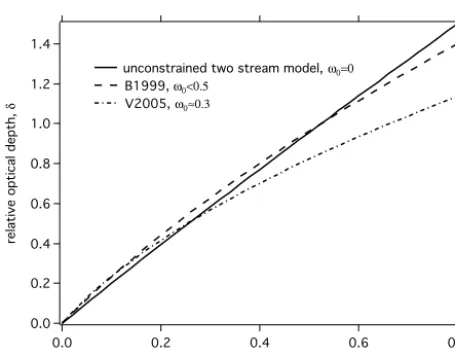
Figure 9. Comparison of the unconstrained two-stream model and
experimental calibrations in B1999 and V2005. Shown are the rel-ative optical depths versus the particle absorption optical depth.
with c1=0.354±0.009, c2= −0.617±0.016, h0=
1.192±0.219,h1= −0.800±0.336, ands=0.023 for the
single-wavelength PSAP. Values for a three-wavelength PSAP were not used, since that instrument was a modi-fied prototype that differs slightly from the commercially available multi-wavelength PSAP. Equation (32) can only be solved iteratively, but for black particles withω0=0 and
σsp=0 the analytical solution is
ftr,V2005(τ )=c1+c2h0ln(τ ). (33)
Equation (33) expressed as relative optical depth is
δ(δap)=
s
c
1
c2h0
2
−2δap
c2h0
+ c1
c2h0
. (34)
The derivation of Eq. (34) is given in Appendix B.
There are obvious differences between the filter transmis-sion functions of the B1999 and V2005 corrections (Fig. 9) that are not yet understood. However, the purpose of this manuscript is not to present a new calibration with black par-ticles but to introduce a new concept based on a radiative transfer model. We will evaluate the sensitivity of the CTS method to these two filter transmission functions.
4.2 White particles
The response of PSAPs to white particles was measured in the laboratory. A solution of NaCl was nebulized, passed through a cyclone, and dried. Effective particle sizes and thus particle asymmetry parameters were varied by chang-ing the operatchang-ing conditions of the nebulizer. The response to NaCl particles was measured by two three-wavelength PSAPs and a three-wavelength, total and backscattering, in-tegrating nephelometer (TSI, model 3563). Scattering coef-ficients were corrected for angular non-idealities using the
parameterization given in Anderson and Ogren (1998). The scattering optical depth was calculated for the PSAPs by
δsp,n=
Q1t A
n
X
i=1
σsp,i. (35)
The summation starts with the beginning of loading the fil-ter. Asymmetry parameters for each wavelength were deter-mined from the measured hemispheric backscattering frac-tion using a relafrac-tion given in Andrews et al. (2006). Asym-metry parametersgp ranged from about 0.45 to 0.68.
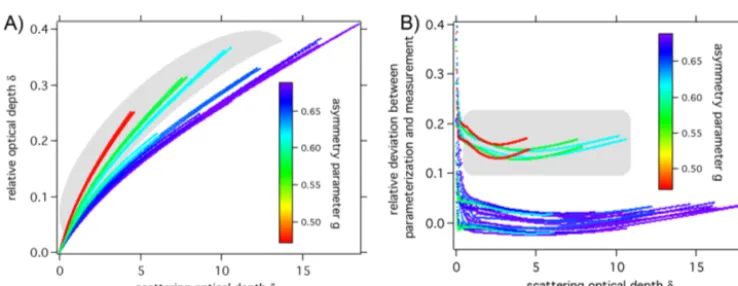
Fig-ure 10a shows the measFig-ured dependence of the relative op-tical depth on the scattering opop-tical depth. It can be seen that there is a pronounced dependence on the particle asym-metry parameter. A parameterization describing this depen-dence was found to be
δ(δsp, gp)=δsp·
a5+ a0+a1gp·e
−
ln(δsp)+a2 a3+a4gp
4
, (36)
with a0=0.1509, a1= −0.1611, a2=4.5414,
a3= −5.7062,a4= −1.9031, anda5=0.01. The choice of
a suitable parameterization was motivated by (i) having a constant, (ii) a term with linear dependence on the asymme-try parameter, and (iii) a loading term with an exponential decrease. Figure 10b shows relative differences between measured and parameterized relative optical depths.
Equation (36) accounts for two particle size effects. Smaller particles usually have smaller asymmetry parame-ters. Furthermore, smaller particles penetrate deeper into the filter, which influences the transmittance as discussed in the context of a size-dependent absorption enhancement. Thus, there seems to be a coupling between asymmetry parame-ter and particle penetration depth. No measurements with a particle size spectrometer were done. Thus we can not sepa-rate these two effects from the measurements. Nevertheless, because of the coupling, the effect of a size-dependent parti-cle penetration depth is implicitly considered by the partiparti-cle asymmetry parameter. A detailed analysis of the strength of the coupling is beyond the scope of this manuscript and re-quires more experiments.
Figure 10. (a) Measured relative optical depths versus measured scattering optical depths for the three wavelengths of two PSAPs.
The particle asymmetry parameter is color coded. (b) Relative deviation of measured and parameterized optical depths defined by δmeas−δparam/δmeas. The greyish areas indicate data with high scattering Ångström exponents, for which the parameterization has a higher uncertainty.
explanation could be an invalid model assumption that the asymmetry parameter and the scattering optical depth solely describe the scattering artifact. Furthermore the calculation of the asymmetry parameter from the measured backscat-ter fraction might be inaccurate for particle populations with high scattering Ångström exponents. However, the maximum deviation of about 20 % is much smaller than the 100 % uncertainty in the scattering correction given in Bond et al. (1999). Thus a deeper investigation of this issue was not done.
The error of the scattering parameterization is calculated by the root mean square of the relative deviation between parameterization and measurement:
1δrms=
s
1 N
Xδparam−δmeas
δmeas
2
. (37)
Mathematically this is identical to the standard deviation of the relative deviation. The error is about 9 % for all data and 7 % when excluding noisy data at low loadings (δ< 0.2) and excluding small asymmetry parameters (g< 0.55), which are relatively rare for ambient aerosols (Fiebig and Ogren, 2006) and correspond to the branch with scattering Ångström exponents of 2.5.
5 Error analysis 5.1 General approach
The errors of the CTS algorithm due to one or more erro-neous input parameters are investigated by means of error propagation. Generally, if 9 is a function ofi independent input parameters 8i,9=F (8i), the error of 9 is
calcu-lated by
19= v u u t
X
i
∂ F (8
i)
∂ 8i
18i
2
, (38)
where18iis the error of8i. TheF functions of interest
are Eqs. (24), (25), and (26) for the relative optical depth, absorption optical depth, and absorption coefficient, respec-tively. Although the F functions are results of an iterative solver, theF functions are sufficiently smooth to allow for a numerical calculation of the local derivatives. Errors are calculated for ranges of scattering (0 to 10) and absorption (0 to 1) optical depths to investigate the errors for different possible loading states.
5.2 Wavelength dependence of filter optical parameters In this section we investigate the influences of the wave-length dependencies of the filter scattering and absorption optical depths on the retrieval of the particle absorption optical depth. Equation (25) is used as the F function in Eq. (38). The uncertain variables (8i)are the filter absorption
and scattering optical depths, with values ofδsf=7.62 and
δaf=0.029 and a relative variability of1δsf/δsf=3 % and
1δaf/δaf=35 % at the wavelengths of a three-wavelength
5.3 Prediction of relative optical depth
In this section we investigate the error for predicting the rel-ative optical depth. Discussion of this error is easy since the iterative solver is not needed. Uncertainties influencing the prediction of the relative optical depth (Eq. 24) are uncer-tainties in the filter parameters and the unceruncer-tainties in the particle optical depths.
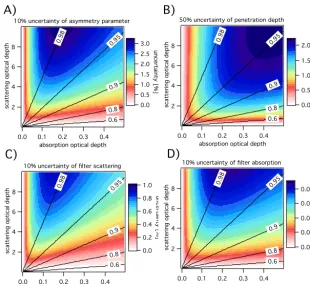
The filter parameters (and relative uncertainties) areδsf=
7.62 (10 %),δaf=0.029 (10 %),gf=0.75 (10 %), andηf=
0.2 (50 %). Relative uncertainties in the relative optical depth from the individual contributions are shown in Fig. 11 for particle scattering optical depths from 0 to 10 and particle absorption optical depths between 0 and 0.5, with a parti-cle asymmetry parameter of 0.7. The largest uncertainties emerge due to the uncertainties in the filter asymmetry pa-rameter and particle penetration depth. In general, uncertain-ties are largest for single-scattering albedos between 0.95 and 0.98. For single-scattering albedos ω0=0 andω0=1, the
model uncertainties tend towards zero, since for these limit-ing cases the relative optical depth is completely determined by the experimental calibrations. The approach of constrain-ing the radiative transfer model to experimental calibrations suppresses uncertainties in the input parameters to the model output.
The error in predicted relative optical depths due to uncer-tainties in the particle optical depths and asymmetry parame-ters is discussed in the following. Uncertainties in correction schemes for black particles are on the order of 20 % (Bond et al., 1999), including uncertainties in the PSAP and refer-ence instruments. In Virkkula et al. (2005), the uncertainty in the parameterization is given to be about 3 %, whereas uncertainties in the reference absorption were not consid-ered. A comparison of B1999 and V2005 corrections given in Baumgardner et al. (2012) affirmed that the error is of the order of 20 %. Errors of the scattering optical depth result from calibration uncertainties of about 3 % (Heintzenberg et al., 2006) and from uncertainties in the truncation error. For investigating the scattering artifacts we used the truncation correction given in Anderson and Ogren (1998). With this method the error in the scattering coefficient is about 2 % for a wide range of atmospheric aerosols and can be up to 5 % for strongly absorbing particles (Bond et al., 2009). In the following the total uncertainty in the scattering optical depth is assumed to be 7 %. Asymmetry parameters can be estimated from a parameterization of the backscatter fraction measured with nephelometers (Andrews et al., 2006). Fiebig and Ogren (2006) compared asymmetry parameters derived with this method and asymmetry parameters retrieved by an inversion algorithm from data of monitoring stations with aerosols classified as being arctic, continental, and marine. Differences of 3 to 4 % and in extreme cases up to 14 % were attributed to a large part to assumptions made in calculat-ing the asymmetry parameter from the measured backscatter fraction. For further error analysis we used an uncertainty in
the asymmetry parameter of 10 %, which lies between the expected and extreme values. The error of the relative optical depth is shown in Fig. 12, for 7 % error of the particle scat-tering (panel a), for 20 % of the particle absorption (panel b), and for 10 % of the particle asymmetry parameter (panel c).
The total error of the relative optical depth including un-certainties in the filter and particle parameters is shown in Fig. 13a. The same data are plotted as a function of the single-scattering albedo in Fig. 13b. There is no large vari-ation of the uncertainty between single-scattering albedos from 0.2 to 0.95. In this range the error is dominated by the error of the absorption measurement. For single-scattering albedos above 0.95, the errors of the scattering and asymme-try parameters dominate. Comparing Figs. 11 and 12, it can be seen that the model uncertainties are small compared to uncertainties in the calibration measurements.
5.4 Error of retrieved absorption coefficients
The error of the retrieved absorption optical depth was de-rived similarly. The absorption optical depth is calculated us-ing Eq. (25). The error is calculated considerus-ing all uncer-tainties, including the uncertainties in filter parameters, par-ticle scattering optical depth and asymmetry parameter, and uncertainties in the PSAP calibration. The black particle cal-ibration was taken from the B1999 correction. The relative uncertainty1σap/σapof this CTS-B1999 correction is shown
in Fig. 14a. Similarly the uncertainty was calculated for the original B1999 correction. Relative errors for the CTS-B1999 and CTS-B1999 correction are shown in Fig. 14b versus the single-scattering albedo. For low single-scattering albedos the uncertainties are similar for both methods, since the pa-rameterization for black particles was taken from the B1999 correction. At high single-scattering albedos the uncertainty in the CTS correction is much smaller than the B1999 correc-tion, e.g., the uncertainty level of 50 % is reached at a single-scattering albedo of 0.99 and 0.95 for the CTS-B1999 and for the B1999 corrections, respectively.
6 Comparison of correction methods
8 6 4 2 sc at te rin g op ti ca l d ep th 0.4 0.3 0.2 0.1 0.0
absorption optical depth 0.9 8 0.9 5 0.9 0.8 0.6 3.0 2.5 2.0 1.5 1.0 0.5 0.0 unce rtai nty [ %]
10% uncertainty of asymmetry parameter
8 6 4 2 sc at te rin g op ti ca l d ep th 0.4 0.3 0.2 0.1 0.0
absorption optical depth 0.9 8 0.9 5 0.9 0.8 0.6 2.0 1.5 1.0 0.5 0.0 unce rtai nty [ %]
50% uncertainty of penetration depth
8 6 4 2 sc at te rin g op ti ca l d ep th 0.4 0.3 0.2 0.1 0.0
absorption optical depth 0.9 8 0.9 5 0.9 0.8 0.6 1.0 0.8 0.6 0.4 0.2 0.0 unce rtai nty [ %]
10% uncertainty of filter scattering
8 6 4 2 sc at te rin g op ti ca l d ep th 0.4 0.3 0.2 0.1 0.0
absorption optical depth 0.9 8 0.9 5 0.9 0.8 0.6 0.08 0.06 0.04 0.02 0.00 unce rtai nty [ %]
10% uncertainty of filter absorption
A)
B)
C)
D)
Figure 11. Relative uncertainties in the relative optical depth caused by uncertainties in (a) filter asymmetry parameter; (b) particle layer
thickness; and (c) and (d) filter scattering and absorption optical depth, respectively. Uncertainties were calculated for ranges of particle scattering and absorption optical depth and for a particle asymmetry parameter of 0.7. The solid lines indicate constant single-scattering albedos.
scattering (Sheridan et al., 2005). Values from the PSAP were corrected using the B1999, V2005, and CTS methods.
Data from several experiments were classified accord-ing to the saccord-ingle-scatteraccord-ing albedo. The ranges of saccord-ingle- single-scattering albedos (number of experimental runs, and the to-tal time in minutes) are 0.98 to 0.97 (7 runs, 332 min), 0.95 to 0.94 (2 runs, 129 min), 0.9 to 0.86 (9, 400 min), 0.84–0.7 (9, 415 min), black (2, 104 min), and white (13 runs, 755 min). Black denotes a range of single-scattering albedos from 0.25 to 0.6, and white stands for a single-scattering albedo of unity. For the CTS correction, black particle loading correc-tions from both B1999 (Eq. 31) and V2005 (Eq. 34) were used. The corrections are denoted as B1999 and CTS-V2005, respectively. Ratios of corrected absorption coeffi-cients and the reference absorption were calculated. Fig-ure 15 shows median values and 25th and 75th percentiles for all classes of single-scattering albedos. For experiments with white particles, apparent absorption coefficients divided by the scattering coefficient are shown. It can be seen that the ratios for CTS-V2005 and V2005 scheme are close to unity for black particles and single-scattering albedos be-tween 0.7 and 0.84. This is not surprising since the V2005 correction and accordingly also the black particle correction for CTS-V2005 were derived from the same data set from the
RAOS study. For higher single-scattering albedos between 0.95 and 0.98, the ratios are 1.52 for B1999; 1.16 for V2005; and 1.07 and 1.04 for CTS-B1999 and CTS-V2005, respec-tively. For single-scattering albedos above 0.9, the span be-tween the 25th and 75th percentiles is significantly smaller for the CTS corrections compared to B1999 and V2005. This and the better ratio at high single-scattering albedos can be explained by considering a parameterization for the scatter-ing and asymmetry parameter in the new loadscatter-ing correc-tion. For white particles, the ratios of apparent absorption and scattering for CTS, B1999, and V2005 corrections are 0.0008, 0.015, and 0.005, respectively. The spans of 25th and 75th percentiles for CTS are remarkably smaller com-pared to B1999 and V2005. The method comparison shows that the concept of CTS significantly reduces uncertainties in the particle absorption at high single-scattering albedos.
7 Summary and outlook
ap-8 6 4 2 sc at te rin g op ti ca l d ep th 0.4 0.3 0.2 0.1 0.0
absorption optical depth 0.9 8 0.9 5 0.9 0.8 0.6 15 10 5 0 unce rtai nty [ %]
10% uncertainty of asymmetry parameter 8 6 4 2 sc at te rin g op ti ca l d ep th 0.4 0.3 0.2 0.1 0.0
absorption optical depth 0.9 8 0.9 5 0.9 0.8 0.6 6 5 4 3 2 1 0 unce rtai nty [ %]
7% uncertainty of particle scattering
8 6 4 2 sc at te rin g op ti ca l d ep th 0.4 0.3 0.2 0.1 0.0
absorption optical depth 0.9
8
0.95
0.9 0.8 0.6 20 15 10 5 0 unce rtai nty [ %]
20% uncertainty of particle absorption
A)
C)
B)
Figure 12. Relative uncertainties in the relative optical depth caused by uncertainties in the particle characterizations: (a) particle scattering, (b) particle absorption, and (c) particle asymmetry parameter. The solid lines indicate constant single-scattering albedos.
8 6 4 2 sc at te rin g op ti ca l d ep th 0.4 0.3 0.2 0.1 0.0
absorption optical depth 0.9 8 0.9 5 0.9 0.8 0.6 20 18 16 14 12 unce rtai nty [ %] total uncertainty
A)
B)
25 20 15 10 5 0 unce rtai nty [ %] 1.0 0.8 0.6 0.4 0.2single scattering albedo
Figure 13. (a) Total uncertainty in the relative optical depth calculated by propagation of uncertainties by model and experimental calibration. (b) Total uncertainties versus particle single-scattering albedo.
plying the CTS method, simultaneous measurements of the particle scattering coefficient and asymmetry parameter are needed, which can be derived from total and backscattering nephelometers. In the present paper the CTS method is intro-duced for PSAPs. However, the method can be implemented for any other filter-based absorption photometer that sures light transmittance, e.g., the Aethalometer, after mea-suring the optical properties of the filter and the responses to absorbing and non-absorbing particles.
coef-8
6
4
2
sc
at
te
rin
g
op
ti
ca
l d
ep
th
0.4 0.3 0.2 0.1 0.0
absorption optical depth 0.9
8
0.9 5
0.9
0.8 0.6
2 3 4 5 6
100 2
unce
rtai
nty
[
%]
Relative uncertainty of retrieved absorption coefficients using CTS-B1999
A)
B)
100
80
60
40
20
0
unce
rtai
nty
[
%]
0.8 0.6 0.4 0.2
single scattering albedo 1.00 0.98 0.96 CTS-B1999 B1999
Relative uncertainty of absorption coefficients using CTS-B1999 and B1999
Figure 14. (a) Total relative uncertainty in absorption coefficients retrieved by CTS using the B1999 black aerosol calibration (CTS-B1999).
The uncertainty is calculated by error propagation of model and calibration uncertainties. (b) Total uncertainty in absorption coefficients versus particle single-scattering albedo for CTS-B1999 (black) and for B1999 (red).
0.6 0.8 1 1.2 1.4 1.6 1.8 2
PSAP
/
R
EF
B1999
0.6 0.8 1 1.2 1.4 1.6 1.8 2
PSAP
/
R
EF
V2005
-‐0.005 0 0.005 0.01 0.015 0.02 0.025
PS
AP
/
RE
F
white
0.6 0.8 1 1.2 1.4 1.6 1.8 2
PSAP
/
R
EF
CTS-‐B1999
0.6 0.8 1 1.2 1.4 1.6 1.8 2
PSAP
/
R
EF
CTS-‐V2005
Figure 15. Recalculated PSAP absorption coefficients of the RAOS campaign. The left four plots show absorption coefficients for the two
CTS corrections and the B1999 and V2005 corrections divided by the reference absorption. In each subplot, median values (open squares) and 25th and 75th percentiles (whiskers) are shown for ranges of single-scattering albedos. The right plot shows the apparent absorption coefficient measured by the three PSAP correction schemes divided by the scattering coefficient for experiments with white particles.
ficients was derived. The CTS method shows significantly smaller uncertainties for single-scattering albedos larger than 0.9 compared to the well-established correction by Bond et al. (1999). For example, the uncertainties in the B1999 and CTS corrections at a single-scattering albedo of 0.98 are 100 and 30 %, respectively. The uncertainties in both methods for single-scattering albedos below 0.8 are very similar with
val-ues of about 20 %. A comparison of correction methods with data from an independent experiment, the Reno Aerosol Op-tics Study, confirmed the significant improvements for high single-scattering albedos.
uncer-tainties in filter-based absorption photometers requires bet-ter experimental calibrations. Additionally, a size-dependent particle penetration depth, and thus a size-dependent sensi-tivity, should be included in upcoming correction methods. A coupled model of sampling theory and radiative transfer
Appendix A: Reformulation of B1999 correction The filter transmission function for the B1999 correction without particle scattering is given by
fB1999(τ (t )):=
σap(t )
σ (t ) = 1 c1·τ (t )+c2
. (A1)
First, the independent variabletis replaced by the lengthl, which is the column of air sucked through the filter. Using the basic relationsδ(l)= −ln(τ (l))andσ (l)= d
dlδ(l), we get
σap(l)= d dlδ(l)
c1·e−δ(l)+c2
. (A2)
Integration of Eq. (A2) in the intervall= [0, L] and using the relationRL
0σap(l)dl=δap(L)−δap(0)leads to
δap(L)−δap(0)= L
Z
0
" d
dlδ(l)
c1·e−δ(l)+c2
#
dl. (A3)
The right-hand side may be rewritten as
. . .=
L
Z
0
"
eδ(l)dldδ(l) c1+c2eδ(l)
#
dl. (A4)
Substitutingx(l)=c1+c2eδ(l)anddldx(l)=c2eδ(l)dldδ(l)
leads to
. . .=
L
Z
0
" 1 c2
d dlx(l)
x(l)
#
dl= 1
c2 L
Z
0
d
dlln(x(l))
dl
=ln(x(L))−ln(x(0))
c2
. (A5)
With boundary conditions for an initially unloaded filter δap(0)=0 andδ(0)=0, Eq. (A3) can be written as
δap(L)=
ln(c1+c2eδ(L))−ln(c1+c2)
c2
. (A6)
Further reformulation to separate the filter optical depth yields
ln(c1+c2eδ(L))=c2δap(L)+ln(c1+c2), (A7)
⇔c2eδ(L)=ec2δap(L)+ln(c1+c2)−c1, (A8)
⇔δ(L)=ln e
c2δap(L)+ln(c1+c2)−c
1
c2
!
=ln (c1+c2)e
c2δap(L)−c1
c2
!
. (A9)
Appendix B: Reformulation of V2005 correction The filter transmission function for non-scattering particles is given by
fV2005(τ (t )):=
σap(t )
σ (t ) =c1+c2h0ln(τ (t )). (B1) The independent variabletis replaced by the lengthl, and with relations δ= −ln(τ ) andσ (l)= d
dlδ(l) Eq. (B1) may
be written as c1
d
dlδ(l)−c2h0δ(l) d
dlδ(l)=σap(l). (B2)
Equation (B2) is solved by integration over the interval l= [0, L]
L
Z
0
c1
d
dlδ(l)−c2h0δ(l) d dlδ(l)
dl=
L
Z
0
σap(l)dl. (B3)
The solution of the integral equation is c1δ(L)−
1
2c2h0δ(L)
2−c 1δ(0)+
1
2c2h0δ(0)
2=
δap(L)−δap(0). (B4)
Rearranging of Eq. (B4) and using the boundary condi-tions for an initially unloaded filterδ(0)=0 andδap(0)=0
yields c1δ(L)−
1
2c2h0δ(L)
2=δ
ap(L). (B5)
The solution of the quadratic equation is
δ(L)= s
c
1
c2h0
2
−2δap(L)
c2h0
+ c1
c2h0
. (B6)
Appendix C
Table C1. Nomenclature.
Abbreviations
PSAP Particle Soot Absorption Photometer MAAP M