https://doi.org/10.5194/se-9-1141-2018
© Author(s) 2018. This work is distributed under the Creative Commons Attribution 4.0 License.
Multiscale porosity changes along the pro- and retrograde
deformation path: an example from Alpine slates
Ismay Vénice Akker1, Josef Kaufmann2, Guillaume Desbois3, Jop Klaver4,5, Janos L. Urai3, Alfons Berger1, and Marco Herwegh1
1Institute of Geological Sciences, University of Bern, Bern, 3012, Switzerland
2Empa, Swiss Federal Laboratories for Materials Testing and Research, Dübendorf, 8600, Switzerland
3Structural Geology, Tectonics and Geomechanics, Energy and Mineral Resources Group, RWTH Aachen University, 52056
Aachen, Germany
4Structural Geology, Tectonics and Geomechanics, Energy and Mineral Resources Group, RWTH Aachen University, 52056
Aachen, Germany
5Map Microstructures and Pores GmbH, 52056 Aachen, Germany
Correspondence:Ismay Vénice Akker ([email protected]) Received: 28 May 2018 – Discussion started: 12 June 2018
Revised: 29 August 2018 – Accepted: 31 August 2018 – Published: 27 September 2018
Abstract.Estimating the porosity of slates is of great inter-est for the industries dealing with sub-surface areas such as CO2sequestration, nuclear waste disposal and shale gas but
also for engineering purposes in terms of mechanical stabil-ity for underground or surface constructions. In this study, we aim at understanding estimates of the porosity of slates from the Infrahelvetic flysch units (IFUs) in the Glarus Alps (east-ern Switzerland). Surface and sub-surface samples were col-lected along a temperature gradient from 200 to 320◦C and
therefore give the opportunity to link pore types along this temperature and deformation path. In addition, we indicate which porosity is the effect of surface processes and indicate the contribution of artificially induced porosity. The devel-oped workflow consists of a combination of bulk rock mea-surements including helium pycnometry (He pycnometry) and mercury intrusion porosimetry (MIP) with image analy-sis. Image analysis was performed with high-resolution scan-ning electron microscopy (SEM) on broad ion beam (BIB) prepared cross sections (BIB-SEM). Different vein genera-tions provide evidence of porosity formation at depth, as they present “paleo-porosity”. Towards peak metamorphic condi-tions (prograde path), porosity reduces to < 1 vol%, indicated by matrix porosity detected by BIB-SEM. During exhuma-tion (retrograde path) porosity increases due to the formaexhuma-tion of microfractures interpreted as the effect of unloading (open fractures). At the surface, porosity is further increased due
to the formation of macro-fractures (fracture apertures up to 1 mm), which are interpreted as being either due to the effect of weathering processes such as freeze and thaw cycles or ar-tificially induced by sample preparation. Additionally, poros-ity and pore morphology are strongly dependent on mineral-ogy, sample homogeneity and strain, which change dynami-cally in time and space.
1 Introduction
metamor-phic reaction (e.g. Dielforder et al., 2015; Rieke and Chilin-garian, 1974). The pore network defines the major fluid path-ways, and a detailed investigation of microstructural porosity is a key to better understanding the fluid flux and circulation of fluids in collisional orogens and orogenic wedges.
The porosity of a rock develops along the deformation path and with changing pressure and temperature (PT) conditions. A possible evolution starts with early compaction and diage-nesis on the prograde path, evolving to maximum burial, fol-lowed by metamorphism and possibly tectonic deformation on the retrograde path, eventually resulting in surface expo-sure (Horseman et al., 1996). Porosity is produced by pro-cesses such as grain dilation, grain boundary sliding, cavity formation and dissolution (Herwegh and Jenni, 2001; Fusseis et al., 2009; Gilgannon et al., 2017), and porosity is sealed by grain size reduction, compaction and precipitation, as ob-served for example in clay fault gauges (Holland and Urai, 2006; Laurich et al., 2014).
The first aim of this study is to give an estimate of the to-tal present-day porosity of a slate which underwent this full deformation-metamorphic cycle. The second goal is to es-tablish what causes the present-day total porosity and which evolutionary processes account for which type of porosity.
For this study, we focus on surface-collected slates from the Infrahelvetic flysch units (IFUs) in the Glarus Alps (eastern Switzerland), which are affected by large out-of-sequence thrusts, such as the Glarus thrust (e.g. Badertscher et al., 2002; Burkhard et al., 1992; Ebert et al., 2007; Her-wegh et al., 2008; Pfiffner et al., 2011; Poulet et al., 2014; Rahn and Grasemann, 1999; von Daeniken and Frehner, 2017). This specific area is of interest because it covers a temperature gradient, which positively correlates with back-ground strain. Tectonic processes change along this gradi-ent from soft sedimgradi-ent behaviour including particulate flow, at the lowest temperatures, to pressure solution at higher temperatures (Dielforder et al., 2016). Investigating porosity over this gradient would give an opportunity to link different pore types to such specific tectonic processes.
A variety of methods have been developed over the past decades to determine porosity, pore morphology and pore size distribution, each having a characteristic pore size range (Anovitz and Cole, 2015; Busch et al., 2017). Some common direct approaches include gas expansion techniques such as helium pycnometry (He pycnometry) and mercury intrusion porosimetry (MIP) (Anovitz and Cole, 2015; Tiab and Don-aldson, 2015). These techniques both yield information on the bulk-interconnected porosity in 3-D volumes. Recent de-velopments of surface-preparation-based ion beam milling (focused ion beam, FIB, and broad ion beam, BIB) allow imaging porosity down to nanometre scale on an almost per-fectly flat surface with scanning electron microscopy (SEM). These images are suitable for high-quality image segmenta-tion and the subsequent quantificasegmenta-tion of porosity in 2-D (e.g. Houben et al., 2013; Keller et al., 2013b; Klaver et al., 2012).
Porosity estimates obtained with bulk rock measurements yield information on large sample volumes but remain un-resolved in terms of the contribution of different pore mor-phologies. Therefore, most studies use a combination of bulk rock measurements with image analysis (using He pyc-nometry: e.g. Houben et al., 2016; Yang et al., 2016; MIP: e.g. Hemes et al., 2013; Klaver et al., 2012, 2015; MIP, spectrally induced polarization (SIP), nuclear magnetic reso-nance (NMR), micro-computed tomography (µ-CT): Zhang et al., 2018). Most of this research is focused on shales or clay(stones). In this study, we applied these two complimen-tary techniques to slates. In contrast to shales, slates show an enhanced cohesion and higher rock strength and exhibit a more anisotropic microstructure due to increased metamor-phism, deformation and dehydration. Particularly because of the latter, (micro)fractures play an important role as fluid pathways in these slate samples. We aim to find out if such fractures result only from surface processes or form already at depth. In addition, there is a strong contrast in porosity be-tween samples collected from sub-surface drill cores and sur-face outcrops in terms of the effect of unloading due to stress changes during exhumation. Finally, it is necessary to distin-guish original porosity from artificially induced porosity, as the porosity of the delicate slate samples is likely affected by sample collection and preparation.
2 Samples and geological background
Slates were selected from the IFU in the Glarus Alps in east-ern Switzerland (Fig. 1a). The flysch units are deposited in the underfilled Northern Alpine Foreland Basin and accreted in sequence to the accretionary wedge during the subduction of the European margin (Lihou, 1996). The IFU consists of the North Helvetic Flysch (NHF), which is overthrusted by the South Helvetic Flysch and Ultrahelvetic Flysch, the lat-ter including the Sardona and Blattengrat units. The names of the flysch units refer directly to the paleo-graphic realm in which they were deposited (Lihou, 1996). The Ultrahel-vetic Flysch is itself overthrusted by the SubhelUltrahel-vetic units and the Helvetic nappes along the Glarus thrust (Pfiffner, 1986; Schmid, 1975; Trümpy, 1969). The lower greenschist-facies metamorphic conditions in the thrust wedge relate to an overburden of 8–12 km (Frey et al., 1980; Lihou, 1996; Rahn et al., 1995).
G l a r u s t h r u s t
Gl a r us
th
ru st
47°05’N
46°50’
N
Schwanden Schwanden
46°50’
N
Glarus
9°15’ E
46°55’
N
47°00’
N
Molasse basin
Oligocene-Miocene
Eocene-Early Oligocene
South Helvetic slices
Late Cretaceous – Eocene
Ultrahelvetic slices
Late Cretaceous – Eocene
North Helvetic Flysch
Subalpine Flysch
Oligocene sediments
Sediments
Verrucano
Permian Glarus nappe Drusberg nappe
Sediments
Early Cretaceous
Triassic-Jurassic Allochthonous slices
Helvetic nappe system North Alpine foreland
9°05’ E
47°05’
N
9°05’ E 9°15’ E
46°55’
N
47°00’
N
47°05’
N
5 km
N 200 ˚C
230 ˚C
310 ˚C 320±10 ˚C
230±10 ˚C
250 ˚C
A
B C
D-E F
G H
270 ˚C
(a)
(b) Sample C (c) Sample H
S0 S1
Slate
Carbonates S1
30 cm 10 cm
Flims Weesen
Landes-plattenberg
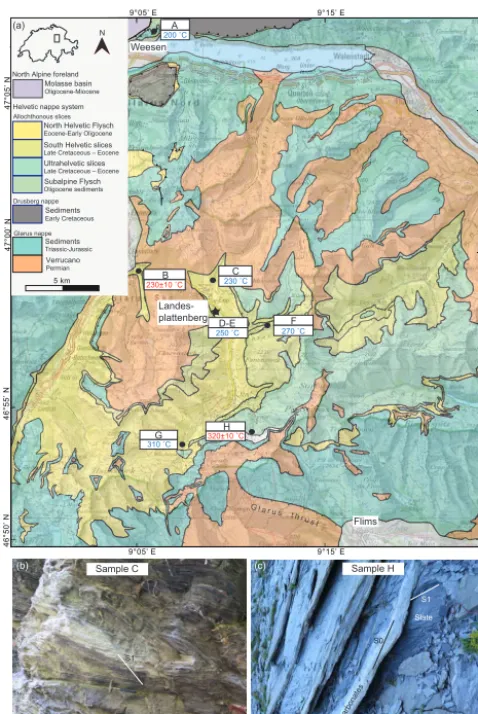
Figure 1.Geological map and outcrops.(a)Geological map with sample locations. Map adapted from Dielforder et al. (2016); temperatures from samples in close vicinity taken from Ebert et al. (2007) (in red) and from Lahfid et al. (2010) (in blue). Star
indi-cates location of sub-surface samples.(b)Outcrop of folded slates
at Engi with secondary foliation (46◦59013.900N, 9◦09017.600E).
(c)Outcrop of slates at Martinsmad (46◦53031.200N, 9◦11015.500E)
intercalated with massive carbonaceous layers. S0: bedding; S1: fo-liation.
The compositions of the slates from the flysch units are heterogeneous, comprising layered mineralogical variations owing to turbiditic sedimentation processes. In this study, we focus on the clay-(mica)-rich layers, excluding sandy layers from our analysis. We collected eight samples from the fly-sch between the village Weesen in the north and the locality Flims in the south (Fig. 1a). All samples are from surface outcrops, except for samples D and E, which are from an abandoned sub-surface slate mine (Landesplattenberg). The N–S sample profile across the Flysch units covers a change in peak metamorphic conditions from 200◦C in the north to 320◦C in the south determined by calcite–dolomite ther-mometry and Raman spectroscopy of carbonaceous material (Ebert et al., 2007; Lahfid et al., 2010). This gradient
cor-relates to a strain gradient, as the most southern units were subducted to the deepest levels prior to in-sequence imbri-cate stacking.
3 Analytical techniques 3.1 Bulk rock porosity 3.1.1 Helium pycnometry
He pycnometry is a gas expansion technique based on Boyle’s law to measure volume (Anovitz and Cole, 2015). He pycnometry was performed on oven-dried (115◦C) plugs with a 2.5 cm diameter and geometrical volumes > 5 cm3 (Fig. 2). Plugs were drilled in the hand specimens (Fig. 3a), and the flat surfaces of the plugs were polished to obtain a perfectly cylindrical shape. The geometrical volume was de-termined by an average of six calliper measurements of the height and four measurements of the diameter of the plug. Pycnometric density measurements were obtained using an AccuPyc 1330 pycnometer. The accuracy of the measure-ments is related to sample quantity and cell size. The accu-racy of the porosity measurements of the machine falls be-tween 0.02 and 0.1 vol% (Viana et al., 2002). Helium was used as a specific gas as its small atom radius was assumed to percolate the sample volume down to the smallest pore sizes. The drilling of plugs resulted in some cases in the splitting of the rock along the foliation planes, resulting in several thin cylindrical disks (Fig. 3b and c). In the cases where the vol-ume of one disk was < 10 % of the sample chamber, several disks of adjacent sample material were analysed simultane-ously. This was done to increase the total sample quantity and reduce the analytical error. When the plug volume exceeded 10 vol% of the sample volume chamber, an average of two adjacent plugs was taken. The amount of purges was set to 10 and the connected porosity was calculated using Eq. (1). connected porosity=1− bulk density
grain density (1)
For He pycnometry, the sample volume has shown to ef-fect the measurements, with larger sample volumes result-ing in lower porosity (Table S1 in the Supplement). Dupli-cate measurements yield absolute differences of about 0.03– 0.07 vol%. The difference between measuring different lay-ers and several cylindlay-ers simultaneously, compared to an av-erage of separate layers, yields a maximum difference of about 0.5 %. Therefore, the error, used as the standard de-viation of the different measurements, was set to 0.5 vol%. 3.1.2 Mercury intrusion porosimetry
• Fracture porosity: open fractures and microfractures. Excludes fractures on mm scale.
• Local porosity: microfractures, interlayer, intraparticle and interparticle pores
• Insight into new grown phases inside pores and amount of isolated pores
• Total connected porosity on 3-D bulk volume
• Dominated by fractures • Includes all sample heterogeneity • Excludes isolated pores
Detected pores Advantages Disadvantages
• Connected pore space • Big 3-D volume
• Measure also induced fractures by sample preparation, drying, unloading.
• Induce pores by mechanical polishing • Only 2-D • Microstructure
• Measure non-connected pores
• Smallest fraction artificially induced pores and cracks • Also non-connected pores
• Small REA • Only 2-D • Induce fractures by sample preparation, drying unloading • Connected
pore space and pore size distribution • 3-D volume
1 nm 1 μm 1 mm
>0.002 mm 0.5 mm 0.1 cm >5 cm
He pycnometry BIB-SEM He pycnometry MIP BIB-SEM
Bulk rock measurements
Image analysis
(a)
(b)
SEM thin section
SEM thin section
2 2 3 3
Resolution detected pores
Sample volume
Image analysis Bulk rock measurements
MIP
fracture
S0 S0
S0
Figure 2.Overview of analytical techniques, S0: bedding, BIB-SEM: broad ion beam scanning electron microscopy, SEM: scanning electron
microscopy, MIP: mercury intrusion porosimetry, and REA: representative element area.(a)Sample volume vs. resolution of detected pores.
(b)Different techniques with advantages and disadvantages.
Sample G1 and G2 Sample C
Sample C G2 b c d 5.2 % 1.4 % 3.8 % 2.8 % 5.2 % 2.2 % 4.1 % G2A G2B G2C G2D G1A G1B G1C G1 a a b c He pycnometry A B C B C E A G2 G1 (a) (b) (c) (d) UV light White light (e) 10 µm 6 mm G2E D 6.3 % S0 S0 S0
1 mm 100 μm
Qz and Cal-rich
Mica-rich
Qz
Mica
Cal
ViP image BSE image
1 cm
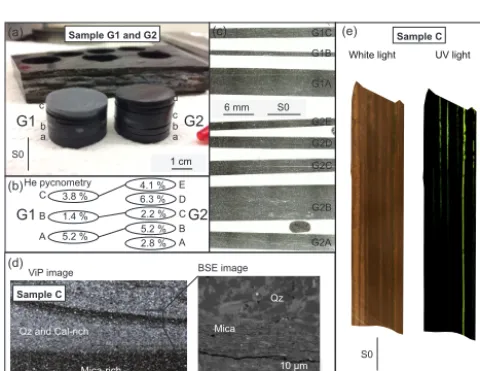
Figure 3.Sample preparation and heterogeneity.(a)Sample plugs (G1 and G2) are drilled bedding-perpendicular and directly next to each other. The plugs fall apart in sub-samples along the bedding
planes.(b)Results of He-pycnometry measurements on individual
sub-samples from A indicate limited horizontal but substantial
ver-tical variations in porosity.(c)Photograph of thin section obtained
from the sub-sample plugs indicated in A show that the bulk
sam-ple is relatively homogeneous.(d)Selecting areas of interest from
ViP images for further SEM investigation.(e)Polished sample C in
white and UV light; note fractures on macroscale. Qz: quartz; Cal: calcite; S0: bedding; and BSE represents backscatter electron.
diamond saw so that the measured pieces had a 4–5 mm edge length. In one measurement, three to five pieces were anal-ysed.
The analyses were performed using Thermoelectron Pas-cal 140/440 equipment. In a first step, mercury was intruded to a maximum pressure of 200 kPa. Then the sample was
moved to the Pascal 440 machine for high-pressure analysis up to 200 MPa. Pore sizes were calculated using Washburn’s equation (Washburn, 1921). For the analyses, a cylindric pore shape with a contact angle of 140◦and a surface tension of mercury of 0.48 N m−1porosimetry was assumed, leading to intruding a minimal pore radius of 3.7 nm.
MIP was performed in a multi-cycle experiment, includ-ing two full injection and extrusion cycles. It is assumed that “ink-bottle type pores” remain filled after the first intrusion and that in a second intrusion the pores are successively filled with mercury (e.g. big pores followed by smaller pores). The first cycle indicates the complete pore volume and the sec-ond cycle only the connected pores, which include the small pore fraction (Fig. 4). Subtraction of the second cycle from the first cycle gives the size of the neck pore entrances at which the ink-bottle type pores become filled (Kaufmann, 2010; Kaufmann et al., 2009). All errors of this technique fall into the 5 vol% range.
3.2 High-resolution imaging techniques
microstruc-First-cycle mercury intrusion
Second-cycle mercury intrusion I
II III
III IV
Hg in
Hg in
I II
I III
Figure 4.Conceptual model of first and second MIP cycle. Num-bers indicate the succession in pore filling, which is related to a stepwise increase in pressure, linked to a certain radius of a pore neck entrance. The second cycle indicates the remaining mercury from the first cycle.
tural domains of interest. For this study, we selected only ar-eas from clay-(mica)-rich intervals and excluded large-scale fractures (Fig. 3d and e).
3.2.1 Ion polishing sample preparation
To examine the differences between mechanical polishing and ion polishing of thin sections in terms of induced arti-ficial porosity, such as fractures, first mechanically polished thin sections were produced and examined. This was fol-lowed by surface low-angle ion polishing performed on the 2-D surfaces of such thin sections (circular areas with a di-ameter of 2.6 cm). Ion polishing was performed with a Le-ica EM TIC 3X argon ion stand-alone polisher (6 kV, 2 mA, 3◦, 8 h) at the Institute of Geological Sciences, University of Bern.
Additionally, slope cut ion polishing was performed on the sample material. Samples were treated by two differ-ent polishing techniques: 2-D surfaces on thin sections and slope cutting on sample material. These samples were cut from clay-(mica)-rich layers with a diamond saw under wet conditions to dimensions of about 5×7×3 mm. Cross sec-tions were made in the 7×3 mm side and were 1–2 mm2in size. Slope cutting was performed with a JEOL SM-09010 BIB argon cross-section polisher (6 kV, 90◦, 8 h) at the GED, RWTH Aachen. The BIB cross sections were coated with tungsten. The slope cutting polishes smaller areas but does so with very high quality, which allows microstructural imaging down to the nanometre scale (e.g. Hemes et al., 2015).
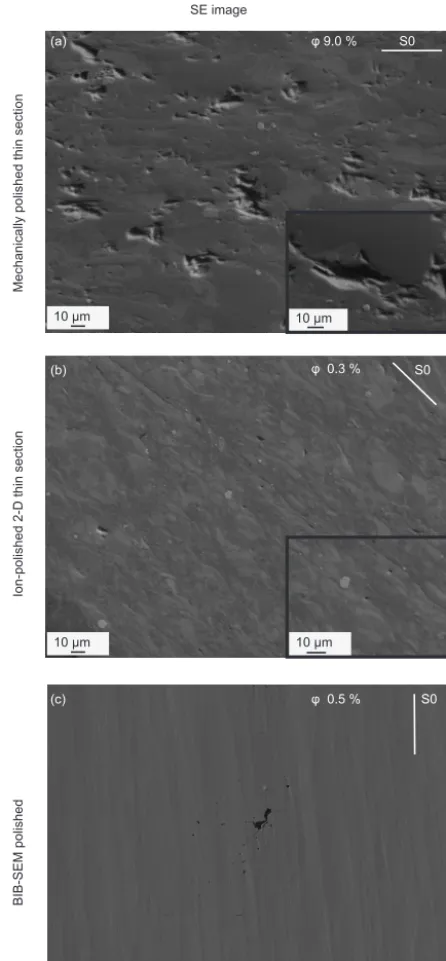
SEM imaging using samples prepared with different tech-niques is shown in Fig. 5. The mechanically polished thin section shows many polishing damage effects such as break-outs of pores. These effects are not seen in either of the ion-polished samples (ion-ion-polished 2-D thin section and slope cutting polishing (BIB-SEM)). The advantage of the
ion-Ion-polished 2-D thin section
Mechanically polished thin section
φ 0.3 % φ 9.0 %
10 μm
10 μm
10 μm
10 μm
(a)
(b)
BIB-SEM polished
φ 0.5 % (c)
SE image
S0
S0
S0
2 μm
Used for matrix porosity
No
t u
se
d
fo
r
m
at
rix
p
or
os
ity
, o
nl
y
us
ed
fo
r
fr
ac
tu
re
s
Figure 5.Differences in apparent porosity owing to applied sample
polishing techniques in different samples.(a)Effect of conventional
mechanical polishing of thin sections results in an overestimation of
porosity owing to severe plugging of grains.(b)Ion-polished 2-D
surface of sample taken at 46◦53017.200N, 9◦07040.100E shows a
significantly smaller pore volume compared to the mechanical
pol-ishing technique.(c)Smoothest surfaces with least induced pores
created with BIB-SEM polishing. S0: bedding.
mechani-0 0.1 0.2 0.3
0 400 800 1200 1600 0
1 2 3
0 0.005 0.01 0.015 0.02 0.025 0.03
Box size (μm )
Porosity area % Sample A Sample C
0.01 0.02 0.03
0 0 1 2 3
Box size *10 (μm )2
(a) (b)
2 6
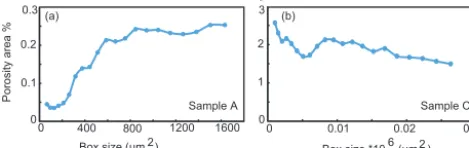
Figure 6.Results of box counting method for BIB-SEM samples
A and C.(a)Representative element area (REA) for sample A is at
least 900 µm2.(b)REA for sample C is at least 25 000 µm2.
cal polishing because there is (1) no smearing of clay, (2) no breakage of mineral grains and (3) no polishing dust, which could fill pores.
3.2.2 Microstructure imaging
A Zeiss EVO 50 SEM with backscatter and secondary elec-tron detectors at the Institute of Geological Sciences, Uni-versity of Bern, was used to obtain images from the mechan-ically polished thin sections. Image mosaics (0.4–0.6 mm2) consisting of 10 to 15 images were acquired using a magni-fication of 400×. Images from BIB-prepared samples (see Sect. 3.2.1) were taken with a Zeiss Supra 55 SEM with backscatter and secondary electron detectors (GED, RWTH Aachen). Both overview image mosaics with a magnification of 125×and 1250×were acquired and in addition high mag-nification images (up to 20 000×) were collected. For testing the representative element area (REA) relative to the pore distribution the box counting method was used (Kameda et al., 2006; Klaver et al., 2012), where a stepwise growing box was applied to the segmented pore images in which the total area% of pores within the box was measured. At a certain box area the total area% of pores does not define a signifi-cant variation anymore. This box area was taken as the REA. We checked this for two different samples using BIB-SEM images (Fig. 6). Sample A shows a minimum REA of about 900 µm2, whereas sample C requires a minimum REA of at least 25 000 µm2. The microstructure reveals the differences between those REAs (Fig. S2). In samples where large het-erogeneities in the microstructure (e.g. the local presence of fossils) exist, the calculated REA is larger than in samples with a relatively more homogeneous microstructure. In the following, image analysis is presented from areas between 1750 and 31 500 µm2.
3.2.3 Image analysis
Images were first cleaned by manually removing artefacts from dust or charging effects. Images were segmented using manual thresholding in ImageJ version 1.51n (Schindelin et al., 2012; Schneider et al., 2012). This software was also used for the pore analysis. The outlines of the analysed particles were projected as overlay on the original images in
Photo-shop CS 5.1 to optimize the thresholding values. Pores were classified by their morphology, based on the ratio of the mi-nor axis to the major axis (b/a). Pores with ratios of < 0.2 were considered as fracture. This criterion comes from the b/a vs. area % plot shown in Fig. S1, which shows that for values b/a < 0.3, the porosity steeply increases as the effect of fractures. Manual pore segmentation yields a human er-ror of about 10 % (Houben and Urai, 2013). Data from two to three mosaics taken on several different places within the same sample were averaged, and the standard deviation was taken as mean error. The highest given standard deviation is then applied to all samples. The standard deviation of the porosity obtained by image analysis from mechanically pol-ished thin sections is 0.5 area%, and it is 0.15 area% for BIB-SEM prepared samples.
4 Results
4.1 Microstructure, petrography and sample heterogeneity
The slates are defined by alternating intervals of silty and clay-(mica)-rich layers (millimetre to centimetre scale) ow-ing to turbiditic sedimentation processes. The clay-(mica)-rich layers include four dominant mineral phases: mica, chlo-rite, quartz and calcite. In minor amounts there are also clay, dolomite, albite, pyrite and rutile. Mica occurs in two dis-tinct phases. (1) There are relatively large mica aggregates up to 20–50 µm in size, often deformed. These aggregates occur both aligned and randomly oriented with respect to the foliation plane (Fig. 7b, d). (2) There are relatively small mica grains (1–5 µm) mostly aligned in the foliation plane (Fig. 7d).
The alignment of the sheet silicates in the foliation plane forms the main planar fabric. The low-temperature endmem-ber (sample A: Tmax=200◦C; Fig. 7a and b) exhibits no
preferred alignment of minerals. This is a low strain end-member as inferred from the occurrence of un-deformed fos-sils in a clay-rich matrix. Sample E (Tmax=250◦C; Fig. 7c
and d) shows the alignment of mica and an increase in mi-crofractures along the grain boundaries of mica. The high-temperature endmember (Sample H:Tmax=320◦C; Fig. 7e
and f) is characterized by a strong and defined spaced cleav-age with pressure solution seams and shows no fossils. This sample also represents the high strain endmember, as indi-cated by the elongation of detrital quartz and calcite crys-tals. An overview of the microstructures of all the samples is given in Fig. S2.
Fossil Mica Qz
200 μm
(a)
Pore Qz
Mica
Cal
(b)
Fossil replaced by qz and ca-cement Qz
Pressure solution seams (e)
Microfracture
Cal
Qz
(f)
S0
Mica
Qz
200 μm
200 μm
10 μm
(c) (d)
Mica
Qz Cal
Py
Py
Py
10 μm 10 μm Pore
Pore
A - low T
H - high T
BSE-SEM on thin section Pol. microscope -XPL
E - intermediate T
Figure 7.Thin section (a, c, e) and backscatter electron images (b, d, f) of slate microstructures collected along the N–S metamorphic
gra-dient.(a, b)Sample A: low-temperature–low-strain endmember – un-deformed recrystallized fossils in a former mud matrix with randomly
oriented sheet silicates.(c, d)Sample E: intermediate-temperature–intermediate-strain – sheet silicates aligned bedding-parallel.(e, f)
Sam-ple H: high-temperature–high-strain endmember – showing deformed slate with recrystallized fossils and quartz in a matrix with pressure solution seams parallel to bedding. Qz: quartz; Py: pyrite; Cal: calcite; S0: bedding.
5.2 vol% (sample plug G1: Fig. 3b). Only small variations < 0.8 vol% are seen parallel to the bedding, meaning that within the sample volume the sub-layers of each plug corre-late corre-laterally very well and are therefore relatively homoge-neous. Despite the bedding-perpendicular porosity variation, image analysis of the same sample material demonstrates a homogeneous lithological composition (Fig. 3c). The poros-ity variation across these layers is primarily due to the local occurrence of fractures.
4.2 Pore morphology
Porosity consists of two main groups classified by their pore morphology. (1) There is macro-fracture porosity, which in-cludes macro-fractures with apertures up to several millime-tres and a length of a few millimemillime-tres to centimemillime-tres. Such
large-scale fractures are immediately visible in thin sections and greatly influence bulk rock measurements. (2) The ma-trix porosity consists of mama-trix pores, including inter- and intra-particle pores and microfractures (apertures between 1– 5 µm). Matrix porosity is measured by image analysis on ar-eas selected in between macro-fractures.
Image analysis on mechanically polished thin sections has shown that porosity estimates from these thin sections are unreliable. The only reliable information that these analyses yield is an insight into the contribution of microfractures. In contrast, BIB-prepared samples give a good insight into the complete matrix porosity.
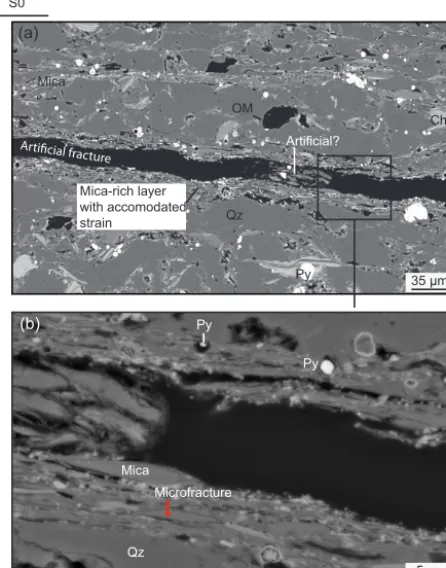
4.2.1 Macro-fracture porosity
Mica-rich layer with accomodated strain
OM
Chl
Qz
Py 35 μm
5 μm
(a)
(b)
Py
Mica
Mica
Qz
S0
Microfracture Py
Artificial?
Figure 8.Fracture porosity.(a)Coarse-grained quartz-rich layers intercalated with fine-grained sheet-silicate-rich layers in sample F.
(b) Strain accommodated in fine-grained sheet-silicate-rich layers
by alignment of sheet silicates and the formation of microfractures. OM: organic material; Qz: quartz; Py: pyrite; Chl: chlorite; S0: bed-ding.
– (1) Open fractures: in most cases these fractures are bedding-parallel and occur on the foliation planes as seen in the preparation plugs and by UV light detec-tion of the fracture network of a sub-sample (Fig. 3e). In thin sections such fractures are recognized by the rel-atively large size in both aperture (> 10 µm) and length, as these run through the complete section. Sometimes material is smeared into the fractures during mechan-ical polishing (Fig. 8). They show no precipitation of secondary minerals after fracturing.
– (2) Open veins: these contain mineral precipitates, but retain a high porosity.
– (3) Completely mineralized veins.
4.2.2 Matrix porosity
Image analysis on BIB-prepared samples allow us to divide the matrix porosity into two types of pores. (1) Microfrac-tures are defined by an aspect ratio of b/a < 0.2, have aper-tures of about 1–5 µm and are not continuous (length up to
30 µm). In Fig. 8, a special type of fracture porosity is seen in fine-grained mica-rich layers, which accommodate brittle strain. Inside the fractures pyrite precipitated, demonstrating a geological origin of these fractures. In such samples, the fracture porosity is the largest contribution to the total poros-ity. These fractures are often located along the grain bound-aries of micas and in some cases along quartz (Figs. 8, 9d and 10a). (2) The second pore type comprises non-fracture-related pores; mostly these are interlayer pores associated with mica and clay minerals or due to dissolution along grain boundaries of quartz (Fig. 9c and d). Intra-particle pores oc-cur in minor quantities in calcite, dolomite (Figs. 9c, d and 10b) or quartz (Fig. 10e and f). Such pores are often related to quartz and calcite cement, which occurs in some cases as new infill of fossils (Fig. 10c) or fluid inclusions.
4.3 Quantification of porosity
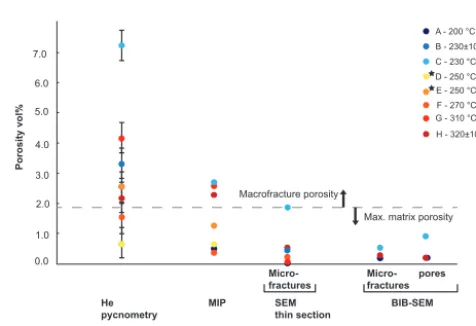
All porosity estimates obtained by the different techniques applied in this study are given in Table 1 and Fig. 11. Note that the techniques each have their own characteristic resolu-tion (Fig. 2a). Moreover, He pycnometry and MIP both ob-tain a connected porosity. Image analysis yields microfrac-tures and inter- and intra-particle pores. Microfracmicrofrac-tures and inter-particle pores have the greatest contribution to the total porosity in our sample set as seen by microstructural imaging (Figs. 8 and 9).
The porosity of the bulk rock of the slates, obtained by He pycnometry, shows that the samples have a connected poros-ity in the range between 0.7 and 7.2 vol% (Fig. 11). More-over, He-pycnometry results show a bulk density of 2.55– 2.73 g cm−3and grain density of 2.73–2.78 g cm−3.
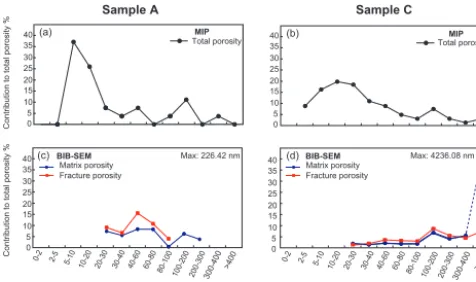
The MIP results show variations in porosity from 0.4 to 2.7 vol%, which does not directly correlate with the He-pycnometry data in all samples. Pore volumes with a pore throat radius and fracture aperture between 5 and 20 nm con-tribute most to the total porosity (Fig. 12a and b). In addi-tion, a slightly increased frequency of pores with radius and fracture aperture between 100 and 200 nm is seen. In Fig. 13 the neck pore entrances are plotted vs. the cumulative pore volume. Samples C, G and H have the highest bulk poros-ity (Fig. 13). The second cycle contains much less remaining mercury in the pores, as the intrusion and extrusion curve approach each other (Fig. S3). The correction which is ap-plied comes from the assumption that for extrusion another contact angle applies (110◦; Kaufmann, 2010). Hence, the correction is only for extrusion data. The hysteresis between the second intrusion and extrusion almost disappears by ap-plying the above explained pore size correction. This is more evident for sample C than for sample H, which indicates a slight increase in hysteresis.
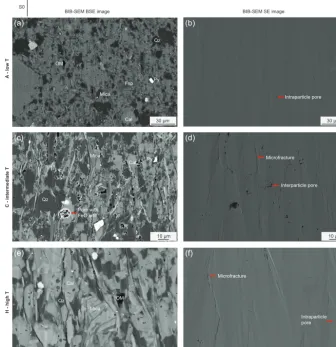
BIB-SEM BSE image
A - low T
C - intermediate T
H - high T
BIB-SEM SE image S0
30 μm
10 μm
15 μm Mica
Qz
Cal
OM
Fsp Py
Pore with FeO infill
Py
Qz
Mica
Cal
Mica Qz
Cal
Py
30 μm
10 μm
15 μm OM
(a) (b)
(c) (d)
(e) (f)
Microfracture
Interparticle pore Intraparticle pore
Microfracture
Intraparticle pore
Figure 9.Microstructure and microstructural porosity imaged with BIB-SEM along the temperature gradient.(a, b)Low-temperature sample
A shows the smallest porosity, mainly present as intra-particle pores in quartz and dolomite.(c, d)Intermediate temperature sample C shows
microcracks along sheet silicates and inter-particle pores as an effect of dissolution.(e, f)High-temperature sample H with a defined spaced
cleavage shows more microcracks than the intermediate sample C. OM: organic matter; Qz: quartz; Py: pyrite; Fsp: feldspar; Cal: calcite; S0: bedding.
Table 1.Samples, coordinates and porosity estimates from each of the different measurement techniques.
Bulk rock porosity Image analysis
He pycnometry MIP SEM thin section BIB-SEM
Sample Latitude Longitude Fracture Total Fracture Matrix
porosity porosity porosity porosity
(vol%) (vol%) (area%) (area%) (area%) (area%)
A 47◦08026.300N, 9◦06026.100E – 0.51 0.04 0.26 0.13 0.13
B 46◦59047.200N, 9◦05020.900E 3.3 0.46 – – –
C 46◦59013.900N, 9◦09017.600E 7.2 2.67 1.84 1.39 0.49 0.90
D 46◦58012.000N, 9◦09019.700E 0.7 0.66 – – – –
E 46◦58012.000N, 9◦09019.700E 2.6 1.27 – – – –
F 46◦57034.300N, 9◦11023.600E 1.6 0.39 0.21 – – –
G 46◦53017.200N, 9◦07040.100E 4.2 2.58 0.05 – – –
Dol
Mica
Pore
Microfracture
Cement
OM Pore Pore
Fossil
4.5µm
(a) (b) (c)
(d) (e) (f)
2.4 μm 4.1 μm 4.1 μm
2.4 μm 4.5 μm 4.5 μm
Mica
Qz Qz
Qz Cal
Qz Cal
Mica
Qz Cal
Cal
Figure 10.Images of BIB-SEM prepared sub-samples to show different pore morphologies.(a)Microfractures occur along grain boundaries
of mica aggregates.(b)Dissolution pores around and in dolomite (dol) grain.(c)Porosity reduction by cement infill of fossils.(d)Solid-state
organic matter (OM), not to be confused with pore space.(e)Intra-particle pores in quartz probably reflecting fluid inclusions.(f)Scanning
electron (SE) image of quartz grain with pores in sample G. Qz: quartz; Cal: calcite.
0.0 1.0 2.0 3.0 4.0 5.0 6.0 7.0
Porosity vol%
He pycnometry
SEM thin section
BIB-SEM MIP
Micro-fractures Micro-fractures pores
>5 cm 0.1 cm 0.5 mm >0.002 mm
Sample volume 3 3 2 2
A - 200 °C B - 230±10 °C C - 230 °C D - 250 °C E - 250 °C F - 270 °C G - 310 °C H - 320±10 °C
Max. matrix porosity Macrofracture porosity
Figure 11.Porosity measurements obtained by five different meth-ods with indicated sample volumes. Stars show sub-surface sam-ples. Errors of MIP data and image analysis fall within the data markers itself. Dashed line is threshold between macro-fracture porosity (above) and matrix porosity (below).
above presented bulk approaches. Pore radii and fracture aperture distributions from image analysis (BIB-SEM) show a similar trend as the MIP data (Fig. 12) for pore sizes > 30 nm. Where there is a peak in the 100–200 nm pore ra-dius in the BIB-SEM data, there is also an elevation in the MIP data, although not with the same magnitude. In addition, the MIP data indicate a major pore radius of 10 nm, which cannot be measured by image analysis because of resolution limits of the SEM.
Figure 11 shows an exponential decrease with asymptotic behaviour for decreasing sample input from bulk rock mea-surements to image analysis. There exists no direct trend along the temperature and indirect strain gradient from sam-ple A to H for any of the measurement techniques (see vary-ing colour-coded symbols in Fig. 11 for the different ap-proaches). Nonetheless, knowing the microstructure enables us to interpret the outcome of the porosity results. Sample C, with a relatively high amount of large mica grains, yields the highest porosity values (for all techniques). The highest-grade samples G and H, also show relative high porosity for MIP, due to bedding-parallel microfractures, whereas sample A, which is the weakly deformed homogeneous clay sample, plots at the lower end of the diagram, indicating lower poros-ity (for MIP and BIB-SEM). The sub-surface samples (sam-ples D and E), which are from the close vicinity of sample C, in general show a lower porosity in He pycnometry and MIP than for the mechanically polished thin section of sample C.
5 Discussion
0 5 10 15 20 25 30 35 40 0 5 10 15 20 25 30 35 40 0 5 10 15 20 25 30 35 40 0 5 10 15 20 25 30 35 40 30 0-400 20 0-300 10 0-200 80-1 00 60-8 0 40-6 0 30-4 0 20-3 0 10-2 0 5-10 0-2 2-5
Sample A
MIP
BIB-SEM
Sample C
Contribution to total porosity %
Contribution to total porosity %
Pore radii and fracture aperture (nm)
BIB-SEM >400 30 0-400 20 0-300 10 0-200 80-1 00 60-8 0 40-6 0 30-4 0 20-3 0 10-2 0 5-10 0-2 2-5
>400
MIP
Pore radii and fracture aperture (nm) Matrix porosity
Fracture porosity
Matrix porosity Fracture porosity
Total porosity Total porosity
(a) (b)
(c) Max: 226.42 nm (d) Max: 4236.08 nm
Figure 12.Pore radii and fracture aperture distributions from MIP compared to image analysis of BIB-SEM images. The pore radius is calculated from the pore area and for the fracture aperture, the minor
axis of the calculated fit ellipse is used.(a, b)Pore size distributions
of MIP results of samples A and C.(c, d)Pore size distributions of
BIB-SEM analysed sub-samples divided into matrix and fracture porosity. MIP and BIB-SEM distributions show same general trend with a peak at the 100–200 nm pore radii. Dashed line: large pore sizes (> 300 nm) disturb distributions because of heterogeneity ef-fect.
5.1 Contribution to porosity estimates
Artificially induced porosity is often due to sample collec-tion and preparacollec-tion. During sample colleccollec-tion, artefacts like fracturing could arise from hammering, transport or storage (drying). Sample preparation, like cutting, and mechanical polishing of thin sections could induce significant additional artificial porosity, such as breakouts, resulting in apparent porosity values without geological meaning (Fig. 5). There-fore, for image analysis procedures on slate samples, sample preparation like ion polishing techniques, either on 2-D thin sections or on cross sections of sub-samples, are necessary (e.g. Hemes et al., 2013; Houben et al., 2013; Keller et al., 2013a; Klaver et al., 2012, 2015).
The bulk rock measurements are strongly influenced by the presence of natural and possible artificial fractures and sample heterogeneity. This results in non-correlating He-pycnometry and MIP data. Differences in porosity estimates from bulk rock measurements and image analysis techniques are related to the different principles underlying the tech-niques, which are the sample volumes (Ougier-Simonin et al., 2016) and the limits in spatial resolution (e.g. Hemes et al., 2013). In addition, Kaufhold et al. (2016) acknowl-edge the resolution issue by a comparison of MIP with FIB-SEM data from shales and show that only 20 vol% of the total porosity can be resolved with FIB-SEM; the remain-ing porosity content should be measured with a bulk rock measurement technique such as He pycnometry. Addition-ally, large microfractures are not incorporated into the repre-sentative domain of the BIB-SEM but do play an important role in the MIP data (Hemes et al., 2013). This correlates
with our observations: larger cracks are measured in the bulk rock methods, whereas the BIB-SEM data only provide ma-trix porosity as we avoid imaging the large fractures. Hence, using a combination of such methods, the REA of the im-age analysis does not necessarily need to cover the full range of pore sizes. However, the BIB-SEM investigation links the bulk He pycnometry and MIP to each other. MIP and He pycnometry both measure connected porosity. MIP includes pores with a > 3.7 nm eq pore throat radius and He pycnome-try > 1 nm eq pore throat radius. Both methods do not provide information on the pore type while the BIB-SEM does.
Porosity types from different scales seem to be related to each other (Fig. 11). A sample with many small-scaled mi-crofractures has also the highest amount of macro-fractures, as seen by their relatively high contribution to the bulk rock porosity. There is a correlation of pore radii and fracture aper-tures between the BIB-SEM and MIP datasets in the overlap-ping measured scale (Fig. 12), even though BIB-SEM yields sections of pore bodies in 2-D images and MIP pore volume (3-D). For the overlapping size range of these two methods, these methods are comparable to each other (see also Houben et al., 2013), indicating that 2-D data are sufficient to estimate average values. Each measurement technique has its charac-teristic pore size range it can analyse, which means that com-bining different methods results in overlapping scales, allow-ing us to resolve the porosity from nanometre to centimetre scale.
Our analysis shows that sample inhomogeneity between the internal slate layers can be large, comprising primary sed-imentological variations, such as clay-(mica)-rich layers al-ternating with silt-rich layers. For bulk rock measurements the representative element volume (REV) is dependent on the clay content and grain size distribution of sand grains for the different sediment layers (e.g. carbonates and quartz): the higher the clay content relative to the non-clay content, the smaller the REV (Keller, 2015).
ma-0 1 2 3 4 5 6 7 8
1 10 100 1000 10 000
A C D E F G H
Pore radius neck entrances (nm)
Pore volume cumulative (mm3 g )
-1
Figure 13.Results from multicycle MIP experiments. Pore radius of the neck entrances vs. cumulative pore volume.
trix is much tighter in these slates, which experienced higher PT conditions and in contrast to the Boom clay and Opalinus clay, show pressure solutions seams, elongated grains, and a much smaller number of fossils due to recrystallization and diagenesis. In these higher-grade samples, the clay minerals are replaced by micas; and due to their strong anisotropy, (micro)fractures, as also illustrated by the BIB-SEM images of sample H, are the main contributor to pore connectivity. As a result, the porosity and pore morphology from slates in this study are not directly comparable to the pore types re-ported for diagenetic clays (e.g. Boom clay; Opalinus clay) but show an advanced stage of porosity reduction owing to an increased metamorphic overprint.
5.2 Processes influencing porosity
To understand what part of the total connected porosity is fracture porosity and what part is matrix porosity, image analysis can be used to establish a threshold. Figure 11 shows that image analysis gives an estimate of the matrix poros-ity. Subtracting the BIB-SEM matrix porosity from the MIP bulk rock measurements yields the macro-fracture porosity. Subtracting the MIP porosity from the He pycnometry gives insight into the smallest matrix pores.
Applying theoretical considerations, Dielforder et al. (2016) estimated that porosity decreases from 60 % to 10 % for convergent plate boundaries within the up-per 5 km of the accretionary wedge along the prograde metamorphic gradient (see references in Dielforder et al., 2016). Along this prograde evolution, the tectonic processes change from soft sediment deformation (such as particulate flow) to pressure solution (Dielforder et al., 2015, 2016). The porosity evolution found in this study is shown in Fig. 14 and indicates different vein generations on both the prograde and retrograde evolution. Veins are indicative of brittle failure and can therefore be used as indicators
of ancient fracture porosity at the stage prior to fracture sealing by precipitation of the vein minerals. The earliest formed fracture porosity is shown by deformed shear veins overprinted by the main foliation (stage I). From initial sedimentation to maximum burial the rock texture changes from an un-deformed matrix with randomly oriented sheet silicates to a slate with a well-developed spaced cleavage and strong structural anisotropy (Fig. 7). The porosity decreases from 60 vol% (Dielforder et al., 2016) to values < 0.9 vol% at maximum burial (peak metamorphism). This is reflected by the matrix porosity obtained by image analysis on BIB-SEM prepared sub-samples from the underground mine of Landesplattenberg. At these highest temperatures reached, dynamic recrystallization of bedding-parallel veins takes place (Fig. 14: stage II). On the prograde path, the sed-iments are strongly influenced by compaction together with dehydration and diagenesis as shown by diagenetic quartz and/or calcite cement precipitation. Diagenetic cementation processes play an important role as a porosity-reducing mechanism in these slates accompanying dissolution by pressure solution (e.g. Katsube and Williamson, 1994). While pressure solution generally reduces porosity, pores are formed by dissolution in and around dolomite (Fig. 10b). This newly created porosity, however, is far less than the amount of porosity destroyed by pressure solution.
Along the temperature and correlated strain gradient from Weesen (200◦C) to Flims (320◦C), there seems to be no relation between porosity and temperature/strain either in the bulk rock measurements or in the images analysis re-sults. However, local variations in mineralogy and strain in-fluence the porosity: a high sheet-silicate content leads to a strong anisotropic fabric, resulting in an increase in mi-crofractures and therefore in a higher porosity (sample C). An only weakly deformed sample, with a less defined fab-ric, exhibits a low porosity (sample A). This suggests that porosity and pore morphology are closely related to the min-eralogical composition and spatial heterogeneity of the phase distributions and strain (e.g. Janssen et al., 2011; Keller et al., 2013a). Together with aforementioned temporal porosity changes by fracturing and vein mineral precipitation, the pro-grade local porosity evolution can therefore be fairly variable and dynamic in time but results in a general decrease in the average porosity with increasing burial.
1 10 100
50 25
Max. burial
45 20 15 10 5 1
Time (Ma)
Porosity (vol%)
Burial & diagenesis
Unloading
30
sub-surface samples 80 °C
320 °C
0.1 Particulate flow
Matrix porosity from BIB-SEM
Fracture porosity
surface samples Fracture porosity
Surface processes
20 10 0
Time (Ka) Time (Ma)
Pressu
re so lution
Artificial
II dynamic recrystallisation
I deformed vein III half open vein IV late stage veining
I
II III
IV
V
V open fractures
250 μm 100 μm 250 μm 0.5 mm 10 μm
Figure 14.Conceptual porosity evolution over time linked to different vein generations and fractures. Porosity at max. burial is from BIB-SEM, porosity on retrograde path is based on He-pycnometry and MIP data. Boundaries between different domains are estimates. Tectonic processes on prograde path from Dielforder et al. (2015).
Dielforder et al. (2016) link the pressure solution pro-cesses and the illite–muscovite transformation to an embrit-tlement during the prograde path. Such embritembrit-tlement al-lows the formation of microfractures (e.g. Zeng et al., 2013). Along the retrograde path, this effect is enhanced because temperatures decrease again, allowing the further increase in size and amount of fractures. With progressive exhumation, the microfractures grow and eventually interconnect, trans-ferring microfractures to fractures (Fig. 14).
In the light of near-surface porosity formation, plotting fracture porosity from bulk rock measurements of surface-collected samples and comparing them with the underground sample reveals the contribution to porosity formation by sur-face processes. In the sursur-face-collected samples, which are exposed to strongly varying climatic conditions, such frac-tures could be due to freeze and thaw cycles (Cárdenes et al., 2012) but also to unloading during deglaciation re-sulting in exfoliation jointing (Jahns, 1943; Ziegler et al., 2016). Particularly in the case of the mechanically highly anisotropic slates, the preexisting foliations are prone to the reactivation of these structural planes by fracturing during the youngest climate- and weathering-related processes. Ad-ditionally, macro-fractures can in many cases also be arti-ficially induced, requiring discrimination between artificial and young geological fracturing processes. Principally, we can list two discrimination criteria. Near-surface fractures experience infiltration of meteoric water resulting in oxida-tion of Fe-bearing mineral phases such as iron sulfides (e.g. pyrite). Consequently thin layers of iron hydroxides form,
appearing as faint reddish staining along the fracture planes. This staining provides clear evidence of an in situ crack for-mation in the rock within its natural environment. In con-trast, preparation-induced fractures will not show such stain-ing phenomena. Moreover, these fractures mostly contain small amounts of polishing material, which is smeared into the newly created fracture during this mechanical treatment (Fig. 8). This accumulation is not possible in the case of resin, used during thin-section preparation, has already filled in the natural fractures. Despite these two unequivocal cri-teria, it might be difficult to discriminate between the two late fracture types in cases where none of the two types of evidence is present.
6 Conclusions
fracture porosity and matrix porosity below BIB-SEM reso-lution. Most of the microfractures are bedding-parallel or oc-cur along the grain boundaries of mica and are ascribed to the effect of unloading on the retrograde path. Macro-fractures (fracture apertures up to 1 mm) are in many cases related to surface processes such as freeze and thaw cycles or are ar-tificially induced by sample preparation. Different vein gen-erations show that the formation of porosity is not restricted to unloading or surface processes but fracturing took place along the entire PTt-deformation path. From a temporal point of view, all porosity, excluding porosity formed by surface or artificial processes must be fairly cyclic, given the stages of pore opening owing to fracturing and subsequent sealing by mineral precipitation. Moreover, porosity and pore mor-phology are strongly dependent on mineralogy, homogeneity and strain. The multiscale approach that was developed on shales, which links microporosity to macroporosity by com-bining bulk rock measurements with image analysis, is, in this study, successfully applied to slates.
Data availability. All data underlying this manuscript are available in the Supplement.
The Supplement related to this article is available online at https://doi.org/10.5194/se-9-1141-2018-supplement.
Author contributions. MH and AB designed the project. Together with IVA, MH and AB collected the samples and IVA carried out the He pycnometry measurements, ion 2-D polishing and SEM work on thin sections. JK carried out the MIP measurements. JLU, JK and GD provided and carried out, together with IVA, the BIB-SEM work. IVA analysed all data and prepared the manuscript with con-tributions from all co-authors.
Competing interests. The authors declare that they have no conflict of interest.
Acknowledgements. For this project, funding has been received from the Swiss National Science Foundation (SNSF; grant number 162340). The ion polisher situated at the Institute of Geological Sciences, University of Bern, is funded by SNSF, grant number 170738. We thank Simon Virgo from RWTH Aachen University for creating the ViP dataset and Thomas Aebi and Stephan Brechbühl from the University of Bern for their help with sample preparation.
Edited by: Florian Fusseis
Reviewed by: Audrey Ougier-Simonin and one anonymous referee
References
Anovitz, L. M. and Cole, D. R.: Characterization and analysis of porosity and pore structures, Rev. Mineral Geochem., 80, 61– 164, 2015.
Badertscher, N. P., Beaudoin, G., Therrien, R., and Burkhard, M.: Glarus overthrust: A major pathway for the escape of fluids out of the Alpine orogen, Geology, 30, 875–878, 2002.
Bisig, W. K.: Blattengratflysch und Sardonaflysch im Sernftal nördlich der Linie Richetlipass–Elm–Ramintal–Grosse Scheibe, PhD Thesis Nr. 2435, ETH Zürich, Switzerland, 239 pp., 1957. Blümling, P., Bernier, F., Lebon, P., & Martin, C. D.: The
excava-tion damaged zone in clay formaexcava-tions time-dependent behaviour and influence on performance assessment, Phys. Chem. Earth, 32, 588–599, 2007.
Boisson, J. Y.: Clay Club Catalogue of Characteristics of Argilla-ceous Rocks, OECD/NEA/RWMC/IGSC (Working Group on measurement and Physical understanding of Groundwater flow through argillaceous media) august 2005 Report NEA no. 4436 (Brochure and CD-Rom including data base), OECD/NEA, Paris, France, p. 72, 2005.
Burkhard, M., Kerrich, R., Maas, R., and Fyfe, W.: Stable and Sr-isotope evidence for fluid advection during thrusting of the Glarus nappe (Swiss Alps), Contrib. Mineral. Petr., 112, 293– 311, 1992.
Busch, A., Schweinar, K., Kampman, N., Coorn, A., Pipich, V., Feoktystov, A., Leu, L., Amann Hildenbrand, A., and Bertier, P.: Determining the porosity of mudrocks us-ing methodological pluralism, Geol. Soc. SP., 454, SP454, https://doi.org/10.1144/SP454.1, 2017.
Cárdenes, V., Monterroso, C., Rubio, A., Mateos, F., and Calleja, L.: Effect of freeze–thaw cycles on the bending strength of roofing slate tiles, Eng. Geol., 129, 91–97, 2012.
Dielforder, A., Vollstaedt, H., Vennemann, T., Berger, A., and Her-wegh, M.: Linking megathrust earthquakes to brittle deforma-tion in a fossil accredeforma-tionary complex, Nat. Commun., 6, 7504, https://doi.org/10.1038/ncomms8504, 2015.
Dielforder, A., Berger, A., and Herwegh, M.: The accretion of fore-land basin sediments during early stages of continental collision in the European Alps and similarities to accretionary wedge tec-tonics, Tectec-tonics, 10, 2216–2238, 2016.
Ebert, A., Herwegh, M., and Pfiffner, A.: Cooling induced strain lo-calization in carbonate mylonites within a large-scale shear zone (Glarus thrust, Switzerland), J. Struct. Geol., 29, 1164–1184, 2007.
Frey, M., Teichmüller, M., Teichmüller, R., Mullis, J., Künzi, B., Breitschmid, A., Gruner, U., and Schwizer, B.: Very low-grade metamorphism in external parts of the Central Alps: illite crys-tallinity, coal rank and fluid inclusion data, Eclogae Geol. Helv., 73, 173–203, 1980.
Fusseis, F., Regenauer-Lieb, K., Liu, J., Hough, R., and De Carlo, F.: Creep cavitation can establish a dynamic granular fluid pump in ductile shear zones, Nature, 459, 974–977, 2009.
Gilgannon, J., Fusseis, F., Menegon, L., Regenauer-Lieb, K., and Buckman, J.: Hierarchical creep cavity formation in an ultramy-lonite and implications for phase mixing, Solid Earth, 8, 1193– 1209, https://doi.org/10.5194/se-8-1193-2017, 2017.
Mercury injection Porosimetry, Neth. J. Geosci., 92, 275–300, 2013.
Hemes, S., Desbois, G., Urai, J. L., Schröppel, B., and Schwarz, J.-O.: Multi-scale characterization of porosity in Boom Clay
(HADES-level, Mol, Belgium) using a combination of X-rayµ
-CT, 2D BIB-SEM and FIB-SEM tomography, Micropor. Meso-por. Mat., 208, 1–20, 2015.
Herwegh, M. and Jenni, A.: Granular flow in polymineralic rocks bearing sheet silicates: new evidence from natural examples, Tectonophysics, 332, 309–320, 2001.
Herwegh, M., Hürzeler, J. P., Pfiffner, O. A., Schmid, S. M., Abart, R., and Ebert, A.: The Glarus thrust: excursion guide and report of a field trip of the swiss tectonic studies Group, Swiss Geolog-ical society, 14.–16. 09. 2006, Swiss J. Geosci., 101, 323–340, 2008.
Holland, M., Urai, J. L., van der Zee, W., Stanjek, H., and Kon-stanty, J.: Fault gouge evolution in highly overconsolidated clay-stones, J. Struct. Geol., 28, 323–332, 2006.
Horseman, S., Higgo, J., Alexander, J., and Harrington, J.: Water, gas and solute movement through argillaceous media, Nuclear Energy Agency Rep. CC-96/1. OECD, Paris, 1996.
Houben, M. E. and Urai, J.: In situ characterization of the mi-crostructure and porosity of Opalinus Clay (Mont Terri Rock Laboratory, Switzerland), PhD thesis, Von der Fakultät für Geo-ressourcen und Materialtechnik Der Rheinisch-Westfälischen Technischen Hochschule Aachen, 2013.
Houben, M., Desbois, G., and Urai, J.: Pore morphology and distri-bution in the Shaly facies of Opalinus Clay (Mont Terri, Switzer-land): Insights from representative 2D BIB–SEM investigations on mm to nm scale, Appl. Clay Sci., 71, 82–97, 2013.
Houben, M., Barnhoorn, A., Lie-A-Fat, J., Ravestein, T., Peach, C., and Drury, M.: Microstructural characteristics of the Whitby Mudstone formation (UK), Mar. Petrol. Geol., 70, 185–200, 2016.
Jahns, R. H.: Sheet structure in granites: its origin and use as a mea-sure of glacial erosion in New England, J. Geol., 51, 71–98, 1943. Janssen, C., Wirth, R., Reinicke, A., Rybacki, E., Naumann, R., Wenk, H.-R., and Dresen, G.: Nanoscale porosity in SAFOD core samples (San Andreas Fault), Earth Planet. Sc. Lett., 301, 179– 189, 2011.
Kameda, A., Dvorkin, J., Keehm, Y., Nur, A., Bosl, W.: Permeability–porosity trans-forms from small sandstone frag-ments, Geophysics, 71, N11–N19, 2006.
Katsube, T. and Williamson, M.: Effects of diagenesis on shale nano-pore structure and implications for sealing capacity, Clay Miner., 29, 451–472, 1994.
Kaufhold, S., Grathoff, G., Halisch, M., Plötze, M., Kus, J., Ufer, K., Dohrmann, R., Ladage, S., and Ostertag-Henning, C.: Com-parison of methods for the determination of the pore system of a potential German gas shale, in: Filling the Gaps: from Micro-scopic Pore Structures to Transport Properties in Shales, Clay Miner., 21, 163-190, 2016.
Kaufmann, J.: Pore space analysis of cement-based materials by combined Nitrogen sorption–Wood’s metal impregnation and multi-cycle mercury intrusion, Cement Concrete Comp., 32, 514–522, 2010.
Kaufmann, J., Loser, R., and Leemann, A.: Analysis of cement-bonded materials by multi-cycle mercury intrusion and nitrogen sorption, J. Colloid Interf. Sci., 336, 730–737, 2009.
Keller, L. M.: On the representative elementary volumes of clay rocks at the mesoscale, Journal of Geology and Mining Research, 7, 58–64, 2015.
Keller, L. M., Holzer, L., Schuetz, P., and Gasser, P.: Pore space relevant for gas permeability in Opalinus clay: Statistical analysis of homogeneity, percolation, and representative volume element, J. Geophys. Res-Sol. Ea., 118, 2799–2812, 2013a.
Keller, L. M., Schuetz, P., Erni, R., Rossell, M. D., Lucas, F., Gasser, P., and Holzer, L.: Characterization of multi-scale microstruc-tural features in Opalinus Clay, Micropor. Mesopor. Mat., 170, 83–94, 2013b.
Klaver, J., Desbois, G., Urai, J. L., and Littke, R.: BIB-SEM study of the pore space morphology in early mature Posidonia Shale from the Hils area, Germany, Int. J. Coal Geol., 103, 12–25, 2012. Klaver, J., Hemes, S., Houben, M., Desbois, G., Radi, Z., and Urai,
J.: The connectivity of pore space in mudstones: insights from high-pressure Wood’s metal injection, BIB-SEM imaging, and mercury intrusion porosimetry, Geofluids, 15, 577–591, 2015. Labaume, P., Maltman, A., Bolton, A., Tessier, D., Ogawa, Y., and
Takizawa, S.: Scaly fabrics in sheared clays from the décollement zone of the Barbados accretionary prism, Proceedings-Ocean Drilling Program Scientific Results, 156, 59-78, 1997.
Lahfid, A., Beyssac, O., Deville, E., Negro, F., Chopin, C., and Goffé, B.: Evolution of the Raman spectrum of carbona-ceous material in low-grade metasediments of the Glarus Alps (Switzerland), Terra Nova, 22, 354–360, 2010.
Laurich, B., Urai, J. L., Desbois, G., Vollmer, C., and Nussbaum, C.: Microstructural evolution of an incipient fault zone in Opalinus Clay: Insights from an optical and electron microscopic study of ion-beam polished samples from the Main Fault in the Mt-Terri Underground Research Laboratory, J. Struct. Geol., 67, 107–128, 2014.
Leupold, W.: Neue Beobachtungen zur Gliederung der Flyschbil-dungen der Alpen zwischen Reuss und Rhein, Eclogae Geol. Helv., 35, 247–291, 1942.
Loon, V. L.: Preferred orientations and anisotropy in shales: Callovo-Oxfordian shale (France) and Opalinus Clay (Switzer-land), Clay Miner., 56, 285–306, 2008.
Lihou, J.: A new look at the Blattengrat unit of eastern Switzerland: Early Tertiary foreland basin sediments from the South Helvetic realm, Eclogae Geol. Helv., 88, 91–114, 1995.
Lihou, J.: Structure and deformational history of the Infrahelvetic flysch units, Glarus Alps, eastern Switzerland, Eclogae Geol. Helv., 89, 439–460, https://doi.org/10.5169/seals-167909, 1996. Milliken, K. and Reed, R.: Multiple causes of diagenetic fabric anisotropy in weakly consolidated mud, Nankai accretionary prism, IODP Expedition, 316, 1887–1898, 2010.
Ougier-Simonin, A., Renard, F., Boehm, C., and Vidal-Gilbert, S.: Microfracturing and microporosity in shales, Earth-Sci. Rev., 162, 198–226, 2016.
Pfiffner, A. O.: Evolution of the north Alpine foreland basin in the Central Alps. In: Foreland Basins, Int. Assoc. Sediment. Spec. Publ., 9, 219–228, 1986.
Pfiffner, O. A., Ramsay, J., and Schmid, S.: Structural map of the Helvetic Zone of the Swiss Alps: Geological special map, 1, 100000, 2011.
the ductile carbonates of the Glarus thrust, Geophys. Res. Lett., 41, 7121–7128, 2014.
Rahn, M. and Grasemann, B.: Fission track and numerical thermal modeling of differential exhumation of the Glarus thrust plane (Switzerland), Earth Planet Sc. Lett., 169, 245–259, 1999. Rahn, M., Mullis, J., Erdelbrock, K., and Frey, M.: Alpine
metamor-phism in the north Helvetic flysch of the Glarus-Alps, Switzer-land, Eclogae Geol. Helv., 88, 157–178, 1995.
Rieke, H. H. and Chilingarian, G. V.: Compaction of argillaceous sediments, Elsevier, Amsterdam, 1974.
Schindelin, J., Arganda-Carreras, I., Frise, E., Kaynig, V.,
Longair, M., Pietzsch, T., Preibisch, S., Rueden, C.,
Saalfeld, S., and Schmid, B.: Fiji: an open-source platform for biological-image analysis, Nat. Methods, 9, 676–682, https://doi.org/10.1038/nmeth.2019, 2012.
Schmid, S. M.: The Glarus overthrust: field evidence and mechani-cal model, Eclogae Geol. Helv., 68, 247–280, 1975.
Schneider, C. A., Rasband, W. S., and Eliceiri, K. W.: NIH Image to ImageJ: 25 years of image Analysis, Nat. Methods, 9, 671–675, 2012.
Siegenthaler, C.: Die nordhelvetische Flysch-Gruppe im Sernftal (Kt. Glarus), Unpublished PhD Thesis, University of Zurich, 83 pp., 1974.
Thury, M. and Bossart, P.: The Mont Terri rock laboratory, a new international research project in a Mesozoic shale formation, in Switzerland, Eng. Geol., 52, 347–359, 1999.
Tiab, D. and Donaldson, E. C.: Petrophysics: theory and practice of measuring reservoir rock and fluid transport properties, Gulf professional publishing, Oxford, 2015.
Trümpy, R.: Die Helvetischen Decken der Ostschweiz; Versuch einer palinspastischen Korrelation und Ansätze zu einer kinema-tischen Analyse, Eclogae Geol. Helv., 62, 105–142, 1969. Viana, M., Jouannin, P., Pontier, C., and Chulia, D.: About
pycno-metric density measurements, Talanta, 57, 583–593, 2002.
Virgo, S., Heup, T., Urai, J. L., and Berlage, T.: Virtual Petrogra-phy (ViP)-A virtual microscope for the geosciences, EGU Gen-eral Assembly Conference Abstracts, Vienna, 17–22 April 2016, 14669, 2016.
von Däniken, P. A. and Frehner, M.: 3D structural model and kine-matic interpretation of the Panixer Pass Transverse Zone (Infra-helvetic Complex, eastern Switzerland), Swiss J. Geosci., 110, 653–675, 2017.
Warr, L. N., Wojatschke, J., Carpenter, B. M., Marone, C., Schle-icher, A. M., and van der Pluijm, B. A.: A “slice-and-view” (FIB– SEM) study of clay gouge from the SAFOD creeping section of
the San Andreas Fault at∼2.7 km depth, J. Struct. Geol., 69,
234–244, 2014.
Washburn, E. W.: The dynamics of capillary flow, Phys. Rev., 17, 273–283, https://doi.org/10.1103/PhysRev.17.273, 1921. Yang, R., He, S., Yi, J., and Hu, Q.: Nano-scale pore structure and
fractal dimension of organic-rich Wufeng-Longmaxi shale from Jiaoshiba area, Sichuan Basin: Investigations using FE-SEM, gas adsorption and helium pycnometry, Mar. Petrol. Geol., 70, 27– 45, 2016.
Zeng, W., Zhang, J., Ding, W., Zhao, S., Zhang, Y., Liu, Z., and Jiu, K.: Fracture development in Paleozoic shale of Chongqing area (South China), Part one: Fracture characteristics and comparative analysis of main controlling factors, J. Asian Earth Sci., 75, 251– 266, 2013.
Zhang, Z., Kruschwitz, S., Weller, A., and Halisch, M.: Enhanced
pore space analysis by use of µ-CT, MIP, NMR, and SIP,
Solid Earth Discuss., https://doi.org/10.5194/se-2018-42, in re-view, 2018.