Nonlin. Processes Geophys., 18, 251–260, 2011 www.nonlin-processes-geophys.net/18/251/2011/ doi:10.5194/npg-18-251-2011
© Author(s) 2011. CC Attribution 3.0 License.
Nonlinear Processes
in Geophysics
Northern Hemisphere patterns of phase coherence between
solar/geomagnetic activity and NCEP/NCAR and ERA40
near-surface air temperature in period 7–8 years oscillatory modes
M. Paluˇs1and D. Novotn´a2
1Institute of Computer Science, Academy of Sciences of the Czech Republic, Pod vod´arenskou vˇeˇz´ı 2, 182 07 Prague 8, Czech Republic
2Institute of Atmospheric Physics, Academy of Sciences of the Czech Republic, Boˇcn´ı II/1401, 141 31 Prague 4, Czech Republic
Received: 8 November 2010 – Revised: 12 March 2011 – Accepted: 14 March 2011 – Published: 1 April 2011
Abstract. Beginning from the 1950’s, Paluˇs and Novotn´a (2009) observed statistically significant phase co-herence among oscillatory modes with the period of approx-imately 7–8 years detected in monthly time series of sunspot numbers, geomagnetic activity aa index, North Atlantic Os-cillation (NAO) index and near-surface air temperature from several mid-latitude European stations. Focusing on geo-graphical distribution of the phenomenon we study North-ern Hemisphere pattNorth-erns of phase coherence between so-lar/geomagnetic activity and NCEP/NCAR and ERA40 near-surface air temperature. Both the reanalysis datasets provide consistent patterns of areas with marked phase coupling be-tween solar/geomagnetic activity and climate variability ob-served in continuous monthly data, independent of the sea-son, however, confined to the temporal scale related to the oscillatory periods about 7–8 years.
1 Introduction
A renewed interest in the field of Sun–climate relations, namely in detecting and understanding of climate responses to variable solar activity has led to a number of re-cently published interesting results (see Haigh, 2003, 2005, 2007; De Jager, 2005; Lean et al., 2005; Lockwood and Frohlich, 2007; Tinsley, 2008; Lockwood, 2009 and refer-ences therein). There is empirical evidence that the response to solar signal is not homogenously distributed over the
at-Correspondence to: M. Paluˇs
(mp@cs.cas.cz)
mosphere, but it shows latitudinal, longitudinal and altitu-dinal dependence. While there is a well-documented influ-ence of the solar signal in the stratosphere, observations of the tropospheric responses to the solar variability are more ambiguous. Besides the geographical complexity, the dy-namical coupling between the stratosphere and troposphere remains poorly understood (Rind et al., 2008; Simpson et al., 2009).
In this study we are interested in tropospheric responses to variable solar activity, in particular, in measurable influences of the solar variability observed in near-surface air tempera-ture.
The strongest solar signal in the tropospheric temperature has been observed predominantly in middle latitudes (Haigh, 2003; Lu et al., 2007), eventually in the tropics and in the middle latitudes of both hemispheres (Gleisner and Thejll, 2003; Gleisner et al., 2005). Analogous latitudinal depen-dence – maximal response in the middle latitude near-surface air temperature was demonstrated by Lean and Rind (2008), while Camp and Tung (2007); Tung and Camp (2008) ob-served the strongest solar cycle response in higher latitudes.
A search for dynamical mechanisms of interacting com-plex processes underlying experimental data in many cases starts with an attempt to identify trends, oscillatory processes and/or other potentially deterministic signals in a noisy envi-ronment. Paluˇs and Novotn´a (1998, 2004, 2006, 2007, 2008) used the Enhanced Monte-Carlo Singular System Analysis (EMCSSA) in order to detect quasiperiodic phenomena in near-surface air temperature from a number of European sta-tions, in the monthly North Atlantic Oscillation (NAO) in-dex and, more recently, in the geomagnetic aa inin-dex and in the sunspot numbers. The North Atlantic Oscillation is a dominant pattern of atmospheric circulation variability in the extratropical Northern Hemisphere, accounting for about 60% of the total sea-level pressure variance. The NAO has a strong effect on European weather conditions, influenc-ing meteorological variables includinfluenc-ing temperature (Hurrell et al., 2001a,b). A number of oscillatory modes, some of them with quite similar periods (Paluˇs and Novotn´a, 2007, 2008), have been identified in both the solar/geomagnetic data and climate data, the latter represented by near-surface air temperatures from European stations and the NAO index. The existence of oscillatory modes of common frequencies allows for an application of phase-synchronization analysis (Pikovsky et al., 2001; Paluˇs and Novotn´a, 2006; Paluˇs et al., 2000, 2007) in order to detect possible interactions in the studied data. Not surprisingly, 11 years cycles in the sunspot data and the geomagnetic aa index have been found phase-coherent. There was, however, no phase relations found in the 11 years cycle between the solar/geomagnetic data and the climate data, neither the 11 years cycle have been found significantly present in the near-surface air tem-perature records in the mid-latitude European stations in the EMCSSA tests. Possible harmonics, i.e. cycles with period 5.5 years have been identified in these temperature records, however, they are not locked with the solar 11 years cycle (Paluˇs and Novotn´a, 2009). These results are in agreement with those of Moore et al. (2006) who found no consistent phase relationship between the 11 years sunspot cycles and the sea ice extent or the spring ice break-up in seas and ports, sea surface temperatures, sea level pressure, and various long meteorological records from cities in Europe.
On the other hand, the EMCSSA analysis statistically con-firmed existence of oscillatory modes with the period 7– 8 years in both climate (NAO index, near-surface air tem-perature from mid-latitude European stations) and solar/geo-magnetic data. Instantaneous phases of the modes underwent synchronization analysis and their statistically significant phase coherence, beginning from 1950’s, has been observed. Thus Paluˇs and Novotn´a (2009) were able to present the sta-tistical evidence for a coupling between solar/geomagnetic activity and climate variability, obtained from continuous monthly data, independent of the season, however, confined to the temporal scale related to oscillatory periods about 7– 8 years.
In our previous analyses (Paluˇs and Novotn´a, 1998, 2004, 2006, 2007, 2009) the long-term near-surface temperature records from European stations were used. In this pa-per we study Northern Hemisphere geographical patterns of phase coherence between solar/geomagnetic activity and near-surface air temperature from NCEP/NCAR and ERA40 reanalysis data, considering the period 7–8 years oscilla-tory modes. Thus we map a relative strength of the so-lar/geomagnetic influence on a part of temperature variabil-ity over the Northern Hemisphere and compare the results with the pattern of coherence between the NAO index and NCEP/NCAR and ERA40 near-surface temperatures. For better comparability of results of the previous and the present studies the identical characteristics of solar/geomagnetic ac-tivity (sunspots numbers, aa index) were used.
2 Methods
The phase synchronization analysis (Pikovsky et al., 2001; Paluˇs and Novotn´a, 2006; Paluˇs et al., 2000, 2007) is a use-ful tool for discovering weak dependence in noisy, non-stationary and relatively short data from oscillatory pro-cesses. It has many successful applications in physiology (Sch¨afer et al., 1998) and other sciences (Pikovsky et al., 2001). In analysis of climate related data, Maraun and Kurths (2005) have found epochs of phase coherence be-tween the El Ni˜no-Southern Oscillation and the Indian mon-soon. Tatli (2007) presents phase synchronization between the North Sea–Caspian pattern index and near-surface air temperature over large territories of the extratropical North-ern Hemisphere. Considering a system whose evolution is dominated by a (quasi-)oscillatory dynamics, the state of such a system can be described by its instantaneous phase φ (Pikovsky et al., 2001). For a measured time series, the phaseφcan be obtained using the analytic signal concept of Gabor (1946). For an arbitrary time seriess(t )the analytic signalψ (t )is a complex function of time defined as ψ (t )=s(t )+is(t )ˆ =A(t )eiφ (t ). (1)
The instantaneous phaseφ (t )of the signals(t )is then φ (t )=arctans(t )ˆ
s(t ). (2)
There are several ways how to determine the imaginary part
ˆ
s(t )of the analytic signalψ (t ). In the standard approach of Gabor (1946), s(t )ˆ is given by the (discrete) Hilbert trans-form ofs(t )(Rosenblum et al., 1996; Paluˇs, 1997; Pikovsky et al., 2001). When this procedure is applied to a broadband signal, a filtering procedure is required before computing the Hilbert transform.
M. Paluˇs and D. Novotn´a: Northern Hemisphere patterns of phase coherence 253 scale (frequency) of the studied cycles (here the period of 96
months) can directly be used in Eq. (2) for the estimation of the phaseφ (t ). The CCWT provides both the band-pass fil-tering of the signal and the phase estimation. In a similar context, Moore et al. (2006) use the wavelet extracted phases to search for relations between the sunspot cycle and vari-ous meteorological records. Using the same type of phases, Mokhov and Smirnov (2006) demonstrated that the El Ni˜no-Southern Oscillation drives the North Atlantic Oscillation.
Both the filtering and the phase estimation is also given as an output of singular system analysis. Paluˇs and Novotn´a (2007) had used the EMCSSA for the detection of the oscillatory modes in the analyzed data. Once the existence of a particular mode is confirmed in the EMCSSA test, for the phase synchronization analysis it is suitable to extract the instantaneous phase of the detected mode by using the CCWT which gives the instantaneous phases correctly localized in time (Paluˇs and Novotn´a, 2006; Paluˇs et al., 2005).
In the classical case of periodic self-sustained oscillators, existence of their coupling (dependence) can lead to phase synchronization, defined as a phase locking, i.e., the phase difference 1φ (t )=φ1(t )−φ2(t ) is constant. In the case of phase-synchronized chaotic or other complex and noisy systems, fluctuations of the phase difference typically oc-cur. Therefore, the criterion for phase synchronization is that the absolute values of1φ are bounded (Rosenblum et al., 1996). It is important to note that the instantaneous phases are not represented as cyclic functions in the interval[0,2π ) or[−π,π ), but as monotonously increasing functions on the whole real line. Then also the instantaneous phase differ-ence1φ (t )is defined on the real line and is an unbounded (increasing or decreasing) function of time for asynchronous (independent) systems, while epochs of phase synchroniza-tion (or coherence) appear as plateaus in 1φ (t ) vs. time plots. In order to prove that the phase synchronization (co-herence) indeed exists in the analyzed data, it must be as-sessed in a quantitative way. A useful quantitative descrip-tion of phase coupling is the mean phase coherenceγdefined as
γ2= hcos(1φ (t ))i2+ hsin(1φ (t ))i2 (3) wherehimeans the temporal average. The mean phase coher-ence (MPC) tends to zero for1φof asynchronous processes and to one for phase locked systems. Considering real, noisy data neither 0 nor 1 is reached. Therefore, possible presence of phase synchronization or phase coherence is assessed in a statistical test based on surrogate data (Paluˇs, 2007; Paluˇs and Novotn´a, 2006). The numerically generated surrogate data have the same frequency spectra (amplitudes of Fourier coefficients) as the original data, but their Fourier phases are randomized independently for each time series. Thus any dependence between the series, present in the original tested data, is removed in the surrogate data. However, the auto-correlations (serial auto-correlations) of individual series are
pre-served. A probability thatγo, observed in the analyzed data, can occur by chance without any real dependence, is evalu-ated using a large number of surrogate data realizations. If the probability of a random occurrence ofγ≥γois smaller than, say, 5%, we say that the statistical test is significant on the level 95%, or withp <0.05. Such a result is usually considered as the statistical evidence for existence of phase synchronization in the studied pair of time series. Strictly speaking, however, such statistical testing provides the evi-dence for depenevi-dence of the phases, but not necessarily for the specific physical mechanism of phase synchronization. Therefore we will use the broader term “phase coherence” instead of the more specific “phase synchronization”.
3 Data
For comparison with the previous study (Paluˇs and Novotn´a, 2009), we briefly demonstrate some results obtained us-ing monthly mean values of the near-surface air tempera-ture from these stations: Prague–Klementinum (longitude 14◦250E, latitude 50◦050N), Bamberg (10◦530E, 49◦530N), Basel (07◦350E, 47◦330N), De Bilt (05◦110E, 52◦060N), Pots-dam (13◦040E, 52◦230N), Vienna (16◦210E, 48◦140N), and Zurich (08◦340E, 47◦230N), from the period 1901–1999 (Klein-Tank et al., 2002).
In this study we use monthly mean values of the near-surface air temperature from the NCEP/NCAR (Kalnay et al., 1996) and ERA40 (Simmons and Gibson, 2000) reanalyses. We use the Northern Hemisphere data in the latitudes from 0 to 70◦N in the grid of 2.5◦×2.5◦in the case of the ERA40 data and 1.875◦×1.9◦in the case of the NCEP/NCAR data. We evaluate the mean phase coherence for temporal seg-ments of 512 months, starting in January 1958 and ending in August 2000 (see the thick solid line in Fig. 1b). As the only pre-processing of the data, the annual cycle was removed by subtracting the mean values for each month in the year.
The NAO index is defined as the normalized pressure difference between the Azores and Iceland. The monthly NAO index with its detailed description is available at http: //www.cru.uea.ac.uk/cru/data/. The aa index is a measure of the disturbance level of the Earths magnetic field based on magnetometer observations at two nearly antipodal stations: Hartland observatory in the UK and Canberra observatory in Australia. The aa-index was obtained from World Data Centre for Solar-Terrestrial Physics, Chilton, http://www. ukssdc.ac.uk/wdcc1/wdc menu.html. The sunspot data was obtained from the SIDC-team, Royal Observatory of Bel-gium, Ringlaan 4, 1180 Brussels, BelBel-gium, http://sidc.oma. be/DATA/monthssn.dat.
netic activity, NAO index and surface air temperature records, J. Atmos. Sol.-Terr. Phys., 69, 2405–2415, 2007.
Paluˇs, M., Kurths, J., Schwarz, U., Seehafer, N., Novotn´a, D. and Charv´atov´a, I.: The solar activity cycle is weakly synchronized with the solar inertial motion, Phys. Lett. A, 365 412–428, 2007. Paluˇs, M. and Novotn´a, D.: Detecting Oscillations Hidden in Noise: Common Cycles in Atmospheric, Geomagnetic and Solar Data, in: Donner, R. and Barbosa, S. (eds.): Nonlinear Time Series Analysis in the Geosciences – Applications in Climatology, Geo-dynamics, and Solar-Terrestrial Physics. Lecture Notes in Earth Sciences 112. Springer, Berlin, 327–354, 2008.
Paluˇs, M. and Novotn´a, D.: Phase-coherent oscillatory modes in solar and geomagnetic activity and climate variability, J. Atmos. Sol.-Terr. Phys., 71, 923–930,2009.
Pikovsky, A., Rosenblum, M. and Kurths, J.: Synchronization. A Universal Concept in Nonlinear Sciences, Cambridge University Press, Cambridge, 2001.
Piˇsoft, P., Mikˇsovsk´y, J. and ˇZ´ak, M.: An analysis of the spatial distribution of approximate 8 years periodicity in NCEP/NCAR and ERA-40 temperature fields, Eur. Phys. J. Special Topics, 174, 147–155, 2009.
Plaut, G., Ghil, M. and Vautard, R.: Interannual nad interdecadal variability in 335 years of central England temperatures, Science, 268, 710–713, 1995.
Rind, D., Lean, J., Lerner, J., Lonergan, P. and Leboissitier, A.: Ex-ploring the stratospheric/tropospheric response to solar forcing, J. Geophys. Res.-A 113, D24103, 2008.
Rosenblum, M.G., Pikovsky, A.S. and Kurths, J.: Phase synchro-nization of chaotic oscillators, Phys. Rev. Lett., 76, 1804–1807 1996.
Salby, M.L. and Callaghan, P.F.: Relationship of the quasi-biennial oscillation to the stratospheric signature of the solar cycle, J. Geophys. Res. 111, D 06110, 2006.
Sch¨afer, C., Rosenblum, M.G., Kurths, J. and Abel, H.-H.: Heart-beat synchronized with ventilation, Nature, 392, 239, 1998. Simmons, A.J. and Gibson, J.K. (Eds.): The ECMWF Project Plan,
ECMWF Project Report Series, 1, ECMWF, Reading, UK, 2000. Simpson, I.R., Blackburn, M. and Haigh, J.D.: The role of eddies in driving the tropospheric response to stratospheric heating per-turbations, J. Atmos. Sci. 66(5), 1347-1365, 2009.
Tatli, H.: Synchronization between the North Sea–Caspian pattern (NCP) and surface air temperatures in NCEP, Int. J. Climatol., 27, 1171–1187, 2007.
Thejll, P., Christiansen, B., and Gleisner, H.: On correlation be-tween the North Atlantic Oscillation, geopotential heights, and geomagnetic activity, Geophys. Res. Lett., 30(6), 1347, 2003. Tinsley, B.A.: The global atmospheric electric circuit and its
ef-fects on cloud microphysics, Reports on Progress in Physics, 71, 066801, 2008.
Torrence, C. and Compo, G.P.: A practical guide to wavelet analy-sis, Bull. Amer. Meteorological Society, 79(1), 61–78, 1998. Tung, K. K. and Camp, Ch. D.: Solar cycle warming at the Earth
surface in NCEP and ERA40 data: A linear diskriminant analy-sis, J. Geophys. Res., 113, D05114, 2008.
Unal, Y.S. and Ghil, M.: Interannual and interdecadal oscillation patterns in sea level, Clim. Dyn., 11, 255–278, 1995.
Usoskin, I.G., Schussler, M., Solanki, S.K. and Mursula, K.: Solar activity, cosmic rays, and Earth’s temperature. A millenium-scale comparison, J. Geophys. Res., 110, A10102, 2005.
1920 1940 1960 1980 2000 -5 0 (b) TIME [YEAR] PHASE DIFFERENCE ∆φ [RAD]
1920 1940 1960 1980 2000 -5
0
1920 1940 1960 1980 2000 -5 0 -10 -5 0 (a) -10 -5 0 -10 -5 0 -10 -5 0 -10 -5 0 -10 -5 0 -10 -5 0
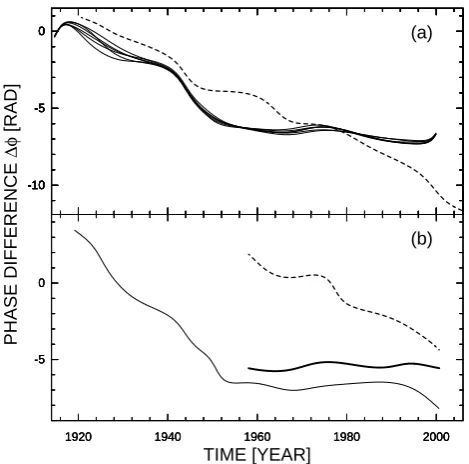
Fig. 1. The instantaneous phase differences of pairs of the oscilla-tory modes obtained using CCWT with the central wavelet period 96 months from (a) the aa index and the near-surface air temperature from the 6 European stations listed in the Data section (all except of Prague-Klementinum) (thin solid lines); the aa index and the 70 years shifted Prague-Klementinum near-surface air temperature se-ries (dashed line); (b) the aa index and the Prague-Klementinum (14◦25’E,50◦05’N) near-surface air temperature series (thin solid line); the aa index and the ERA40 near-surface air temperature clos-est to Prague grid point (15◦00’E,50◦00’N) (thick solid line); and the aa index and the ERA40 near-surface air temperature from a no-coherence area (0◦00’E,25◦00’N) (dashed line).
Wang, G., Swanson, K.L. and Tsonis, A.A.: The pacemaker of ma-jor climate shifts, Geophys. Res. Lett., 36, L07708, 2009. Fig. 1. The instantaneous phase differences of pairs of the
oscilla-tory modes obtained using CCWT with the central wavelet period 96 months from (a) the aa index and the near-surface air tempera-ture from the 6 European stations listed in the Data section (all ex-cept of Prague-Klementinum) (thin solid lines); the aa index and the 70 years shifted Prague-Klementinum near-surface air temperature series (dashed line); (b) the aa index and the Prague-Klementinum (14◦250E, 50◦050N) near-surface air temperature series (thin solid line); the aa index and the ERA40 near-surface air temperature clos-est to Prague grid point (15◦000E, 50◦000N) (thick solid line); and the aa index and the ERA40 near-surface air temperature from a no-coherence area (0◦000E, 25◦000N) (dashed line).
4 Results
In order to remind the results of our previous study (Paluˇs and Novotn´a, 2009), in Fig. 1 we plot the instantaneous phase dif-ference1φ (t )between the aa index and several near-surface air temperature series, obtained using the central wavelet fre-quency related to the period of 96 months. The thin solid lines in Fig. 1a illustrate1φ (t )between aa index and tem-peratures from Bamberg, Basel, De Bilt, Potsdam, Vienna and Zurich. The result for the Prague-Klementinum series is plotted in Fig. 1b using the thin solid line. In all cases 1φ (t )decreases at the beginning, however, a plateau occurs from 1950’s. The phase coherence in the plateau was quan-tified using MPC and mutual information (Paluˇs, 1997) and tested using Fourier transform-based surrogate data with the results strongly supporting the existence of phase synchro-nization/coherence on the significance levels about 99.5% (p <0.005) (Paluˇs and Novotn´a, 2009). For a visual demon-stration of the difference between phase coherent and non-coherent modes, we plot1φ (t )between the aa index and the Prague near-surface air temperature shifted by 70 years
(dashed line in Fig. 1a). We can see that in this case1φ (t ) does not plateau but decreases also after 1950’s with the same slope as before 1950’s.
Now, in order to compare station data with the reanalysis gridded data, in Fig. 1b (thick solid line) we plot the instan-taneous phase difference1φ (t ) between the aa index and the near-surface air temperature from the ERA40 grid point 15◦000E, 50◦000N (the closest ERA40 grid point to Prague). Apparently,1φ (t )is confined to the plateau. On the other hand, the decreasing1φ (t )(dashed line in Fig. 1b) was ob-tained from the ERA40 grid point 0◦000E, 25◦000N which, as we will see below, belongs to one of the areas where no phase coherence between solar/geomagnetic activity and tempera-ture variability was observed. These two1φ (t )curves also demonstrate the temporal extent of all the following analyses – a segment of 512 months starting in January 1958, ending in August 2000.
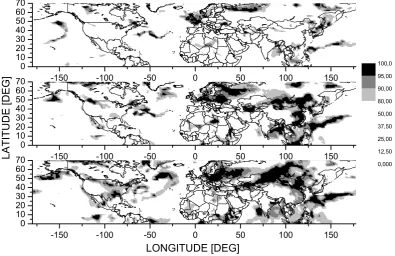
Using the sunspot data with removed modes related to the 11 years cycle (Paluˇs and Novotn´a, 2008, 2009) and aa index and NAO index without any preprocessing, we have computed the instantaneous phase difference1φ (t )between each of these three variables and near-surface air tempera-ture data from each grid point of both the reanalysis sets. The instantaneous phases were obtained from the CCWT us-ing the central wavelet frequency related to the period of 96 months. The behaviour of1φ (t )has been quantified by mean phase coherenceγaccording to Eq. (3). The MPC val-ues are mapped, using color coding, in Fig. 2 for the ERA40 and in Fig. 3 for the NCEP/NCAR reanalysis data. The areas of strong phase coherence between the solar data (top panels) and geomagnetic aa index (middle panels) on one side and the temperature data on the other side seem to be more ex-tended in the ERA40 data (Fig. 2) than in the NCEP/NCAR data (Fig. 3). Closer inspection and consideration of the different grid densities used, however, give arguments for a quite good consistency of the obtained results.
5 Statistical evaluation
M. Paluˇs and D. Novotn´a: Northern Hemisphere patterns of phase coherence 255
Fig. 2. The mean phase coherence between the sunspot data (top panel), geomagnetic aa index (middle panel), NAO index (bottom panel)
and the ERA40 near-surface air temperature for the oscillatory modes obtained using CCWT with the central wavelet period 96 months.
Fig. 3. The mean phase coherence between the sunspot data (top panel), geomagnetic aa index (middle panel), NAO index (bottom panel) and
Fig. 4. The significance levels for the mean phase coherence between the sunspot data (top panel), geomagnetic aa index (middle panel),
NAO index (bottom panel) and the ERA40 near-surface air temperature for the oscillatory modes obtained using CCWT with the central wavelet period 96 months. The shadowed levels are 80% (p <0.2, light grey), 90% (p <0.1, dark grey), and 95% (p <0.05, black).
Fig. 5. The significance levels for the mean phase coherence between the sunspot data (top panel), geomagnetic aa index (middle panel),
M. Paluˇs and D. Novotn´a: Northern Hemisphere patterns of phase coherence 257 realistic approach would need to estimate the number of
ac-tually independent tests which is not a trivial task. There-fore we present spatially mapped significance based on sin-gle tests in Fig. 4 for the ERA40 and in Fig. 5 for the NCEP/NCAR reanalysis data, for better understanding of the absolute MPC values, rather then as a statistical evidence. We remind that we were able to perform the appropriate rig-orous tests using the above mentioned station data, so that the statistical evidence for the existence of the discussed phase coherence has been presented in (Paluˇs and Novotn´a, 2009).
6 Discussion of the results
A quick comparison of the top and middle panels in Figs. 2–5 reminds the results from the station data (Paluˇs and Novotn´a, 2009) where the coherence of temperature with the sunspot data has been weaker than that with the geomagnetic data, however, all the results were statistically significant. Here the areas of high coherence between temperature and the sunspot data (top panels in Figs. 2–5) are less extended than the ar-eas of high coherence between temperature and the aa index (middle panels in Figs. 2–5). The areas of high coherence of temperature with the sunspot data are subsets of the coher-ence areas of temperature with the aa index. This generally seems to be the case, with one exception – the Great Britain and Ireland, the areas with quite high and statistically signif-icant phase coherence between temperature and the sunspot data, but with low (insignificant in NCEP/NCAR data) co-herence with the aa index.
Since Paluˇs and Novotn´a (2009) observed mutual coher-ence of temperature, the sunspot data, the aa index and the NAO index, it might be useful to study also the coherence patterns between temperature and the NAO index (bottom panels in Fig. 2–5). These areas are the most extended and include consistently the areas of phase coherence of tempera-ture with the geomagnetic aa index and consequently also the areas of coherence with the sunspot data, however, with the exception of the Great Britain and Ireland, as noted above. The area of high phase coherence of temperature with NAO corresponds to the area of impacts of Atlantic climate vari-ability depicted by Marshall et al. (2001).
These findings could open the debate about the role of the NAO phenomenon (Hurrell et al., 2001a,b) in possible trans-mission of the solar signal from the stratosphere to the tro-posphere and about the role of geomagnetic activity in the climate variability.
7 General discussion and conclusion
Thejll et al. (2003) observed correlations between the ge-omagnetic Ap index and the winter NAO, increasing from 1950’s, although statistically significant from 1970’s. Us-ing filtered data of the yearly aa index and the winter NAO
index, Lukianova and Alekseev (2004) claim that their cor-relation is significant since the end of 1940’s. Paluˇs and Novotn´a (2007, 2008) proved existence of common oscilla-tory modes (i.e., the modes with the same average period) in the solar/geomagnetic and climate data. Therefore they were able to apply the synchronization analysis in order to find a possible dependence between the phases of the observed oscillatory modes, and thus to find possible scale-specific re-lationships of the solar, geomagnetic and climate variability. The phase coherence has been found and statistically con-firmed in relationships of the oscillatory modes with the pe-riod of approximately 7–8 years detected in the sunspot data, the aa index, the NAO index and the near-surface air tem-perature from several European stations, starting in 1950’s in the continuous monthly records independent of the season, and without any special preprocessing such as removal of El Ni˜no and volcanic signals (Paluˇs and Novotn´a, 2009).
In this paper we present the Northern Hemisphere pat-terns of phase coherence between solar/geomagnetic activity and NCEP/NCAR and ERA40 near-surface air temperature in period 7–8 years oscillatory modes, again in the continu-ous monthly records independent of the season, and without any special data preprocessing. The temporal scale related to the oscillatory period 7–8 years has not been chosen ar-bitrarily, but based on our previous results proving the ex-istence of the period 7–8 years oscillatory modes in the so-lar/geomagnetic and climate data (Paluˇs and Novotn´a, 1998, 2004, 2007, 2008).
7–8 years present an important part of climate variability. We have shown the Northern Hemisphere patterns of phase coherence between the period 7–8 years oscillatory modes in near-surface air temperature and solar/geomagnetic activity during the second half of the 20th century.
Tung and Camp (2008) discussed some inconsis-tency between the ERA40 and NCEP/NCAR reanaly-sis data related to derivation of the surface temperature. Gleisner et al. (2005) reported weaker solar signal response in the ERA40 data than in the NCEP/NCAR data in the up-per troposphere thickness, and substantially weaker solar sig-nal response in both data sets in lower troposphere thickness. Piˇsoft et al. (2009) point to inconsistencies in occurrence of approximate 8 years periodicities in different geopotential levels in reanalysis temperature data with weaker signal in the ERA40 data set. Using the temporal scale of naturally existing oscillatory phenomena we have found almost con-sistent results using both the ERA40 and NCEP/NCAR re-analysis data. We pose a question about a possible role of the NAO in the transmission of the solar influence from the stratosphere to the troposphere. The future aims range from technical tasks (analysis of different solar data, inclusion of the Southern Hemisphere), through theoretical challenges re-lated to the origin of the observed oscillatory modes and their interactions (Does NAO play a role in the solar signal tran-sition mechanism from the stratosphere to the troposphere? Or, is NAO the instigator of the observed phase coherence and other synchronization phenomena which can lead to cli-mate shifts, as recently proposed by Wang et al. (2009)?) to the quite critical question about the role of this part of climate variability in the present climate change.
The atmospheric processes are nonlinear and thus we can-not expect full understanding of weather and climate evo-lution within the framework of linear theory. Nonlinear phenomena such as phase synchronization can help to un-derstand cooperative behaviour and coupling within atmo-spheric phenomena and with possible external influences. We believe that the presented results will foster relevant dis-cussions and the research in this direction can contribute to understanding of the role of the solar and geomagnetic activ-ity in the changing climate.
Acknowledgements. This study was supported by the Grant
Agency of the Academy of Sciences of the Czech Republic project No. IAA300420805, and in part by the Institutional Research Plans AV0Z10300504 and AV0Z30420517.
Edited by: J. Kurths
Reviewed by: two anonymous referees
References
Camp, Ch. D. and Tung, K. K.: Surface warming by the solar cycle as revealed by the composite mean difference projection, Geo-phys. Res. Lett., 34, L14703, doi:10.1029/2007GL030207, 2007. Da Costa, E. D. and de Verdiere, A. C.: The 7.7-year North Atlantic
Oscillation, Q. J. R. Meteorol. Soc., 128, 797–817, 2002. De Jager, C.: Solar forcing of climate. 1: Solar variability, Space
Sci. Rev., 120, 197–241, 2005.
De Jager, C. and Usoskin, I. G.: On possible drivers of Sun-induced climate changes, J. Atmos. Sol.-Terr. Phys., 68, 2053– 2060, 2006.
Feliks, Y. and Ghil, M.: Interannual, synchronized oscillations over the North Atlantic, Eastern Mediterranean and Ethiopian Plateau, Geophys. Res. Abstr., 9, 05600, 2007.
Gabor, D.: Theory of Communication, J. IEE London, 93(3), 429– 457, 1946.
G´amiz-Fortis, S. R., Pozo-V´azques, D., Esteban-Parra, M. J., and Castro-D´ıez, Y.: Spectral characteristics and predictability of the NAO assessed through Singular Spectral Analysis, J. Geophys. Res., 107(D23), 4685, doi:10.1029/2001JD001436, 2002. G´amiz-Fortis, S. R. and Sutton, R. T.: Quasi-periodic fluctuations
in the Greenland-Iceland-Norwegian Seas region in a coupled climate model, Ocean Dyn., 57(6), 541–557, 2007.
Gleisner, H. and Thejll, P.: Patterns of tropospheric re-sponse to solar variability, Geophys. Res. Lett., 30(13), 1711, doi:10.1029/2003GL017129, 2003.
Gleisner, H., Thejll, P., Stendel, M., Kaas, E., and Machenhauer, B.: Solar signals in tropospheric re-analysis data: Comparing NCEP/NCAR and ERA40, J. Atmos. Sol.-Terr. Phys., 67, 785– 791, 2005.
Haigh, J. D.: The effects of solar variability on the Earth‘s climate, Phil. Trans. R. Soc. Lond. A, 361, 95–111, 2003.
Haigh, J. D.: Solar variability and climate, Astrophys. Space Sc. L., 344, 65–81, 2005.
Haigh, J. D.: The Sun and Earth‘s Climate, Living Rev. So-lar Phys., 4, lrsp-2007-2, http://soSo-larphysics.livingreviews.org/ Articles/lrsp-2007-2/, last access: 30 March 2011, 2007. Hurrell, J. W., Kushnir, Y., and Visbeck, M.: The North Atlantic
Oscillation, Science, 291(5504), 603–605, 2001a.
Hurrell, J. W., Kushnir, Y., Ottersen, G., and Visbeck, M.: Climate – An Overview of the North Atlantic Oscillation, The North At-lantic Oscillation, Geophys. Monograph, 134, 1–33, 2001b. Jevrejeva, S. and Moore, J. C.: Singular Spectrum Analysis of
Baltic Sea ice conditions and large-scale atmospheric patterns since 1708, Geophys. Res. Lett., 28(23), 4503–4506, 2001. Jevrejeva, S., Grinsted, A., Moore, J. C., and Holgate, S.: Nonlinear
trends and multiyear cycles in sea level records, J. Geophys. Res., 111, C09012, doi:10.1029/2005JC003229, 2006.
Kalnay, E., Kanamitsu, M., Kistler, R., Collins, W., Deaven, D., Gandin, L., Iredell, M., Saha, S., White, G., Woollen, J., Zhu, Y., Chelliah, M., Ebisuzaki, W., Higgins, W., Janowiak, J., Mo, K., Ropelewski, C., Wang, J., Leetmaa, A., Reynolds, R., Jenne, R., and Joseph, D.: The NCEP/ NCAR 40-year re-analysis project, Bull. Am. Meteorol. Soc., 77, 437–471, 1996.
Bukan-M. Paluˇs and D. Novotn´a: Northern Hemisphere patterns of phase coherence 259
tis, A., Aberfeld, R., van Engelen, A. F. V., Forland, E., Mietus, M., Coelho, F., Mares, C., Razuvaev, V., Nieplova, E., Cegnar, T., L´opez, J. A., Dahlstr¨om, B., Moberg, A., Kirchhofer, W., Cey-lan, A., Pachaliuk, O., Alexander, L. V., and Petrovic, P.: Daily dataset of 20th century surface air temperature and precipitation series for the European Climate Assessment, Int. J. Climatology, 22, 1441–1453, 2002.
Lean, J., Wang, Y. M., and Sheeley, N. R.: SORCE contribution to new understanding of global change and solar variability, Sol. Phys., 230, 27–53, 2005.
Lean, J. L. and Rind, D. H.: How natural and anthro-pogenic influences alter global and regional surface temper-atures: 1889 to 2006, Geophys. Res. Lett., 35, L18701, doi:10.1029/2008GL034864, 2008.
Lockwood, M.: Recent changes in solar outputs and the global mean surface temperature. III. Analysis of contributions to global mean air surface temperature rise, Proc. R. Soc. A, 464, 1387– 1404, 2009.
Lockwood, M. and Frohlich, C.: Recent oppositely-directed trends in solar climate forcing and the global mean surface air tempera-ture, Proc. R. Soc. A, 463, 2447–2460, 2007.
Lu, H., Jarvis, M. J., Graf, H.-F., Young, P. C., and Horne, R. B.: Atmospheric temperature response to solar irradiance and geomagnetic activity, J. Geophys. Res., 112, D11109, doi:10.1029/2006JD007864, 2007.
Lukianova, R. and Alekseev, G.: Long-term correlation between the NAO and solar activity, Solar Phys., 224, 445–454, 2004. Maraun, D. and Kurths, J.: Epochs of phase coherence between El
Ni˜no/Southern Oscillation and Indian monsoon, Geophys. Res. Lett., 32(15), L15709, doi:10.1029/2005GL023225, 2005. Marshall, J., Kushnir, Y., Battist, D., Chang, P., Czaja, A.,
Dick-son, R., Hurrel, J., McCartney, M., Saravanan, R., and Visbeck, M.: North Atlantic climate variability: Phenomena, Impacts and Mechanisms, Int. J. Climatol., 21, 1863–1898, 2001.
Mayaud, P. N.: The aa indices: a 100year series characterizing the magnetic activity, J. Geophys. Res., 77(34), 6870–6874, 1972. Mokhov, I. I. and Smirnov, D. A.: El Ni˜no-Southern
Oscilla-tion drives North Atlantic OscillaOscilla-tion as revealed with nonlin-ear techniques from climatic indices, Geophys. Res. Lett., 33(3), L03708, doi:10.1029/2005GL024557, 2006.
Moore, J., Grinsted, A., and Jevrejeva, S.: Is there evidence for sunspot forcing of climate at multi-year and decadal periods? Gephys. Res. Lett., 33, L17705, doi:10.1029/2006GL026501, 2006.
Moron, V., Vautard, R., and Ghil, M.: Trends, interdecadal and in-terannual oscillations in global sea-surface temperatures, Clim. Dynam., 14(7–8), 545–569, 1998.
Paluˇs, M.: Detecting phase synchronization in noisy systems, Phys. Lett. A, 235, 341–351, 1997.
Paluˇs, M.: From Nonlinearity to Causality: Statistical testing and inference of physical mechanisms underlying complex dynam-ics, Contemp. Phys., 48(6), 307–348, 2007.
Paluˇs, M. and Novotn´a, D.: Detecting modes with nontrivial dy-namics embedded in colored noise: Enhanced Monte Carlo SSA and the case of climate oscillations, Phys. Lett. A, 248, 191–202 1998.
Paluˇs, M. and Novotn´a, D.: Enhanced Monte Carlo Singular System Analysis and detection of period 7.8 years oscillatory modes in the monthly NAO index and temperature records, Nonlin.
Pro-cesses Geophys., 11, 721–729, doi:10.5194/npg-11-721-2004, 2004.
Paluˇs, M. and Novotn´a, D.: Quasi-biennial oscillations extracted from the monthly NAO index and temperature records are phase-synchronized, Nonlin. Processes Geophys., 13, 287–296, doi:10.5194/npg-13-287-2006, 2006.
Paluˇs, M. and Novotn´a, D.: Common oscillatory modes in geomag-netic activity, NAO index and surface air temperature records, J. Atmos. Sol.-Terr. Phys., 69, 2405–2415, 2007.
Paluˇs, M. and Novotn´a, D.: Detecting Oscillations Hidden in Noise: Common Cycles in Atmospheric, Geomagnetic and Solar Data, in: Nonlinear Time Series Analysis in the Geosciences – Ap-plications in Climatology, Geodynamics, and Solar-Terrestrial Physics. Lecture Notes in Earth Sciences, edited by: Donner, R. and Barbosa, S., 112, Springer, Berlin, 327–354, 2008.
Paluˇs, M. and Novotn´a, D.: Phase-coherent oscillatory modes in solar and geomagnetic activity and climate variability, J. Atmos. Sol.-Terr. Phys., 71, 923–930, 2009.
Paluˇs, M., Kurths, J., Schwarz, U., Novotn´a, D., and Charv´atov´a, I.: Is the solar activity cycle synchronized with the solar inertial motion?, Int. J. Bif. Chaos, 10, 2519–2526, 2000.
Paluˇs, M., Novotn´a, D. and Tichavsk´y, P.: Shifts of seasons at the European mid-latitudes: Natural fluctuations correlated with the North Atlantic Oscillation, Geophys. Res. Lett., 32, L12805, doi:10.1029/2005GL022838, 2005.
Paluˇs, M., Kurths, J., Schwarz, U., Seehafer, N., Novotn´a, D., and Charv´atov´a, I.: The solar activity cycle is weakly synchronized with the solar inertial motion, Phys. Lett. A, 365, 412–428, 2007. Pikovsky, A., Rosenblum, M., and Kurths, J.: Synchronization. A Universal Concept in Nonlinear Sciences, Cambridge University Press, Cambridge, 2001.
Piˇsoft, P., Mikˇsovsk´y, J., and ˇZ´ak, M.: An analysis of the spatial distribution of approximate 8 years periodicity in NCEP/NCAR and ERA-40 temperature fields, Eur. Phys. J. Special Topics, 174, 147–155, 2009.
Plaut, G., Ghil, M., and Vautard, R.: Interannual nad interdecadal variability in 335 years of central England temperatures, Science, 268, 710–713, 1995.
Rind, D., Lean, J., Lerner, J., Lonergan, P., and Leboissitier, A.: Ex-ploring the stratospheric/tropospheric response to solar forcing, J. Geophys. Res.-A, 113, D24103, doi:10.1029/2008JD010114, 2008.
Rosenblum, M. G., Pikovsky, A. S., and Kurths, J.: Phase synchro-nization of chaotic oscillators, Phys. Rev. Lett., 76, 1804–1807, 1996.
Salby, M. L. and Callaghan, P. F.: Relationship of the quasi-biennial oscillation to the stratospheric signature of the solar cy-cle, J. Geophys. Res., 111, D06110, doi:10.1029/2005JD006012, 2006.
Sch¨afer, C., Rosenblum, M. G., Kurths, J., and Abel, H.-H.: Heartbeat synchronized with ventilation, Nature, 392, 239, doi:10.1038/32567, 1998.
Simmons, A. J. and Gibson, J. K.: The ECMWF Project Plan, ECMWF Project Report Series, 1, ECMWF, Reading, UK, 2000. Simpson, I. R., Blackburn, M., and Haigh, J. D.: The role of ed-dies in driving the tropospheric response to stratospheric heating perturbations, J. Atmos. Sci., 66(5), 1347–1365, 2009.
27, 1171–1187, 2007.
Thejll, P., Christiansen, B., and Gleisner, H.: On correlation between the North Atlantic Oscillation, geopotential heights, and geomagnetic activity, Geophys. Res. Lett., 30(6), 1347, doi:10.1029/2002GL016598, 2003.
Tinsley, B. A.: The global atmospheric electric circuit and its effects on cloud microphysics, Rep. Prog. Phys., 71, 066801, doi:10.1088/0034-4885/71/6/066801, 2008.
Torrence, C. and Compo, G. P.: A practical guide to wavelet analy-sis, Bull. Am. Meteorol. Soc., 79(1), 61–78, 1998.
Tung, K. K. and Camp, Ch. D.: Solar cycle warming at the Earth surface in NCEP and ERA40 data: A linear diskriminant analy-sis, J. Geophys. Res., 113, D05114, doi:10.1029/2007JD009164, 2008.
Unal, Y. S. and Ghil, M.: Interannual and interdecadal oscillation patterns in sea level, Clim. Dynam., 11, 255–278, 1995. Usoskin, I. G., Schussler, M., Solanki, S. K., and Mursula,
K.: Solar activity, cosmic rays, and Earth’s temperature. A millenium-scale comparison, J. Geophys. Res., 110, A10102, doi:10.1029/2004JA010946, 2005.