https://doi.org/10.5194/amt-11-5837-2018 © Author(s) 2018. This work is distributed under the Creative Commons Attribution 4.0 License.
A 12-year long global record of optical depth of absorbing aerosols
above the clouds derived from the OMI/OMACA algorithm
Hiren Jethva1,2, Omar Torres2, and Changwoo Ahn3
1Universities Space Research Association, 7178 Columbia Gateway Drive, Columbia, MD 21046, USA 2NASA Goddard Space Flight Center, Earth Science Division, Code 614, Greenbelt, MD 20771, USA 3Science Systems and Applications, Inc., 10210 Greenbelt Rd, Lanham, MD 20706, USA
Correspondence:Hiren Jethva ([email protected]) Received: 25 May 2018 – Discussion started: 7 June 2018
Revised: 31 August 2018 – Accepted: 25 September 2018 – Published: 24 October 2018
Abstract. Aerosol–cloud interaction continues to be one of the leading uncertain components of climate models, pri-marily due to the lack of adequate knowledge of the com-plex microphysical and radiative processes of the aerosol– cloud system. Situations when light-absorbing aerosols such as carbonaceous particles and windblown dust overlay low-level cloud decks are commonly found in several regions of the world. Contrary to the known cooling effects of these aerosols in cloud-free scenario over darker surfaces, an over-lapping situation of the absorbing aerosols over the cloud can lead to a significant level of atmospheric absorption exerting a positive radiative forcing (warming) at the top of the atmosphere. We contribute to this topic by intro-ducing a new global product of above-cloud aerosol opti-cal depth (ACAOD) of absorbing aerosols retrieved from the near-UV observations made by the Ozone Monitoring Instrument (OMI) onboard NASA’s Aura platform. Phys-ically based on an unambiguous “color ratio” effect in the near-UV caused by the aerosol absorption above the cloud, the OMACA (OMI above-cloud aerosols) algorithm simultaneously retrieves the optical depths of aerosols and clouds under a prescribed state of the atmosphere. The OMACA algorithm shares many similarities with the two-channel cloud-free OMAERUV algorithm, including the use of AIRS carbon monoxide for aerosol type identifica-tion, CALIOP-based aerosol layer height dataset, and an OMI-based surface albedo database. We present the al-gorithm architecture, inversion procedure, retrieval quality flags, initial validation results, and results from a 12-year long OMI record (2005–2016) including global climatol-ogy of the frequency of occurrence, ACAOD, and
1 Introduction
Aerosol–cloud interactions continue to be the most signifi-cant source of uncertainty in estimating the role of aerosols and clouds in Earth’s changing radiation budget (IPCC, 2013). One of the main hurdles is the lack of adequate knowl-edge of the complex microphysical and optical processes of an aerosol–cloud system that govern the resultant im-pact on the regional and global climate. An important as-pect of the problem is when the light-absorbing aerosols such as biomass burning generated carbonaceous particles and windblown mineral dust overlay low-level cloud decks. Such situations are commonly observed from satellites over several oceanic and continental regions of the world on daily to seasonal scales (Devasthale and Thomas, 2011; Alfaro-Contreras et al., 2016). The transoceanic transport of ele-vated fine mode aerosols from biomass burning and coarse mode aerosols from dust storms observed from the ground and satellites is a well-known phenomenon (Prospero et al., 2002; Kaufman et al., 2005; Chand et al., 2008; Torres et al., 2012). Aerosols in the cloud-free scenario over dark surfaces are known to produce a net cooling effect (nega-tive radia(nega-tive forcing) on climate. In contrast, an overlap-ping situation of the absorbing aerosols over cloud can lead to a significant level of atmospheric absorption and thus exert a positive radiative forcing at the top of the atmo-sphere (TOA) (Keil and Haywood, 2003; Chand et al., 2009; Meyer et al., 2013; Feng and Christopher, 2015; Zhang et al., 2016). The magnitude of direct radiative effects of aerosols above cloud depends directly on the amount of aerosol load-ing, the microphysical–optical properties of the aerosol layer (Eswaran et al., 2015) and the underlying cloud deck (Meyer et al., 2013), geometric cloud fraction, and cloud optical depth (Chand et al., 2009), as well as the diurnal cycle of clouds (Min and Zhang, 2014). The resultant aerosol-driven atmospheric heating can have a significant influence on at-mospheric stability, cloud formation and lifetime, and the hydrological cycle (Wilcox, 2012; Lu et al., 2018). Differ-ent climate models treat aerosol–cloud interaction processes differently, which results in significant inter-model discrep-ancies in aerosol forcing assessments, especially over the absorbing aerosol–cloud overlap regions, i.e., the southeast-ern Atlantic Ocean and Southeast Asia (Schulz et al., 2006). To accurately quantify the direct and semi-direct effects of aerosols in cloudy skies, it is imperative that a measurement-based global database is made available to the community.
In the past decade, the development of several indepen-dent algorithms that quantify aerosol loading above cloud from satellite-based active, as well passive, sensors has been a breakthrough. These techniques have shown the poten-tial to retrieve above-cloud aerosol optical depth (ACAOD) using measurements from different A-train sensors (Jethva et al., 2014). The depolarization ratio (Hu et al., 2007) and color ratio methods (Chand et al., 2008) applied to the CALIPSO/CALIOP active lidar measurements of
two-way transmittance (Chand et al., 2008) directly provide ACAOD and the corresponding Ångström exponent. Wa-quet et al. (2009) make use of polarized radiances measured by PARASOL/POLDER to retrieve ACAOD. An operational version of this algorithm capable of retrieving ACAOD glob-ally has also been developed (Waquet et al., 2013). Taking advantage of enhanced aerosol absorption sensitivity in the near-UV, Torres et al. (2012) introduced a technique to re-trieve ACAOD and underlying aerosol-corrected cloud opti-cal depth (COD), simultaneously. Jethva et al. (2013) have extended the color ratio method to the visible and shortwave IR (SWIR) channel measurements of MODIS to deduce a pair of ACAOD and aerosol-corrected COD. Using an it-erative optimal estimation approach applied to the MODIS observations, Meyer et al. (2015) and Sayer et al. (2016) have developed multispectral algorithms to simultaneously retrieve ACAOD, COD, and cloud effective radius for scenes with absorbing aerosols over clouds.
Satellite-based passive and active sensors can observe the aerosols in the entire atmospheric column above the cloud deck. Conventional satellite retrievals have provided a global distribution of aerosols only over cloud-free regions, leaving the vast cloudy region unmonitored regarding the presence of aerosols. Likewise, field campaigns in the past mainly fo-cused on the measurement and characterization of aerosol properties in cloud-free conditions to evaluate and improve satellite-based retrievals as well as model simulations. The lack of a measurement-based aerosol database in the cloudy atmosphere severely limits our understanding of the aerosol’s effects on cloud radiative forcing and microphysical proper-ties.
Torres et al. (2012) introduced a remote sensing technique to simultaneously retrieve ACAOD and aerosol-corrected COD using the near-UV observations made by the Ozone Monitoring Instrument (OMI) onboard NASA’s Aura satel-lite. The method is physically established on an unambiguous “color ratio” effect produced by the absorbing aerosols above clouds in the two near-UV channels, i.e., 354 and 388 nm. Under a prescribed state of the atmosphere, the aerosol-led changes in the cloud radiances measured at the top of the atmosphere (TOA) relate to a pair of ACAOD and COD. The technique was successfully tested over the case studies of carbonaceous aerosols above the cloud deck found over the southeastern Atlantic Ocean. Furthermore, ACAOD de-rived using the near-UV color ratio method was found to be consistent when inter-compared against those inferred from other research-based algorithms applied to the different A-train sensors (MODIS, CALIOP, POLDER) (Jethva et al., 2014).
us-Figure 1.Simulation of UVAI (y axis) vs. reflectance at 388 nm (x axis) for the different pairs of ACAOD and COD (both at 388 nm) for the carbonaceous(a)and spheroidal shape dust aerosols(b). Values of ACAOD and COD depicted in the figure correspond to the 388 nm wavelength. The shown 2-D diagram forms the retrieval domain in which the observations from OMI are fitted and related to a pair of ACAOD and COD.
ing airborne HSRL-2 measurements are presented in Sect. 4. The results of the frequency of occurrence analysis of the aerosols above clouds are discussed in Sect. 5. A global 12-year long record of ACAOD and aerosol-corrected COD de-rived from OMACA,along with a quantitative analysis of the impact of aerosol absorption on COD retrievals, are pre-sented in Sect. 6. The paper is summarized and concluded in Sect. 7.
2 Description of the OMACA algorithm 2.1 Physical basis
Light absorbing aerosols such as carbonaceous aerosols (Kirchstetter et al., 2004) and dust particles (Wagner et al., 2012) exhibit strong wavelength dependence in absorption, particularly in the UV region of the spectrum. On the other hand, clouds show minimal to no spectral dependence in re-flectance when measured from the space. When absorbing aerosols overlay the cloud deck, the spectral contrast in the UV is further enhanced, producing a strong “color ratio” ef-fect in the two-channel TOA reflectance measurements (Tor-res et al., 2012). This effect is often referred to as “cloud darkening” caused by the aerosol-led spectral absorption. The UV aerosol index (UVAI) measured by OMI is an ex-cellent indicator of the presence of absorbing aerosols in the clear (Torres et al., 1998) as well as the cloudy atmosphere (Torres et al., 2012). Radiative transfer simulation shows that for a prescribed state of the atmosphere, the reduction in the spectral reflectance and UVAI between a pair of wavelengths depends on the optical depth of both aerosols and cloud, single-scattering albedo, and aerosol layer height. Founded on this unambiguous detection of absorbing aerosols above the cloud, Torres et al. (2012) introduced a technique that delivers the simultaneous retrieval of ACAOD and aerosol-corrected COD from OMI’s two near-UV observations (354
and 388 nm). Figure 1 shows the two-dimensional domain of simulated reflectance at 388 nm (x axis) and UVAI (y axis) for several pairs of ACAOD and COD for the carbona-ceous aerosols (left panel) and spheroidal dust particles (right panel). Under a prescribed set of assumptions, i.e., aerosol layer height (ALH), aerosol single-scattering albedo (SSA), surface albedo, and geometry, the two-channel measure-ments of OMI can be related to a pair of ACAOD and COD.
2.2 Inputs and ancillary datasets 2.2.1 Direct input
We use OMI Level-1b calibrated and geolocated radiance measurements at 354 and 388 nm as the primary input to the OMACA algorithm. First and foremost, the observed ra-diances are used to calculate the UVAI (Mie), as described by Torres et al. (2018), which is a residual quantity result-ing from the comparison between measured and calculated radiances between 354 and 388 nm. Compared to the pre-viously adopted Lambert equivalent reflector (LER) based method for calculating UVAI (Herman et al., 1997; Torres et al., 1998), the new approach offers a better characteriza-tion of clouds by accounting for the angular dependence of cloud reflectance (phase function) of liquid water clouds. 2.2.2 Ancillary datasets
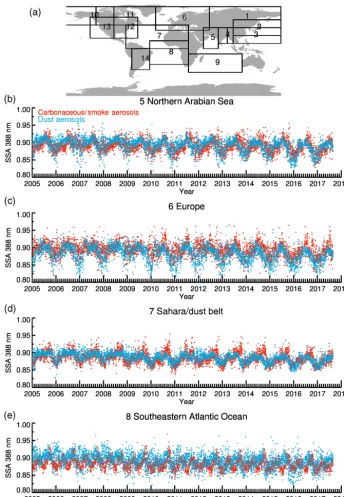
Figure 2. (a)Geographical boundaries of the 14 regions considered for calculating corresponding regional values of SSA (388 nm).(b– e)Regional mean UVAI weighted cloud-free SSA (388 nm) for carbonaceous and dust aerosols for the four selected regions (numbered 5, 6, 7, and 8 ina) derived using OMI/OMAERUV operational (version 1.8.9.1) L2 cloud-free SSA retrievals.
aerosols and desert dust. The aerosol type identification scheme adopts a threshold of 0.8 in UVAI to assign either smoke or dust aerosol type, which subsequently depends on the columnar amounts of CO retrieved by AIRS. Since the CO is a primary gaseous component of open-field biomass burning, it constitutes a reliable tracer of carbonaceous aerosol. For the Northern Hemisphere (NH), the threshold
thresh-Figure 3.A general flowchart of the OMACA algorithm.
old or when CO values larger than 2.8×10¹⁸ (2.5×10¹⁸) are observed in the NH (SH) regardless of UVAI considera-tions. Conversely, OMI pixels with observed UVAI≥UVAI threshold (0.8) and CO < CO threshold are assigned with the dust aerosol type. Threshold values in AI and CO represent noise and background levels in the respective measurements not necessarily associated with the free troposphere CO bur-den that is expected to coexist with the lofted carbonaceous aerosols. For the equatorial region bounded by the latitude range 10◦S to 10◦N, the aerosol type is determined based on a linearly interpolated value of CO threshold between NH and SH.
The straightforward way of discerning the absorbing aerosol type works efficiently in most cases; however, it may break down under certain situations, i.e., when dust aerosols are present over regions characterized by high CO levels as-sociated with pollution episodes other than the biomass burn-ing smoke for which the scheme would assign absorbburn-ing aerosol type as smoke. Note that the aerosol type identifica-tion scheme does not account for the mixture of aerosols for which either smoke or dust aerosol type is assigned depend-ing upon the threshold values of UVAI and CO. The reader is recommended to refer to Torres et al. (2013) for obtaining a detailed description of the scheme and its implementation within the OMAERUV algorithm.
Aerosol layer height and surface albedo
The representation of aerosol vertical profile relies on an averaged aerosol layer height (ALH) dataset derived us-ing the 30-month long combined and colocated measure-ments of CALIOP vertical backscatter and OMI UVAI (Tor-res et al., 2013). The aerosol profile is assumed to follow a quasi-Gaussian distribution around mean ALH given by the CALIOP-OMI dataset. For the surface characterization, we use a near-UV surface albedo database derived using the multiyear OMI LER observations. The method adopts a min-imum LER approach which ensures minimal or no contami-nation from the atmosphere, i.e., aerosols and clouds, in the measured reflectivity. Afterward, the minimum LER dataset derived from the OMI observations was scaled in the tempo-ral domain to the seasonality of surface albedo retrieved in the visible wavelengths from MODIS. The dataset contains surface albedo values at 354 and 388 nm at a grid resolution of 0.25◦×0.25◦. These two components of the OMACA al-gorithm, i.e., ALH and surface albedo, are identical to the ones adopted in the operational cloud-free OMI/OMAERUV two-channel algorithm (Torres et al., 2013).
Above-cloud aerosol single-scattering albedo
+0.03 (−0.03) in SSA yields about+48 % (−25 %) error in ACAOD for a reference AOD and COD of 0.5 and 5.0, respectively. The error in ACAOD follows an asymmetric behavior around the perturbed state and is a dynamic func-tion of both aerosol loading (AOD) and underlying cloud brightness (COD). The OMACA algorithm takes advantage of cloud-free standard OMAERUV global retrievals of SSA for characterizing the absorption capacity of aerosols above the cloud. OMI’s two-channel OMAERUV algorithm simul-taneously retrieves columnar total AOD and SSA at 388 nm in cloud-free conditions on a daily global scale (Torres et al., 2007, 2013). Both retrieved parameters have been eval-uated against the ground-based AERONET measurements globally (Ahn et al., 2014; Jethva et al., 2014). Jethva et al. (2014) have shown that for carbonaceous and dust aerosol types, which are relevant to the OMACA product, about 52 % (77 %) of OMI-AERONET matchups agree within the abso-lute difference of±0.03 (±0.05). Despite the inherent uncer-tainties in both inversions, a reasonable agreement between the two independent techniques globally, with a robust com-parison over many important sites affected by biomass burn-ing and dust, provided the increased confidence and credibil-ity of the OMAERUV aerosol product.
We have used the existing cloud-free OMAERUV SSA product to generate a daily database to prescribe SSA re-quired in OMACA. The world is split up into 14 regions, based on the patterns of absorbing aerosols above cloud in-ferred from the frequency of occurrence analysis (given in Sect. 5). Figure 2a shows the geographical boundaries of the selected regions. For each region and each day of OMI observation, the daily, region-specific value of above-cloud SSA was estimated for the carbonaceous and dust aerosol types separately using the respective cloud-free SSA retrieval weighted by the corresponding UVAI observations (> 0.8). Since the OMAERUV algorithm assigns a fixed aerosol type, i.e., smoke, dust, or background aerosol, to each valid cloud-free pixel of OMI, it is possible to estimate daily regional SSA value separately for smoke and dust aerosol types. In the case of missing daily regional SSA due to cloud cover or no OMI orbital data, the method relies on the availabil-ity of SSA values on nearby days with a sequential prefer-ence, i.e., weekly (±3 days excluding the day in considera-tion), monthly, or long-term climatology datasets. Observa-tions of aerosols above cloud found outside the boundaries of these 14 pre-selected regions are assigned a fixed SSA of 0.89 and 0.9 for the smoke and dust aerosol types, respec-tively. These values correspond to the aerosol model having a moderate level of absorption for both aerosol types (see Ap-pendix A). We emphasize here that though the OMACA is a global product, it was primarily designed to capture above-cloud aerosol events over major and some minor regions of the world where such situations are prevalent on monthly to seasonal scale.
Using ground-based AERONET inversion, Eck et al. (2013) showed that the absorption properties of the
smoke aerosols over central and southern Africa exhibit a seasonal trend where the monthly mean aerosol SSA (440 nm) increases from 0.84 in July to 0.93 in November. An analysis of the OMI-retrieved SSA (388 nm) in the same paper also showed a similar trend as that observed by AERONET and suggests that the seasonal change in SSA is widespread over much of southern Africa. The present approach of assigning the above-cloud aerosol SSA captures the daily variability of aerosol absorption for each region and thus eliminates the need to assume a time-invariant value of SSA for the retrievals of above-cloud aerosols.
Aerosol models
OMACA considers two major partially absorbing aerosol types, i.e., carbonaceous and dust aerosols. The microphysi-cal and optimicrophysi-cal properties of these aerosol types are adopted from the current operational OMAERUV aerosol models (Torres et al., 2013). Each aerosol type consists of seven distinct sub-models that differ in their imaginary part of the refractive index. The tables included in Appendix list the model properties of both types of aerosol models. Car-bonaceous aerosols are assumed as spherical particles with a wavelength-dependent imaginary refractive index in the near-UV region (relative spectral dependence of 20 %) that accounts for the presence of organics in the biomass burning generated aerosols (Kirchstetter et al., 2004; Jethva and Tor-res, 2011). Dust aerosols are considered spheroidal in shape with a fixed distribution of the spheroidal axis ratio adopted from Dubovik et al. (2006) and applied to the near UV ob-servations (Torres et al., 2018).
Look-up tables
LUTs were generated for carbonaceous and dust aerosol models. Each aerosol type consists of seven discrete aerosol SSA (388 nm) ranging from 0.75 to 1.00, for the 354 and 388 nm wavelengths for a total of seven node values in ACAOD, eight nodes in COD, at different geometries of solar zenith angle, viewing zenith angle, and relative az-imuth angle. The simulations were carried out for two sur-face pressure levels, for four different ALH referenced at re-spective surface pressure levels, and for five nodes in surface albedo. The node values for each variable are listed in Ap-pendix A. The LUT radiances interpolated at observed ge-ometry, pressure level, ALH, and SSA are matched with the OMI-observed radiance in 2-D retrieval domain (Fig. 1) to find a pair of ACAOD and COD at 388 nm. The retrieved val-ues at 388 nm are converted to 354 and 500 nm wavelengths following the spectral dependence of extinction associated with the assumed model in the retrieval process. Figure 3 il-lustrates a general flow diagram of the OMACA algorithm.
2.2.3 Identification of absorbing aerosols above clouds We adopt a bi-parametric approach to identify the presence of absorbing aerosols above the cloud. The Lambertian equiva-lent reflectivity or LER measured at a near-UV wavelength is proportional to the brightness of the scene. LER repre-sents the reflectivity of the scene when Rayleigh scattering is taken out from the TOA radiance measurements. On the other hand, UVAI is an excellent indicator of the presence of absorbing aerosols in both cloud-free and overcast skies (Tor-res et al., 2012) over all surfaces. Radiative transfer simula-tions show that while LER is directly proportional to COD, the layers of absorbing aerosols above cloud produces higher magnitudes of UVAI that depend on the above-cloud AOD, aerosol model, and cloud brightness (COD). Thus, higher values of LER and UVAI potentially represent scenes of ab-sorbing layers of aerosols over low-level cloud deck.
OMI offers a spatial resolution of 13×24 km2at its nadir, which intercepts an area of about 338 km2 on the ground for the VIS part of the instrument (Algorithm Theoreti-cal Document Basis, OMPIXCOR). The ground pixel size and associated area increase significantly at the extreme edge of the swath. A new global product called OMMYD-CLD, processed in-house, colocates the Aqua/MODIS 1 km cloud retrievals (MYD06) with each OMI pixel footprint (13×24 km2; Joanna Joiner and Brad Fisher, personal com-munication, 2016). OMMYDCLD reports statistics of many MODIS cloud parameters for each OMI footprint, such as the median COD, histogram of COD, cloud phase information, and many others. In addition to this, the OMMYDCLD also provides the total number of MODIS 1 km pixels (clear and cloudy) as well as the total number of cloudy pixels identi-fied at 1 km spatial resolution. The availability of these two parameters allows the calculation of geometric cloud frac-tion as observed by MODIS for each OMI pixel. Notice that the current OMACA product does not use the OMMYDCLD
product while making above-cloud aerosol retrieval. Instead, we use the information on the geometric cloud fraction de-rived from OMMYCLD in the post-retrieval analysis.
2.2.4 Algorithm quality flags
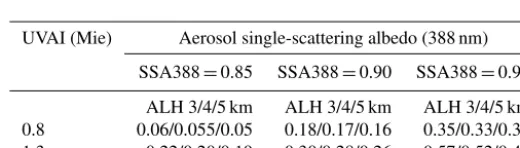
Each qualified OMI retrieval of the above-cloud aerosols is assigned with an appropriate algorithm quality flag. Table 1 describes the algorithm quality flags attached to each valid retrieval and their associated observed conditions. Retrievals with the quality flag equal to “0” are expected to be the best in quality as they are associated with the larger mag-nitudes of UVAI (> 1.3) and LER388 (> 0.25) with both pro-viding high confidence in the detection of absorbing aerosols above the cloud. An analysis using the OMMYCLD product over the southeastern Atlantic Ocean for the period of June– July–August 2007 revealed a well-constrained non-linear re-lationship between the MODIS-derived COD multiplied by the geometric cloud fraction, and LER388. A threshold for LER388 of 0.25, adopted for the best quality retrievals, com-pares to the COD times geometric cloud fraction of 3–4. Thus, given the geometric cloud fraction of unity the mini-mum COD retrieved by OMACA would be in the range 3–4. Lower magnitudes in both parameters might result in less confidence in the detection of either overcast pixels (0.20 < LER388 < 0.25, quality flag=1) or the presence of absorbing aerosols above cloud (0.8 < UVAI < 1.3, quality flag=2). Lower LER values (0.20–0.25) might pose a risk of identifying broken clouds in the OMI pixels, resulting in a geometric cloud fraction less than unity – a condition, under which the assumption of fully overcast pixels breaks down. Nevertheless, it is also possible that the increased aerosol loading (AOD > 2) with a significant absorption ca-pacity (SSA < 0.90) above the fully overcast pixels reduces LER measured at TOA (Fig. 6 of Jethva et al., 2013). On the other hand, the lower values of UVAI (0.8–1.3) associ-ated with the quality flag “2” may be relassoci-ated to the non-aerosol related artifacts resulting from the inherent uncertain-ties in the derivation of UVAI. The sources of uncertainuncertain-ties include spectral surface albedo, the unaccounted presence of ice clouds, and viewing geometry of the Sun and satellites. The magnitudes of UVAI depend on several aerosol param-eters including ACAOD, COD, SSA, ALH, and spectral de-pendence of aerosol absorption. Radiative transfer calcula-tions show that for a given value of SSA of 0.90 (388 nm) with an ALH of 3, 4, and 5 km, the UVAI value of 1.3 can be equated to the AOD (388 nm) of 0.30, 0.28, and 0.26, respec-tively. For a given SSA of 0.84, the values of AOD are 0.22, 0.20, and 0.19. The results of these simulations presented in Table 2 suggest that the minimum value of AOD retrieved us-ing the thresholds in UVAI depends on the actual condition of the scene.
Table 1.A description of the OMACA algorithm retrieval quality flags.
Algorithm quality flags Observation conditions Description
0 UVAI (Mie) > 1.3 and LER388 > 0.25 Best quality retrievals
1 1.3 < UVAI (Mie) < 4.3 and Less confidence in the detection of total overcast 0.20 < LER388 < 0.25 pixels (use of high-res sensors is recommended) 2 0.8 < UVAI (Mie) < 1.3 and LER > 0.25 Less confidence in the detection of
aerosols above cloud 3 Solar zenith angle > 55◦, scattering angle Geometry-related artifacts
< 100◦, and UVAI (Mie) < 2 (not recommended for use) Solar zenith angle > 60◦, scattering angle
< 130◦, and UVAI (Mie) < 2 Viewing zenith angle > 55◦,
scattering angle < 100◦, and UVAI (Mie) < 2
4 Snow/ice contamination No retrieval 5 Solar zenith angle above threshold (70◦) No retrieval 7 Terrain pressure below threshold (800 hPa) No retrieval 8 Cross-track anomaly No retrieval
Table 2.Theoretical simulations of the retrieved ACAOD for two discrete values of UVAI under different combinations of SSA and ALH assumptions. Threshold values of 0.8 and 1.3 in UVAI correspond to the algorithm quality flags of “0” (best) and “2” (less confidence).
UVAI (Mie) Aerosol single-scattering albedo (388 nm) SSA388=0.85 SSA388=0.90 SSA388=0.94
ALH 3/4/5 km ALH 3/4/5 km ALH 3/4/5 km 0.8 0.06/0.055/0.05 0.18/0.17/0.16 0.35/0.33/0.30 1.3 0.22/0.20/0.19 0.30/0.28/0.26 0.57/0.52/0.49
(up to 2.0) at certain extreme geometries. However, if the observed UVAI exceeds a value of 2.0, then the retrievals are assigned with the quality flag “0”, “1”, or “2” depend-ing upon the observed LER and UVAI. The OMACA algo-rithm operates over both ocean and land pixels with terrain pressure greater than 800 hPa, which encompasses the ma-jority of the regions of frequent aerosol–cloud overlap (see Sect. 5). Retrievals over oceanic cloud pixels are performed at all Sun glint angles if measured LER exceeds 0.30; for the 0.20 < LER < 0.30 condition retrievals are performed with pixels having Sun glint angle > 20◦to avoid glint-related ar-tifacts in the retrievals.
3 Uncertainty estimates
The OMACA algorithm relies on the presumptions about the atmosphere and surface properties. Therefore, it is impera-tive to estimate the sensitivity of the OMACA retrievals to the departure of the actual state of the atmosphere from the one assumed in the inversion. Earlier, Torres et al. (2012) described the theoretical uncertainties in the near-UV based
retrieval of ACAOD and aerosol-corrected COD. However, the analysis was confined to a narrow range of input condi-tions. Here, we reperform the same exercise by considering an extended range of perturbation in each assumed parame-ter.
The approach to calculating the uncertainties in the OMACA retrievals follows a perturbation-based method. The errors were calculated by contrasting the retrievals de-rived assuming a reference state and perturbed state of a par-ticular input parameter. For example, given a fixed set of aerosol size distribution, ALH, and surface albedo, OMACA retrievals are derived assuming a range of aerosol SSA. The retrievals are then compared with those derived considering a reference value of SSA, which is the center value of the prescribed range. The errors in the retrievals then can be cal-culated given both underestimated and overestimated values of an assumed parameter.
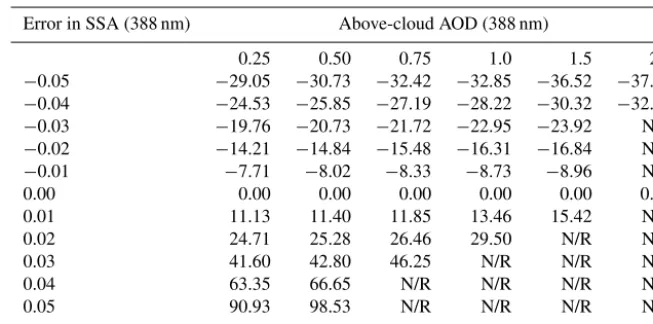
calcu-Table 3.Theoretical error (%) in ACAOD (388 nm) due to the uncertainty in the assumption of SSA at 388 nm. The reference value of SSA (388 nm) assumed in the calculation was 0.89; the error in SSA (leftmost column) represents perturbation from the reference value. The cloud optical depth underneath the aerosol layer was assumed to be 10.
Error in SSA (388 nm) Above-cloud AOD (388 nm)
0.25 0.50 0.75 1.0 1.5 2.0
−0.05 −29.05 −30.73 −32.42 −32.85 −36.52 −37.55
−0.04 −24.53 −25.85 −27.19 −28.22 −30.32 −32.51
−0.03 −19.76 −20.73 −21.72 −22.95 −23.92 N/R
−0.02 −14.21 −14.84 −15.48 −16.31 −16.84 N/R
−0.01 −7.71 −8.02 −8.33 −8.73 −8.96 N/R
0.00 0.00 0.00 0.00 0.00 0.00 0.00 0.01 11.13 11.40 11.85 13.46 15.42 N/R 0.02 24.71 25.28 26.46 29.50 N/R N/R 0.03 41.60 42.80 46.25 N/R N/R N/R 0.04 63.35 66.65 N/R N/R N/R N/R 0.05 90.93 98.53 N/R N/R N/R N/R
N/R: not retrieved.
Table 4.Theoretical error (%) in ACAOD (388 nm) due to the uncertainty in the assumption of aerosol layer height (ALH). The reference value of ALH assumed in the calculation was 4.0 km; the error in ALH (leftmost column) represents perturbation from the reference value. The cloud optical depth underneath the aerosol layer was assumed to be 10.
Error in ALH (km) Above-cloud AOD (388 nm)
0.25 0.50 0.75 1.0 1.5 2.0
−1.0 7.74 9.45 11.40 14.93 20.78 N/R
−0.5 3.43 4.24 5.17 6.83 9.91 N/R
0.0 0.00 0.00 0.00 0.00 0.00 0.00 0.5 −2.45 −3.02 −3.59 −4.14 −4.83 N/R 1.0 −4.56 −5.68 −6.80 −7.94 −9.77 −12.81
N/R: not retrieved.
lated for a range of uncertain SSA, i.e., −0.05 (underesti-mation) to 0.05 (overesti(underesti-mation) in step of 0.01. The opti-cal depth of cloud underneath the aerosol layer was assumed to be 10. The errors in ACAOD are found to behave non-linearly to the perturbations in the assumed SSA. It also de-pends on the true value of ACAOD. Furthermore, the er-ror conforms to an asymmetric behavior around the refer-ence value of SSA; larger magnitudes of error are associated with the overestimated SSAs, whereas relatively lower errors are obtained when SSA was underestimated. The selection of above-cloud SSA values in actual OMACA retrievals re-lies on a daily, regional database of cloud-free SSA values retrieved from the standard OMAERUV aerosol product, as described in Sect. 2.2.2.3. Therefore, the accurateness of as-signed above-cloud SSA depends on the accuracy of cloud-free OMAERUV SSA retrievals as well as on the validity of the assumption that aerosol absorption properties are invari-ant between cloud-free and above-cloud aerosols scenes.
Earlier, an intercomparison analysis of OMI-AERONET SSA retrievals, based on the previous public version of the OMAERUV product, from over 269 AERONET sites
dis-tributed globally, showed an agreement within ±0.03 and ±0.05 limits for about 51 % and 76 % of total 5463 col-located matchups, respectively (Jethva et al., 2014). When segregated by the range of AOD (440 nm) and UVAI, 49 % (AOD < 0.7, UVAI < 1.0) and 53 % (AOD > 0.7, UVAI > 1.0) of the total OMAERUV-AERONET SSA (440 nm) retrievals are found to agree within their estimated uncertainties of ±0.03. The agreement improved to 74 % and 79 %, respec-tively, when the uncertainty limit was relaxed up to±0.05. The statistical comparison was found to be even better when the matchups were segregated by the aerosol type, i.e., only smoke or dust, over many long-term sites located in the biomass burning and dust dominated regions.
Table 5.Theoretical error (%) in ACAOD (388 nm) due to the uncertainty in the assumption of aerosol absorption Ångström exponent (AAE). The reference value of AAE (354–388 nm) assumed in the calculation was 2.65; the error in AAE (leftmost column) represents perturbation from this reference value. The cloud optical depth underneath the aerosol layer was assumed to be 10. Simulations marked with N/R (not retrieved) represent the retrieval failure due to the out-of-domain issue.
Error in AAE (354–388 nm) Above-cloud AOD (388 nm)
0.25 0.50 0.75 1.0 1.5 2.0
−1.5 83.17 96.36 102.80 N/R N/R N/R
−1.0 48.42 54.12 58.50 N/R N/R N/R
−0.5 20.80 22.14 24.38 26.60 N/R N/R 0.0 0.00 0.00 0.00 0.00 0.00 0.00 0.5 −11.67 −12.33 −12.84 −13.40 −13.54 −14.50 1.0 −21.69 −22.96 −24.00 −24.69 −25.65 −27.69 1.5 −30.69 −32.54 −34.12 −34.68 −36.89 −40.09
Table 6.Theoretical error (%) in aerosol-corrected COD (388 nm) due to the uncertainty in the assumption of aerosol SSA and layer height (ALH).
Error in SSA (388 nm) % Error in cloud optical depth (388 nm) (AOD=0.5/AOD=1.0)
COD=5 COD=10 COD=20 COD=30
−0.05 5.65/10.18 2.48/3.01 0.27/−1.19 −0.41/−2.67
−0.03 3.90/6.94 1.69/1.81 0.15/−0.88 −0.33/−1.96 0.03 −6.57/−4.5 −1.48/−1.29 0.68/4.76 1.97/8.03 0.05 −17.81/0.1 −3.74/3.50 1.21/10.40 3.94/17.48 Error in ALH (km) % Error in cloud optical depth (388 nm)
(AOD=0.5/AOD=1.0)
COD=5 COD=10 COD=20 COD=30
−1 1.26/4.57 2.83/9.23 3.07/10.48 3.16/11.32
+1 −0.65/−2.19 −1.14/−3.48 −1.23/−3.95 −1.51/−5.03
in the OMACA product has been derived from the latest ver-sion of the OMAERUV (verver-sion 1.8.9.1) product, released in 2017. A new comparative analysis of OMI-AERONET SSAs over global AERONET locations demonstrated that the agreement between the two independent sets of retrievals im-proved significantly for scenes identified as smoke and dust aerosol type. Quantitatively, about 59 % (83 %), 65 % (88 %), and 72 % (91 %) of the matchups are found to be within the expected limits of ±0.03 (±0.05) difference given the ob-served range of UVAI > 0.8, > 1.5, and > 2.0, respectively. Use of the UVAI-weighted scheme to estimate the daily re-gional value of SSA precisely reflects the fact that the agree-ment between OMI and AERONET SSA improves at higher aerosol loading and absorption providing increased confi-dence in the satellite retrievals. The remaining uncertainty in the assumed SSA of +0.03 (−0.03) leads to an error in the retrieved ACAOD by+42 % to+46 % (−20 % to −25 %), as shown in Table 3. The estimated errors could be much larger (90 %–100 %) given the larger uncertainty (±0.05) in the assumed SSA.
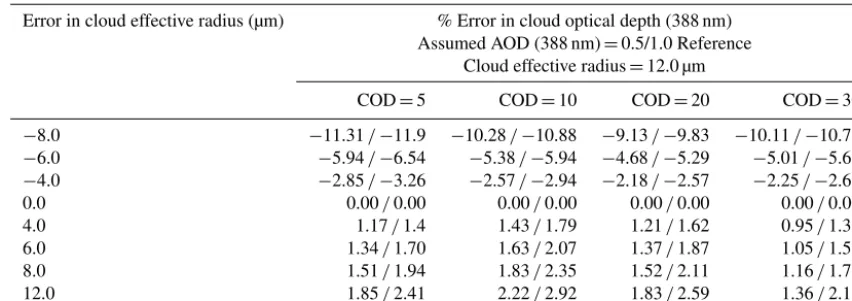
Table 7.Theoretical error (%) in aerosol-corrected COD (388 nm) due to the uncertainty in the assumption of cloud effective radius.
Error in cloud effective radius (µm) % Error in cloud optical depth (388 nm) Assumed AOD (388 nm)=0.5/1.0 Reference
Cloud effective radius=12.0 µm
COD=5 COD=10 COD=20 COD=30
−8.0 −11.31/−11.9 −10.28/−10.88 −9.13/−9.83 −10.11/−10.76
−6.0 −5.94/−6.54 −5.38/−5.94 −4.68/−5.29 −5.01/−5.62
−4.0 −2.85/−3.26 −2.57/−2.94 −2.18/−2.57 −2.25/−2.66
0.0 0.00/0.00 0.00/0.00 0.00/0.00 0.00/0.00 4.0 1.17/1.4 1.43/1.79 1.21/1.62 0.95/1.39 6.0 1.34/1.70 1.63/2.07 1.37/1.87 1.05/1.59 8.0 1.51/1.94 1.83/2.35 1.52/2.11 1.16/1.78 12.0 1.85/2.41 2.22/2.92 1.83/2.59 1.36/2.18
the hotspot regions of above-cloud aerosols. The expected uncertainty in the derived ALH dataset is about ±1 km for which the error in ACAOD could vary between −5 % to −13 % and+8 % to+21 % for an overestimated and under-estimated ALH by+1 km and−1 km, respectively.
The OMACA 2-D retrieval domain shown in Fig. 1 sug-gests that the magnitudes of UVAI primarily modulate the retrieved value of ACAOD. Several parameters including ACAOD, COD, ALH, SSA, and AAE can influence the mag-nitudes of UVAI. For instance, given a fixed set of spec-tral AODs at 354 and 388 nm wavelengths, ALH, and SSA at 388 nm, the magnitude of derived UVAI strongly varies with the assumed value of AAE (Fig. 4 of Jethva and Tor-res, 2011). In other words, for a given value of observed UVAI, different assumptions of AAE would result in differ-ent values of the retrieved AOD. The “smoke” and “dust” aerosol models adopted in the OMACA algorithm assume an invariant spectral dependence of the imaginary part of the refractive index. For the carbonaceous and dust aerosol mod-els, the relative spectral dependence in the imaginary index is assumed to be 20 % (Kirchstetter et al., 2004; Jethva and Torres, 2011) and 39 %, respectively, between the 354 and 388 nm wavelengths, at which the imaginary index at 354 nm is higher than that at 388 nm. For a fixed set of size distri-bution parameters and range of SSA (388 nm), this results in AAE in the range 2.5–3.0 for the carbonaceous aerosol models, and 2.0–4.0 for the dust models (see Appendix A). Theoretical error (%) in ACAOD (388 nm) due to the uncer-tainty in the assumption of aerosol AAE (354–388 nm range) is listed in Table 5. The reference value of AAE was assumed to be 2.65 corresponding to the moderately absorbing smoke model, and COD underneath the aerosol layer was assumed to be 10. AAE was perturbed in steps of 0.5 in both direc-tions from the reference value. Similar to the uncertain SSA simulations, errors in ACAOD behave asymmetrically to the perturbations in AAE with larger (relatively lower) magni-tudes of errors are associated with the underestimated (over-estimated) AAE.
ab-sorption effects dominate over that produced by varying ef-fective radius of liquid droplets leaving other major algorith-mic assumptions, i.e., SSA, ALH, and AAE to determine the resultant uncertainty in ACAOD retrievals. The analysis im-plies that near-UV wavelengths do not offer a strong sensi-tivity to the variations in cloud droplet size rather the cloud signal is predominantly driven by the optical depth of the cloud layer. Due to the lack of information on cloud droplet size from OMI, we adopted the standard C1 cloud model val-idated and used in numerous studies for all cloud LUT cal-culations.
The sensitivity of ACAOD and aerosol-corrected retrievals to the uncertainty in three major assumptions made in OMACA considered a broad range of perturbation. However, we anticipate that the prescribed values of SSA, ALH, and AAE are accurate to within±0.03,±1 km, and±0.5, respec-tively, for which the errors in ACAOD can vary from−23 % to+46 % in the ACAOD range 0.25-1.0. The corresponding errors in aerosol-corrected COD are found to be significantly lower and in the range −5 % to +11 %. In situations when the uncertainty in the assumed inputs leads to errors of op-posite sign, the resulting error in the retrievals is likely to be lower than expected due to the cancellation of individual er-rors. On the other hand, an agglomeration of the errors of the same sign can further amplify the overall uncertainty in the retrievals. Nevertheless, it is practically hard to arrive at the actual uncertainty in the OMACA retrieval for every pixel due to the ill-posed nature of the inversion problem. Evalu-ating the accuracy of the satellite retrievals requires an inde-pendent set of direct measurements of aerosols, in this case above the cloud, discussed in the following section.
4 Preliminary validation
Unlike the validation exercise of satellite-based aerosol re-trievals in cloud-free skies, for which the ground-based di-rect measurements of AOD are amply available from hun-dreds of sites worldwide, such an assessment of ACAOD retrieved from the satellite is a challenging task due to the lack of reference aerosol measurements above the clouds. This is because the field campaigns in the past mainly fo-cused on the measurements and characterization of aerosol properties in cloud-free conditions leaving vast cloudy ar-eas unmonitored regarding the aerosol mar-easurements. How-ever, the airborne lidar such as high spectral resolution li-dar (HSRL) when flying above the top of the aerosol layer can make direct measurements of aerosol extinction and thus provides AOD above the cloud. Also, airborne sunpho-tometers can make such measurements by flying above the cloud and below the aerosol layer. Using a limited dataset of the direct measurements of AOD above the cloud carried out by the NASA Ames Airborne Tracking Sunphotome-ter (AATS) and Sky-Scanning, Sun-Tracking Atmospheric Research (4STAR) sensors during different field campaigns,
Jethva et al. (2016) have validated ACAOD retrieved using the “color ratio” method (Jethva et al., 2013), similar to the one presented here, but applied to the TOA visible-near in-frared reflectances measured by the MODIS.
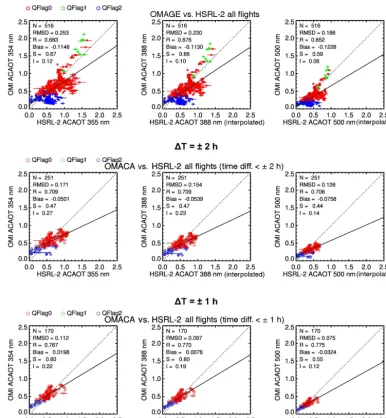
NASA’s ORACLES (observations of aerosols above clouds and their interactions) (https://espo.nasa.gov/oracles, last access: 15 October 2018) is an ongoing multi-year field experiment supported by the NASA Earth-Venture Subor-bital Program. ORACLES intended to make accurate air-borne remote sensing and in situ measurements of aerosols and clouds in the southeastern Atlantic Ocean. At the time writing this paper (2018), ORACLES has already completed the two phases of its operation, 1st phase conducted in August–September 2016 and the 2nd phase in August 2017. During the 1st phase, HSRL-2 lidar developed by the NASA Langley Research Center made extensive measurements of smoke aerosols, including detailed vertical measurements of aerosol backscatter, extinction, and AOD at 355 and 532 nm, above shallow marine clouds, while deployed from NASA ER-2 aircraft. HSRL-2 measurements of AOD are routinely compared with that of AERONET and found to agree well (R=0.98) with the latter. Taking advantage of highly accu-rate and valuable dataset of AOD above the cloud, we eval-uate the ACAOD retrievals from OMACA for the cases of coincident and collocated OMI-HSRL2 measurements.
Figure 4.Comparison of coincident and collocated spectral ACAODs measured and retrieved from HSRL-2 and OMI/OMACA for a total of seven ER-2 flights operated during ORACLES phase I operation over the southeastern Atlantic Ocean in August–September 2016.1T
represents the absolute time difference (in hours) between the OMI overpass and HSRL-2 measurements.
Noticeably, the OMI-HSRL2 comparison of ACAOD pro-vides the best agreement at the 500 nm wavelength, where the OMACA does not perform inversion but reports ACAOD based on the spectral dependence of extinction assumed in the aerosol model.
The remaining discrepancies in the comparison could be primarily attributed to the inherent uncertainties associated with both types of measurements, particularly in the satel-lite retrievals of ACAOD as discussed in the previous sec-tion, and spatiotemporal heterogeneity in aerosol fields un-resolved by the collocation method. Despite these uncertain-ties, a reasonable agreement of OMACA-retrieved ACAOD
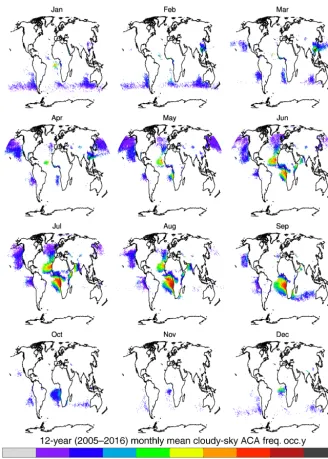
Figure 5.The monthly mean distribution of cloudy-sky frequency of occurrence of above-cloud absorbing aerosols deduced from the 12-year record (2005–2016) of OMI’s near-UV observations.
5 The frequency of occurrence of absorbing aerosols above clouds
5.1 Spatial distribution
The regional and global climate impact of absorbing aerosols above cloud depends on the total aerosol loading above the cloud, the microphysical and optical properties of aerosols and underlying cloud deck, as well as the spatial and tem-poral extent of the aerosol–cloud overlap scenes. We have carried out a global frequency of occurrence of absorbing aerosols above the cloud (FOACA) to identify the regions
the same atmospheric column and not to quantitatively re-trieve ACAOD, a less strict value cloud fraction should ade-quately represent both aerosols and clouds in the correspond-ing pixel.
Figure 5 shows the monthly averages of FOACA derived from the 12-year record (2005–2016) of OMI following the above-described method. This analysis reveals several im-portant regions of the world where the overlap of absorbing aerosols over clouds are frequently observed. During July through September, carbonaceous aerosols generated from agricultural burning over the central and southern Africa are mobilized over the semi-permanent low-level stratocumulus water clouds in the southeastern Atlantic Ocean (Torres et al., 2012; Alfaro-Contreras et al., 2016; Meyer et al., 2015). With more than 80 % of the cloudy-sky observations identi-fied as aerosols above cloud during the Northern Hemisphere summer, the southeastern Atlantic Ocean is considered to be one of the prime study regions the world and also a natural laboratory to study the aerosols above cloud phenomenon. The springtime biomass burning activities such as burning of forest, savanna/grassland, and crop residue over South-east Asia (SEA) countries, including Thailand, Myanmar, Laos, Cambodia, and Vietnam release significant amounts of trace gases and carbonaceous aerosols into the atmosphere (Elvidge and Baugh, 1996; Streets et al., 2003). Natural color images from the satellite show that smoke particles emitted from these activities were mobilized under the influence of winds over the widespread cloud deck over southern China, creating the appearance of the darker cloud deck. FOACA results show that about 20 %–40 % of the cloudy days are marked with smoke aerosols overlying bright cloud deck. Additionally, the smoke–cloud overlap seen in the OMI data is not merely confined to over land, but also extended over the western Pacific Ocean, albeit less often.
Dust storms originated over the Sahara Desert in northern Africa during the summer are often transported across the tropical Atlantic Ocean (Prospero et al., 2002; Kaufman et al., 2005; Huang et al., 2010; Yu et al., 2015). A substantial part of the dust transport occurs over the low-level stratocu-mulus clouds. The FOACA analysis shows that the presence of mineral dust aerosols above the cloud accounts for 40 %– 80 % of the total cloudy-sky OMI observations. Similarly, mineral dust particles originated from the Arabian Penin-sula, Iran and Pakistan often mobilized over the Arabian Sea during the active months (July–August) of the southwest In-dian summer monsoon (Moorthy et al., 2005; Satheesh et al., 2006). The transported dust frequently overlies the low-level clouds such that the dust-cloud overlap accounts for the 40 %–60 % of the cloud-sky days.
The springtime Asian outflow of air pollutants, both an-thropogenic and mineral dust, across the Pacific Ocean is documented in various studies (Liu et al., 2003; Huebert et al., 2003). The FOACA maps for the April and May months revealing the transport pattern encompasses the entire north-ern Pacific basin from the eastnorth-ern coast of Asia to the
west-ern coast of North America with 10 %–30 % of the cloudy-sky scenes identified as aerosols over the clouds. One of the salient features of the FOACA analysis is the smoke trans-port from southern Africa to the Indian Ocean. Carbonaceous aerosols emitted from the fires in southeastern Africa dur-ing the late biomass burndur-ing season (September) are often taken away from the continent along the eastward flow and advected above the clouds over the southern Indian Ocean (Sinha et al., 2004). The FOACA map for the month of September highlights that the transport of smoke over the cloud is confined to within the latitude range 35 to 20◦S with 40 %–50 % (20 %–30 %) cloudy scenes marked by the smoke overlaying clouds just off the coast of southeastern Africa (over the western coast of Australia).
Prior to our study, Devsthale and Thomas (2011) and Zhang et al. (2016) have studied the cloud-sky FOACA over the global ocean using 4 years and 8 years of CALIOP ob-servations, respectively. The results presented in these papers are largely consistent with the ones derived from OMI ob-servations over oceanic regions that are influenced by long-range transport of smoke and dust aerosols from continents as described above.
5.2 Long-term trends in FOACA
Since mid-2007, OMI observations have been affected by a possible external obstruction that perturbs both the mea-sured solar flux and Earth radiance. This obstruction affect-ing the quality of radiance at all wavelengths for a particu-lar viewing direction is referred to as “row anomaly” since the viewing geometry is associated with the row numbers on the charge-coupled device detectors. The row anomaly issue was detected for the first time in mid-2007 for a few rows, which over the period of operation expanded to other rows in 2008 and later. Figure 6a shows the current status of the row anomaly as identified by the anomaly algorithm developed for the NASA OMI total ozone product OMTO3 (Schenkeveld et al., 2017). At present, about half of the to-tal 60 rows across the track are identified and flagged as row anomaly affected positions for which no physical retrievals are being performed.
Figure 6. (a)Chart showing the time evolution of OMI row anomaly and(b)cloudy-sky (LER388 > 0.25) UVAI.(c)Monthly time series of the global, cloudy-sky frequency of occurrence (in percentages with respect to the total cloudy-sky observations) of absorbing aerosols above cloud derived using OMI full scan (Rows 1 to 60) (blue) and anomaly-free observations (Rows 1 to 23) (red). Solid lines represent the linear regression fits to the respective time-series data.
where the UVAI values are larger than those on the right side of the scan, introduces a positive shift in the absolute val-ues of UVAI, which leads to an overall positive trend in the FOACA. Therefore, the global trend (%) in FOACA calcu-lated using all rows of OMI gives a positive trend (0.178 per year) as shown in the bottom panel of Fig. 6c. However, when the global trend is calculated using observations from rows which are mostly free of row anomaly throughout the OMI
recom-Figure 7.Monthly time series of the regional cloudy-sky frequency of occurrence (in percentages with respect to the total cloudy-sky observations) of absorbing aerosols above cloud derived using OMI anomaly-free observations (Rows 1 to 23). Solid lines represent the linear fit to the respective time-series data.
mend the users of the OMACA product to use only those ob-servations that are free of row anomaly throughout the OMI operation (2004 to present) for the trend related analysis.
6 Results from 12-year long OMACA record 6.1 Global distribution of above-cloud AOD
Figure 8 shows the global distribution of ACAOD (388 nm) derived from OMACA algorithm applied to the 12-year long record of OMI observations. The OMACA Level 2 retrievals with algorithm quality flag “0”, “1”, and “2” were averaged on every 0.5◦×0.5◦spatial grid to derive a global monthly gridded dataset. Also, a threshold of 0.75 in the geometric cloud fraction, calculated using the OMMYDCLD product, was used to filter out the L2 pixels with broken cloud fields. Only those grids are considered in the long-term monthly av-erages for which (1) the total number of days with valid re-trievals for a particular month is greater than 3, and (2) num-ber of years greater than 3 out of the 12-year record. The
dis-tribution plot reveals moderate to high aerosol loading above the clouds over several regions of the world.
During the Northern Hemisphere summer, larger magni-tudes of ACAOD (> 0.7) are retrieved over the southeast-ern Atlantic Ocean along the coast of Namibia and Angola. Noticeably, the area coverage of ACAOD expands substan-tially as the season progresses with retrieval coverage con-fined to within 1500 km from the western coast of Africa in June to encompassing almost the entire Atlantic Ocean basin (∼5000 km) in September. The largest magnitudes of ACAOD are observed in August and September when biomass burning activities also peak in the central and south-ern Africa. In March and April, biomass burning in Southeast Asia emits large amounts of carbonaceous aerosols, which under the influence of winds are transported above the bright cloud deck over southern China, where OMACA retrieves large values of ACAOD (> 0.8) in the vicinity of burning ar-eas. Noticeably, the area-coverage of aerosol–cloud overlap extends far from the source burning region to over the East China Sea, albeit with a decreasing gradient in the retrieved ACAOD. During the late biomass burning season (Septem-ber), carbonaceous aerosols emitted from the fires in south-eastern Africa often drift away from the continent along the eastward flow (Garstang et al., 1996), and advected above the clouds over the southern Indian Ocean. The spatial pattern of retrieved ACAOD encompasses the entire Indian ocean basin stretching from the southeastern coast of Africa with ACAOD in the range 0.4–0.5 to the western coast of Aus-tralia with reduced ACAOD in the range 0.2–0.3.
During the Northern Hemisphere summer months, ACAOD in the range 0.3–0.5 is observed over the tropical Atlantic Ocean where the transport of dust takes place from the Saharan desert to over the oceanic clouds. The area cover-age of the retrievals is at its maximum in July, spanning half of the tropical Atlantic Ocean basin with maximum ACAOD (∼0.5) just off the coast of northern Africa. Also, a gradi-ent in ACAOD is noted over the northern Arabian Sea during summer, owing to the dust transport from the Arabian region to over the low-level clouds over the ocean.
The OMACA product also captures springtime (April and May), long-range trans-Pacific transport of dust aerosols originated over the Gobi and Taklamakan Deserts possibly mixed with urban pollution and smoke along the transport pathways and over the clouds. The magnitude of retrieved ACAOD of the above-cloud Asian outflow ranges from 0.4 to 0.5 near the eastern coast of northeastern Asia, reducing to 0.2–0.3 along the transport over the mid-Pacific and up to the western coast of North America.
6.2 Regional time series of above-cloud AOD
Figure 8.Global distribution of monthly mean above-cloud AOD (388 nm) deduced from the 12-year (2005–2016) OMI observations.
mean ACAODs were calculated in the following way. For each region and month, an averaged value of ACAOD was calculated, and a number of Level 2 observations that went into the averaging was also stored. Subsequently, a set of 12-monthly averaged values scaled by multiplying them with a fraction that is defined as the ratio Level 2 observations for the individual months to the maximum number of Level 2 observations found over the 12-year period (2005–2016) over the same region. Scaling the monthly averaged value with the calculated fraction ensures the representativeness of ACAOD statistics over the spatial and temporal domains and thus facilitates the intercomparison. For instance, a compar-ison of the two averaged values derived from two different
set of statistics, i.e., under-populated and adequately popu-lated, likely results in the misinterpretation of monthly time-series data. The procedure described above was applied to the OMACA observations for the five prominent aerosol–cloud overlap regions to produce the time series shown in Fig. 9.
val-Figure 9.Time series of regional monthly mean above-cloud AOD at 388 nm (left y axis, color: red) and the ratio of above-cloud AOD and cloud-free AOD (right y axis, color: blue), both at 388 nm, de-rived using the OMACA and OMAERUV products, respectively.
ues fall in the range 0.2–0.3 during summer months when dust aerosols from northern Africa are mobilized over the low-level oceanic stratocumulus clouds. The inter-annual variations of ACAOD over the Arabian Sea are found to be significant with the monthly value of 0.4 during the first 2 years of the record (July and Aug of 2005 and 2006) fol-lowed by a drastic reduction in the aerosol loading above the cloud during the middle part of the record. The springtime biomass burning and resulting smoke aerosols above cloud over Southeast Asia (4th panel) is evident in the time series where the peak values of monthly ACAOD vary from 0.2 to 0.5 depending on the year.
It is important to quantify the fraction of the total columnar aerosol loading, situated above the cloud, for several applica-tions. For instance, the cloud-free aerosol retrieval represents the aerosol in the entire vertical column while avoiding the cloudy-sky scenes. Therefore, the statistics of cloud-free re-trievals over the regions with frequent aerosol–cloud overlap becomes restrictive, leading to partially incomplete represen-tation of aerosol properties on a regional and temporal scales.
Figure 10.Time series of regional, monthly mean aerosol-corrected (left y axis, color: red) COD (388 nm) derived using a 12-year long OMACA record. The y axis on the right side (color: blue) depicts a time series of the % difference between simultaneous retrievals of apparent/non-corrected and aerosol-corrected COD for the same period and regions. Only anomaly-free observations of OMI (Rows 1 to 23) were used in the calculations.
Figure 11.Percent difference in COD (aerosol-corrected minus non-corrected) as a function of above-cloud absorption AOD (388 nm) for the smoke(a)and dust(b)dominated regions. Different color codes represent the relationship for a discrete range of aerosol-corrected COD.
6.3 Regional time series of aerosol-corrected cloud optical depth
Figure 10 displays the monthly mean evolution of aerosol-corrected COD (left y axis, color: red) for the five prominent regions of aerosol–cloud overlap. The monthly mean values were calculated following the procedure described in the pre-vious section. The seasonal cycle of COD over the south-eastern Atlantic Ocean exhibits repetitive behavior with the maximum value of COD reaching up to 8.0 during the peak burning period. On the other hand, the monthly cycle of COD over the tropical Atlantic Ocean (Arabian Sea) during the same season shows more considerable interannual variations with COD in the range 6 to 14 (4 to 10). The magnitudes of aerosol-corrected COD over Southeast Asia during the springtime biomass burning season (March–April) are found to be the largest among five regions considered here with val-ues ranging between 16 and 20 except for the years 2008 and 2013 when COD was less than 12.
The right-side y axis of Fig. 10 (color: blue) depicts the concurrent monthly time series of the percent difference be-tween apparent (non-corrected) and aerosol-corrected CODs the magnitudes of which represent the error in the retrieval of COD at 388-nm wavelength with reference to the cor-rected COD if the presence of aerosols is ignored in the in-version. Note that only those COD retrievals are considered here for which the absorbing aerosols are identified above the clouds. While there is a significant variation in the mag-nitudes of the percentage difference between the two CODs over different regions, generally larger errors are associated with the higher aerosol-corrected COD and ACAODs (shown in Fig. 9). More discussion on the impact of aerosol absorp-tion on cloud retrievals is presented in the next secabsorp-tion.
6.4 Impact of aerosol absorption on cloud retrievals
The presence of absorbing aerosols above cloud obstructs the light reflected by the cloud top, and thus reduces cloud-reflected upwelling UV (Torres et al., 2012), VIS, and NIR radiation (Jethva et al., 2013; Meyer et al., 2015) reaching the TOA. Therefore, cloud retrievals of COD derived from passive sensors such as OMI are expected to be biased low if absorbing aerosols are not accounted for in the inversion. The OMACA product reports two sets of COD, one corrected for the presence of absorbing aerosols overlying cloud deck, and one retrieved assuming no aerosols above the cloud, which is termed as the apparent COD. The magnitudes of bias in the apparent COD depend on the strength of aerosol absorption and backscattering, as well as on the actual value of COD. Note that OMACA does not directly retrieve the aerosol ab-sorption optical depth (AAOD) but retrieves ACAOD as-suming an a priori value of SSA (see Sect. 2.2.2.3). There-fore, the AAOD can be readily calculated using these two pieces of information as AAOD=ACAOD·(1−SSA). Fig-ure 11 shows the percent bias in COD (388 nm), defined as (apparent COD – aerosol-corrected COD)/aerosol-corrected COD·100, as a function of concurrent AAOD (388 nm). The percent bias was calculated for the distinct range of aerosol-corrected COD and the two aerosol types, i.e., smoke (Fig. 11a) and dust (Fig. 11b). All OMACA Level 2 orbital data (2005–2016) for the respective regions and the two aerosol types were accumulated separately and subsequently aver-aged as a function of corresponding AAOD bins of a sam-pling size of 5000 retrievals.
type, predominantly found over the biomass burning regions of the southeastern Atlantic Ocean and Southeast Asia show a much larger range of AAOD and associated bias in COD than that observed with “dust” aerosols found in the regions of dust transport over the tropical Atlantic Ocean and the Arabian Sea. Noticeably, the magnitudes of negative bias in the cloud retrievals are also codependent on the absolute val-ues of COD (here it is aerosol-corrected COD). For instance, for an AAOD of 0.1, the bias in COD is∼ −25 % at a lower range of COD (5–10), which becomes twofold in magnitude (∼ −50 %) at the higher range of COD (20–50).
7 Summary and concluding remarks
We have developed a global above-cloud aerosol algorithm, formally named OMACA (OMI above-cloud aerosols), to si-multaneously derive the columnar optical depth of absorbing aerosols above the cloud and underlying aerosol-corrected cloud optical depth from the near-UV observations made by Aura/OMI. Physically based on the enhanced spectral contrast in the near- UV region (354–388 nm) caused by aerosol absorption above the cloud, OMACA relates the TOA observations in the two channels to a pair of ACAOD and COD under a prescribed set of assumptions. The ar-chitect of the OMACA algorithm in terms of the ancillary datasets (CALIOP-OMI based ALH, OMI-based near-UV surface albedo, and use of AIRS CO for the aerosol type identification), aerosol models (smoke and dust), and re-trieval approach (two-channel inversion) is analogous to the OMI’s two-channel, cloud-free OMAERUV aerosol algo-rithm. OMACA was applied to the entire record of OMI ob-servations (October 2004 to present) to deduce a global re-search product of AOD above the cloud. Currently, the Level 2 orbital data product is stored on a freely accessible Aura Validation Data Center webpage (https://avdc.gsfc.nasa.gov/ pub/data/satellite/Aura/OMI/V03/L2/OMACA/, last access: 15 October 2018). Also, the OMACA product is produced in the forward processing mode with a maximum latency of about 3 days, which is associated with the availability of AIRS L3 CO data for the aerosol type identification.
An analysis of the frequency of occurrence of the above-cloud absorbing aerosols reveals several important regions of the world where the overlap of absorbing aerosols and cloud are frequently observed on a monthly to seasonal scales. These regions include the southeastern Atlantic Ocean and Southeast Asia, where layers of smoke aerosols produced from the seasonal agricultural biomass burning spread thou-sands of kilometers over the regional low-level stratocumulus cloud deck; the tropical Atlantic Ocean and the Arabian Sea, where dust aerosols transported from Sahara and Arabian deserts, respectively, found over low-level clouds; the north-ern Pacific Ocean, where dust particles originated from Asian deserts, possibly mixed with the pollution haze, along the eastward transport pathways are found to overlie clouds; and
the southern Indian Ocean, where the smoke produced from agricultural burning over southeastern Africa drifts along the easterly winds and overlies the oceanic cloud deck. Glob-ally, as well as on a regional scale, no significant trend in the frequency of ACA was noted when only those obser-vations of OMI instrument (Rows 1 to 23) that are free of row anomaly throughout the OMI operation period (2004 to 2016) were used in the calculation. The climatology maps of the retrieved ACAOD (388 nm) derived from a 12-year long OMACA record show moderate (0.3 < ACAOD < 0.5, away from the sources) to higher aerosol loading (ACAOD > 0.8 in the proximity to the sources) above the cloud over these prominent aerosol–cloud overlap regions. When compared with the cloud-free, columnar aerosol loading distribution re-trieved from the OMI/OMAERUV two-channel algorithm, ACAOD accounts for as large as 60 %–100 % of the total columnar loading over different regions during peak biomass burning and dust transport seasons.
The aerosol-corrected CODs retrieved at the near-UV wavelength (388 nm) are found to be noticeably higher than those retrieved assuming no aerosols above the cloud. The percent bias in COD with reference to the aerosol-corrected COD is found to strongly correlate with AAOD as well as the magnitude of COD. For instance, carbonaceous aerosols above cloud found over the southeastern Atlantic Ocean and Southeast Asia during respective biomass burning seasons result in a significant negative bias in apparent COD, the magnitudes of which increase with increasing aerosol ab-sorption as well as the cloud brightness.
A direct comparison of coincident and collocated ACAODs derived from OMI/OMACA and those measured from airborne HSRL-2 measurements for the ORACLES phase I operation (August–September 2016) over the south-eastern Atlantic Ocean showed a good level of agreement with a correlation and RMSE of 0.7 and 0.1, respectively. We further plan to extend the validation of OMACA us-ing the direct measurements of ACAOD from an airborne 4STAR sunphotometer operated from NASA’s P3-B aircraft during ORACLES phase I and II. Additionally, a suite of aerosol microphysical and optical measurements from the ORACLES campaign, particularly those characterizing spec-tral aerosol absorption, will help to verify and improve the region-specific aerosol models employed in OMACA.
fraction. The OMACA aerosol product from OMI presented in this paper offers a crucial missing piece of information of the aerosol loading above cloud that will help us to quantify the radiative effects of aerosols above the cloud and its resul-tant impact on clouds and thus climate. A global above-cloud aerosol product, in conjunction with the standard cloud-free aerosol product, provides us with an unprecedented all-sky aerosol distribution from space. This can substantially en-hance our knowledge of how aerosols affect cloud radiative forcing and microphysical properties, and aerosol transport.
Appendix A
Table A1.Optical and microphysical properties of the OMACA dust aerosol model.
Imaginary index Single-scattering albedo Absorption Ångström exponent Wavelength in nm Wavelength in nm
Model no. 354 388 500 354 388 500 354–388 354–500 1 0.02303 0.01662 0.00720 0.74982 0.77921 0.86268 1.97901 2.34458 2 0.01279 0.00923 0.00400 0.80740 0.83778 0.91046 2.49312 2.82591 3 0.00832 0.00600 0.00260 0.84727 0.87606 0.93640 2.90115 3.14519 4 0.00561 0.00405 0.00176 0.88062 0.90532 0.95430 3.15286 3.38913 5 0.00256 0.00185 0.00080 0.93213 0.94886 0.97805 3.71332 3.87787 6 0.00128 0.00092 0.00040 0.96221 0.97234 0.98620 4.03071 3.52634 7 0.00000 0.00000 0.00000 1.00000 1.00000 1.00000 n/a N/A
n/a: Not applicable. Real refractive index=1.55.
Mean radius (fine mode)=0.052 µm; mean radius (coarse mode)=0.67 µm; standard deviation (fine mode)=1.697 µm; standard deviation (coarse mode)=1.806 µm;
minimum radii (fine mode)=0.00627012 µm; minimum radii (coarse mode)=0.0629802 µm; maximum radii (fine mode)=0.431252 µm; maximum radii (coarse mode)=7.12764 µm.
Table A2.Axis ratio distribution for the spheroidal dust particles (Dubovik et al., 2006).
Table A3.Optical and microphysical properties of the OMACA carbonaceous aerosol model.
Model no. Imaginary index Single-scattering albedo Absorption Ångström exponent Wavelength in nm Wavelength in nm
354 388 500 354 388 500 354–388 354–500 1 0.0576 0.0480 0.0288 0.7577 0.7806 0.8265 2.4555 2.5080 2 0.0480 0.0400 0.0240 0.7876 0.8082 0.8486 2.5124 2.5590 3 0.0360 0.0300 0.0180 0.8288 0.8549 0.8785 2.5935 2.6238 4 0.0240 0.0200 0.0120 0.8753 0.8879 0.9117 2.6477 2.6821 5 0.0120 0.0100 0.0060 0.9346 0.9435 0.9603 2.8481 2.9196 6 0.0060 0.0050 0.0030 0.9646 0.9696 0.9789 2.9343 2.9955 7 0.0000 0.0000 0.0000 1.0000 1.0000 1.0000 N/A N/A
Real refractive index=1.5 Model nos. 1 to 3; mean radius (fine mode)=0.080132 µm; mean radius (coarse mode)=0.705495 µm; standard deviation (fine mode)=1.492 µm; standard deviation (coarse mode)=2.075 µm; minimum radii (fine mode)=0.0161708 µm; minimum radii (coarse mode)=0.0380559 µm; maximum radii (fine mode)=0.397083 µm; maximum radii (coarse mode)=13.0788 µm. Model nos. 4 to 7 mean radius (fine mode)=0.08717 µm; mean radius (coarse mode)=0.567194 µm; standard deviation (fine
mode)=1.537 µm;
standard deviation (coarse mode)=2.203 µm; minimum radii (fine mode)=0.0156197 µm; minimum radii (coarse mode)=0.0240810 µm; maximum radii (fine mode)=0.486477 µm; maximum radii (coarse mode)=13.3595 µm.
Table A4.Nodes of OMACA look-up table.
Node parameter Number of Node values nodes
ACAOD 7 0.0, 0.1, 0.5, 1.0, 2.5, 4.0, and 6.0 at 500 nm COD 8 2, 5, 10, 20, 30, 40, and 50 (wavelength independent) Solar zenith angle 7 0◦, 20◦, 40◦, 60◦, 66◦, 72◦, 80◦
Viewing zenith angle 14 0◦, 12◦, 18◦, 26◦, 32◦, 36◦, 40◦, 46◦, 50◦, 54◦, 56◦, 60◦, 66◦, 72◦ Relative azimuth angle 11 0◦, 30◦, 60◦, 90◦, 120◦, 150◦, 160◦, 165◦, 170◦, 175◦, 180◦ Surface pressure levels 2 1013.25, 800 hPa
Aerosol layer height 4 3, 4, 5, 6 km
Table A5.Content of OMACA HDF-EOS5 data file.
SDS name Dimensions Description
Geolocation fields
Longitude X, Y Geodetic longitude of the center part of the pixel (◦) Latitude X, Y Geodetic latitude of the center part of the pixel (◦)
FoV75Area X Mean area for 75 % field-of-view pixels on the WGS-85 ellipsoid (km2) FoV75CornerLongitude X, Y, 4 Corner latitudes for 75 % field-of-view pixels on the WGS-85 ellipsoid (◦) FoV75CornerLatitude X, Y,4 Corner latitudes for 75 % field-of-view pixels on the WGS-85 ellipsoid (◦) SolarZenithAngle X, Y Solar zenith angle (◦)
ViewingZenithAngle X, Y Satellite viewing zenith angle (◦)
RelativeAzimuthAngle X, Y Relative azimuth angle (◦) aolar zenith angle+180 – viewing zenith angle TerrainPressure X, Y Terrain pressure (mbar)
Time Y Time at the start of each scan (s, TAI93) SecondsInDay Y Seconds of day at start of scan XTrackQualityFlags X, Y XTrack quality flags GroundPixelQualityFlags X, Y Ground pixel quality flags
Data fields
AerosolOpticalDepthOverCloud X, Y, 3 Aerosol optical depth over cloud at 354, 388, and 500 nm AerosolCorrCloudOpticalDepth X, Y, 3 Aerosol-corrected cloud optical depth at 354, 388, and 500 nm
ApparentCloudOpticalDepth X, Y, 3 Apparent (not corrected for aerosols) cloud optical depth at 354, 388, and 500 nm FinalAlgorithmFlags X, Y Final algorithm flags assigned to each OMACA retrieval
FinalAlgorithmFlags_MieAI X, Y Final algorithm flags associated with UV aerosol index calculations
CloudOpticalDepth_MieAI X, Y Cloud optical depth (388 nm) imported from the OMAERUV AI (Mie) algorithm CloudFraction_MieAI X, Y Radiative cloud fraction (388 nm) imported from the OMAERUV AI (Mie) algorithm InputSSA354 X, Y Aerosol single-scattering albedo at 354 nm assumed in the retrieval
InputSSA388 X, Y Aerosol Single-scattering Albedo at 388 nm assumed in the retrieval InputSSA500 X, Y Aerosol single-scattering albedo at 500 nm assumed in the retrieval
UVAerosolIndex X, Y UV aerosol index (354–388 nm pair) imported from the OMAERUV algorithm NormRadiance X, Y, 3 Normalized radiance at 354, 388, and 500 m
Reflectivity X, Y, 2 Reflectivity at 354 and 388 nm Residue X, Y Residue (354–388 nm pair) SurfaceAlbedo X, Y, 2 Surface albedo at 354 and 388 nm
FinalAerosolLayerHeight X, Y Final aerosol layer height (km) from the CALIOP-OMI monthly dataset AIRSL3COvalue XY AIRS carbon monoxide L3 data