Cost Effective Minerals
Brett Walter
Lincoln University Dairy Farm Manager
Introduction
I will outline the trace mineral supplementation used on the Lincoln University dairy farm, the cost of the programme and the results achieved. I am not advising that this system is suitable for all other farms, as every farming situation is unique, and must develop a programme suitable for their own operation.
Description of the Dairy Farm
The Lincoln University dairy farm is a new conversion just completing the second season of milking. The pastures are 95% new, having been established in the autumn of 2001.
During the 2001-2002 season 500 cows were milked on 142 ha of the milking platform, with the young stock run on the remainder. During the 2002-2003 season, 600 cows have been milked on the whole milking platform of 161.5 ha. The 2003-2004 season will see 650 cows milked on the milking platform of 161.5 ha, giving a stocking rate of 4 cows/ha.
The dairy farm water supply has a Dosatron™ dispenser installed. During the first season this was used to administer magnesium chloride (MgCl2.6H2O) and bloat remedies as required
through the water supply. For the second season we installed a water meter into the supply line from the dispenser enabling us to record and monitor the water consumed by the herd through the water trough system, and therefore the amount of supplementation that the animals are receiving.
Monitor Programme
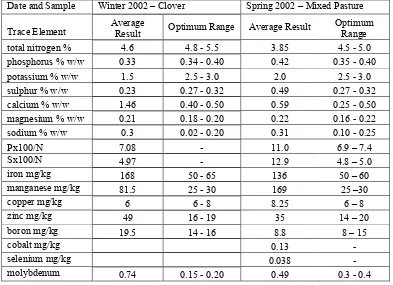
Table 1: Pasture samples—mineral status.
Date and Sample Winter 2002 – Clover Spring 2002 – Mixed Pasture Trace Element Average Result Optimum Range Average Result Optimum Range
total nitrogen % 4.6 4.8 - 5.5 3.85 4.5 - 5.0
phosphorus % w/w 0.33 0.34 - 0.40 0.42 0.35 - 0.40
potassium % w/w 1.5 2.5 - 3.0 2.0 2.5 - 3.0
sulphur % w/w 0.23 0.27 - 0.32 0.49 0.27 - 0.32
calcium % w/w 1.46 0.40 - 0.50 0.59 0.25 - 0.50
magnesium % w/w 0.21 0.18 - 0.20 0.22 0.16 - 0.22
sodium % w/w 0.3 0.02 - 0.20 0.31 0.10 - 0.25
Px100/N 7.08 - 11.0 6.9 – 7.4
Sx100/N 4.97 - 12.9 4.8 – 5.0
iron mg/kg 168 50 - 65 136 50 – 60
manganese mg/kg 81.5 25 - 30 169 25 –30
copper mg/kg 6 6 - 8 8.25 6 – 8
zinc mg/kg 49 16 - 19 35 14 – 20
boron mg/kg 19.5 14 - 16 8.8 8 – 15
cobalt mg/kg 0.13 -
selenium mg/kg 0.038 -
molybdenum 0.74 0.15 - 0.20 0.49 0.3 - 0.4
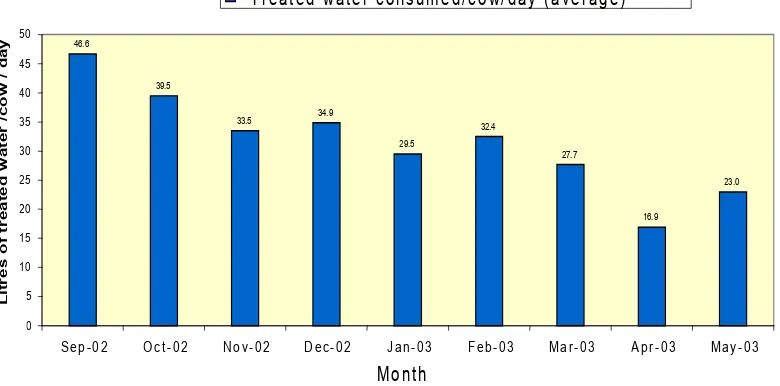
Water meter measurements
Figure 1: Treated water consumed/cow/day (average valves for period)
Method of supplementation
The trace minerals were administered via the dispenser with the rates and treatment procedure below. The rate was linked to the water consumed as measured by the water meter.
• Dispenser rate set at 1.2% (i.e. 1.2 litre of concentrate mix per 100 litre of treated stock water consumed). In prolonged periods of high water consumption (constantly exceeding 30-35 litre/cow/day), as recorded by the water meter, this was adjusted. During these periods we did run for periods at 0.8% to achieve approximately one drum of concentrate used per day on average.
• 200 litre concentrate drum mixed and supplied to the dispenser on demand, sometimes using more than 200 per day, and sometimes less.
• Changes in mix made during the season, but not increased from the spring rates. The main changes were adjusting the selenium concentration, reducing the magnesium concentration and a change in iodine supplementation.
46.6
39.5
33.5 34.9
29.5
32.4
27.7
16.9
23.0
0 5 10 15 20 25 30 35 40 45 50
Sep-02 Oct-02 Nov-02 Dec-02 Jan-03 Feb-03 Mar-03 Apr-03 May- 03
Month
L
itr
e
s
o
f tr
ea
te
d
w
at
er
/
c
o
w
/
d
ay
Table 2: Dose rates of Mg (MgCl2.6H2O) supplied from the water supply.
Month Sep Oct Nov Dec Jan Feb Mar Apr
Mg
mg/cow/day 11.2 11.9 12.1 9.4 5.3 5.8 5.0 3.0
Extra Magnesium supplied in the spring by:
• MgO dusted on pasture for all dry cows, approx. 50-60g/cow/day. • MgO dusted on pasture or silage for colostrum cows (+ lime flour
150-200 g/cow/day).
• MgO dusted on all silage feed during this period.
Mineral supplementation programme
The suggested treatment levels of trace elements for the dairy farm for the 2002-2003 season are as listed in Table 3.
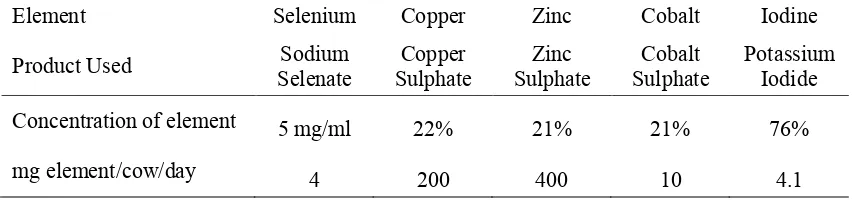
Table 3: Dose rates used for 2002-2003 season for trace elements.
Element Selenium Copper Zinc Cobalt Iodine
Product Used Selenate Sodium Sulphate Copper Sulphate Zinc Sulphate Cobalt Potassium Iodide
Concentration of element 5 mg/ml 22% 21% 21% 76%
mg element/cow/day 4 200 400 10 4.1
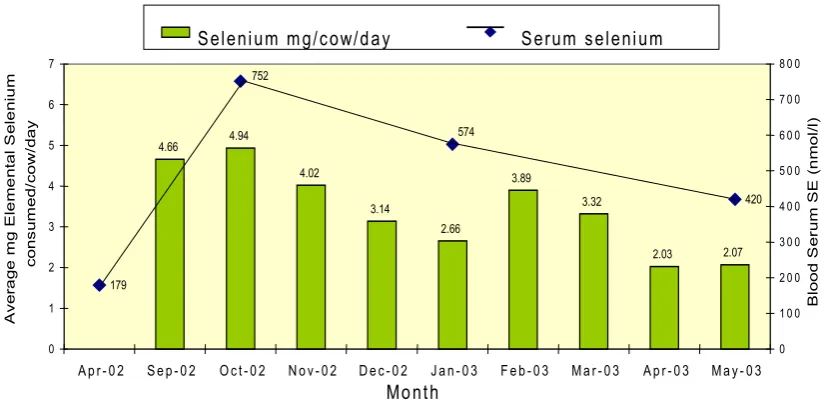
Selenium
Treatment
A liquid selenium product (5mg of elemental selenium/ml of concentrate) was added to the concentrate drum (200 litre) at a varying rate through the season. This started at 500 ml per drum and changed to 300 ml and 400 ml during the season. The dosing levels were higher at the start of the season because of the relatively low blood levels. Once the second blood test showed adequate levels, we reduced the dose rate. Selenium (Selcote Ultra) was applied to the farm at the rate of approximately 1kg/ha in the spring of 2001.
Figure 2: Selenium dose rates and serum blood test results Marginal Range Blood Serum SE (nmol/l) 85 – 139
Adequate Range Blood Serum SE (nmol/l) 140 - 7000
Liver samples were taken from cull cows for selenium and copper, their analysis is shown in Table 4 and Table 5.
Table 4: Liver Sample May 2003 – Selenium.
Animal 01 02 03
Liver Selenium (nmol/kg) 2600 1560 2700
Mean Selenium (nmol/kg) 2287
Low Marginal Adequate High
0 - 599 600 - 850 851 - 15000 15000 - 100000 Copper
Treatment
Copper sulphate was added to the concentrate drum at the required rate, and dispensed.
4.66 4.94
4.02
3.14
2.66
3.89
3.32
2.03 2.07
179
420 752
574
0 1 2 3 4 5 6 7
Ap r - 0 2 Se p - 0 2 Oct- 0 2 No v- 0 2 De c- 0 2 Ja n - 0 3 F e b - 0 3 Ma r - 0 3 Ap r - 0 3 Ma y- 0 3
Month
A
ver
a
ge
m
g E
le
m
e
nt
al
S
el
e
ni
u
m
cons
um
ed/
cow
/day
0 1 0 0 2 0 0 3 0 0 4 0 0 5 0 0 6 0 0 7 0 0 8 0 0
B
lood S
er
um
S
E
(
n
m
ol
/l)
Figure 3: Copper dose rates and serum blood test results. Adequate Range for Blood Serum FX (IU/l) 15 - 35
Zinc
Treatment
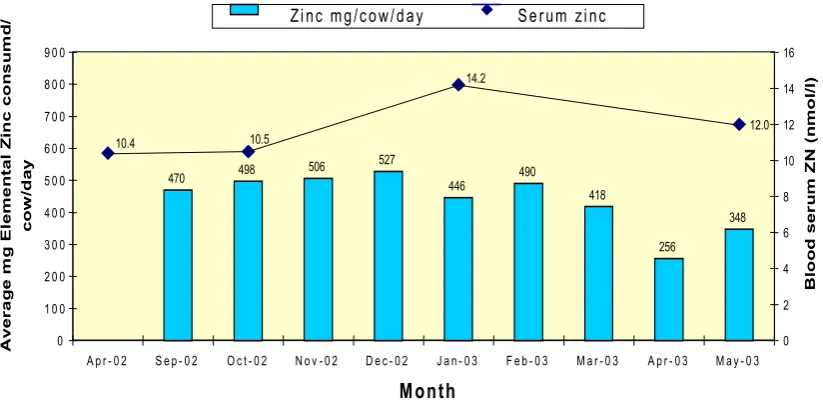
Zinc sulphate was added to the concentrate drum at the required rate, and dispensed. The blood tests for zinc have been low for the herd throughout the 2001-2002 season. The aim this year was to raise the levels to the adequate range. Figure 4 shows that the dose rate of 400-500 mg/cow/day was adequate to raise the levels to the target range.
Figure 4: Zinc dose rates and serum blood test results. Marginal Range for Blood Serum Zn (nmol/l) 7 - 12
Adequate Range for Blood Serum Zn (nmol/l) 12 – 18.5
233 247 251
262
221 243 207
127 173 23 18 22 20 0 5 0 1 0 0 1 5 0 2 0 0 2 5 0 3 0 0 3 5 0 4 0 0
A p r - 0 2 S e p - 0 2 O c t - 0 2 N o v - 0 2 D e c - 0 2 J a n - 0 3 F e b - 0 3 M a r - 0 3 A p r - 0 3 M a y - 0 3
Month A ver ag e m g E lem en tal C o p p er c ons um e d/ c ow /d a y 0 5 1 0 1 5 2 0 2 5 B lo o d S e ru m F X ( IU /I )
Copper mg/cow/day Serum copper
470 498 506
527
446 490 418
256 348 12.0 14.2 10.5 10.4 0 1 0 0 2 0 0 3 0 0 4 0 0 5 0 0 6 0 0 7 0 0 8 0 0 9 0 0
A p r - 0 2 S e p - 0 2 O c t - 0 2 N o v - 0 2 D e c - 0 2 J a n - 0 3 F e b - 0 3 M a r - 0 3 A p r - 0 3 M a y - 0 3
Month A v e ra g e m g E le m e n ta l Z in c c o n s u m d / co w /d ay 0 2 4 6 8 10 12 14 16 B lo o d s e ru m Z N ( n m o l/ l)
Cobalt
Treatment
Cobalt sulphate was added to the concentrate drum at the required rate, and dispensed.
Figure 5: Cobalt dose rates and serum blood test results. Marginal Range for Blood Serum B12 (pmol/l) 50 - 100
Adequate Range for Blood Serum B12 (pmol/l) 100 - 650
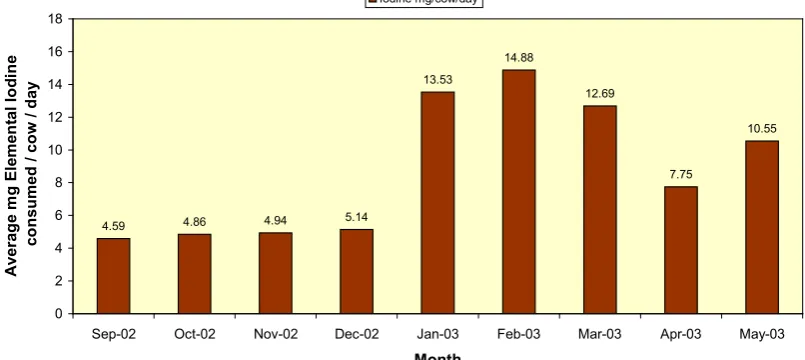
Iodine
The treatment programme for iodine was firstly based on the use of stock iodine, but later changed to the use of potassium iodide, and changed to the higher recommended dose rate.
11.9 12.1 12.6
10.6 11.7 10.0 6.1 8.3 11.2 148 358 369 309 0 2 4 6 8 10 12 14 16 18 20
Apr-02 Sep-02 Oct-02 Nov-02 Dec-02 Jan-03 Feb-03 Mar-03 Apr-03 May-03
Month A ver ag e m g E lem en tal C ob al t co nsu m ed / co w / d ay 0 50 100 150 200 250 300 350 400 B lo od ser um B 12 (p m ol /l)
Cobalt mg/cow/day Serum Cobalt
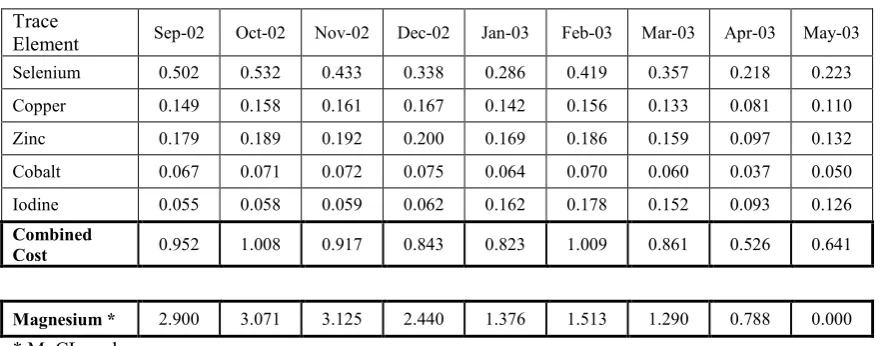
Mineral cost details
The cost of the supplementation of the minerals through the water supply varied throughout the season depending on the dose rate at the time. The average cost for the programme over the year for the minerals selenium, copper, zinc, cobalt and iodine was 0.84 cents/cow/day. The higher dose periods during September, October and November averaged approximately 0.96 cents/cow/day.
Table 6: Cost of Minerals (cents/cow/day) Trace
Element Sep-02 Oct-02 Nov-02 Dec-02 Jan-03 Feb-03 Mar-03 Apr-03 May-03
Selenium 0.502 0.532 0.433 0.338 0.286 0.419 0.357 0.218 0.223
Copper 0.149 0.158 0.161 0.167 0.142 0.156 0.133 0.081 0.110
Zinc 0.179 0.189 0.192 0.200 0.169 0.186 0.159 0.097 0.132
Cobalt 0.067 0.071 0.072 0.075 0.064 0.070 0.060 0.037 0.050
Iodine 0.055 0.058 0.059 0.062 0.162 0.178 0.152 0.093 0.126
Combined
Cost 0.952 1.008 0.917 0.843 0.823 1.009 0.861 0.526 0.641
Magnesium * 2.900 3.071 3.125 2.440 1.376 1.513 1.290 0.788 0.000
* MgCL2 only
Water quality
We can also look at the quality of the stock water in relation to the amount of dissolved solids in water. The recommend rates for the MgCl2 is 3-3.5 g/litre of stock water. This is the
main contributor to the total quantity of dissolved solids in the stock water during spring period. This is reduced from November to December, when the rate of MgCl2 drops to 1.5 g/litre.
Table 7 shows the quantity of dissolved solids for the highest dose rate used, 1.2%, for the 2002-2003 season.
Table 7: Water quality—dissolved Solids.
Dissolved solid Highest dose rate Concentration of solids (g/litre) Typical dose Max. target level
Magnesium chloride 3 2 - 3 ≤ 3
Sulphates (all included) 0.104 0.07 – 0.104 < 1.0
Conclusion
• When using a water treatment system, adjust the dose rates during prolonged periods of wet weather or supply minerals or trace elements with supplement fed.
The monitoring programme for the new Lincoln University dairy farm has been running for two seasons now, with a trace element dosing programme for the stock water supply in place for only the 2002-2003 season. The results that we have achieved have been encouraging, and we will continue to monitor and adjust as required in the future.
Workshop summary
Outcomes
• A target of this mineral programme is to lower cow wastage, and metabolic issues. • A year round simple system allows trace element levels to be maintained. It is easy for
staff to manage, is cost effective through inline water supplementation, ensuring productivity is not reduced.
Further discussion points
• There is variability associated with blood tests for zinc; however, the testing programme overall gives trends which allow accurate decision making.
• Will liver testing cull cows only skew the results? At the Lincoln University dairy farm, random culls are liver sampled, while Leo Donkers specifically liver tests of any empty culls to indicate which minerals may have an impact on empties.
• Are sulphates damaging the cows gut? This is a recognised grey area, however dosage rates are low, and cow wastage has not been increasing, therefore assume sulphate is not having negative impact. Leo has been using sulphates for nine years.
• Is there a cash benefit to having minerals and trace element levels in the high range? On both farms the target is to maintain consistent levels in the better than “low but
adequate” range.
• Would it be better just to provide minerals in the risk periods of the year and then cease mineral supplementation? Having a year round system is simple for staff, and provides consistency to the cow.
• Leo Donkers pasture analysis has indicated high Mg levels year round, yet cows have required Mg supplementation, suggesting cows are not uptaking Mg from the pasture. • Selenium is required by the animal, not the plant, therefore it may be more effective to
simply provide selenium needs through the inline dispenser rather than prills. • Dose rates, are they calculated through cow requirements, or pasture samples?
Specialist advice is used to decide on appropriate dosage rate given pasture samples. A yearly review is undertaken to set required levels.