APPLIED COMPUTING, MATHEMATICS
AND STATISTICS GROUP
Division of Applied Management and Computing
A Combined Constant Rate and
Diffusion Model to Simulate
Kiln-Drying of Pinus Radiata Timber
M.J. Youngman, D. Kulasiri, I.M. Woodhead
and G.D. Buchan
Research Report No: 99/04
March 1999
R
ESEARCH
E
R
PORT
L I N C O L N
U N I V E R S I T Y
T e W h a r e Wān a k a O A o r a k iApplied Computing, Mathematics and Statistics
The Applied Computing, Mathematics and Statistics Group (ACMS) comprises staff of the Applied Management and Computing Division at Lincoln University whose research and teaching interests are in computing and quantitative disciplines. Previously this group was the academic section of the Centre for Computing and Biometrics at Lincoln University.
The group teaches subjects leading to a Bachelor of Applied Computing degree and a computing major in the Bachelor of Commerce and Management. In addition, it contributes computing, statistics and
mathematics subjects to a wide range of other Lincoln University degrees. In particular students can take a computing and mathematics major in the BSc.
The ACMS group is strongly involved in postgraduate teaching leading to honours, masters and PhD degrees. Research interests are in modelling and simulation, applied statistics, end user computing, computer assisted learning, aspects of computer networking, geometric modelling and visualisation.
Research Reports
Every paper appearing in this series has undergone editorial review within the ACMS group. The editorial panel is selected by an editor who is appointed by the Chair of the Applied Management and Computing Division Research Committee.
The views expressed in this paper are not necessarily the same as those held by members of the editorial panel. The accuracy of the information presented in this paper is the sole responsibility of the authors.
This series is a continuation of the series "Centre for Computing and Biometrics Research Report" ISSN 1173-8405.
Copyright
Copyright remains with the authors. Unless otherwise stated permission to copy for research or teaching purposes is granted on the condition that the authors and the series are given due acknowledgement. Reproduction in any form for purposes other than research or teaching is forbidden unless prior written permission has been obtained from the authors.
Correspondence
This paper represents work to date and may not necessarily form the basis for the authors' final conclusions relating to this topic. It is likely, however, that the paper will appear in some form in a journal or in
conference proceedings in the near future. The authors would be pleased to receive correspondence in connection with any of the issues raised in this paper. Please contact the authors either by email or by writing to the address below.
Any correspondence concerning the series should be sent to:
The Editor
Applied Computing, Mathematics and Statistics Group Applied Management and Computing Division PO Box 84
Lincoln University Canterbury NEW ZEALAND
A Combined Constant Rate and Diffusion lVlodel to Simulate Kiln~
Drying of Pinus Radiata Timber
M. J. Youngman, D. Kulasiri, 1. M. Woodhead and G. D. Buchan
Lincoln University, Canterbury, New Zealand
Abst't:"act
This paper presents the use of a combined constant drying-rate and diffusion
model to simulate the drying of Pinus Radiata timber under kiln-drying
conditions. The constant drying-rate and diffusion coefficients of the model,
which control the drying rate of individual pieces of timber, were determined
from calibrating the model against the experimental drying curves obtained
under the kiln-drying conditions. The experimental drying curves were
obtained from the gravimetric measurements of the moisture content of timber
during kiln drying. Statistical relationships were developed for the constant
drying-rate and the diffusion coefficients of the model as functions of kiln
temperature and the dry basis density of timber. To determine the effects of
variability of timber, a simulation scheme was developed based on the model, the
probability distribution of the density of timber, the equations for the constant
drying-rate coefficient and the diffusion coefficient. The model and the associated
simulation method provides a simple way to estimate the drying time of a stack
of timber provided that accurate experimental results for the specific timber kiln
are used for the parameter estimation.
1. Introduction
Timber drying models have been extensively researched in order to develop a
model that can accurately predict the drying of timber from high moisture
contents (in excess of 100%, dry basis) to levels of approximately 10%. The
movement of moisture through wood is a complex process. :prying requires a
lower concentration of water vapor in the air surrounding the wood than in the
wood at the wood/air interface. When this occurs moisture can be evaporated
from the wood surface. The loss of moisture from the surface of wood causes
moisture to move from the wetter interior to the drying surfaces. In the initial
stages of drying, the free water replaces moisture evaporated from the surface,
as less energy is required to enable moisture movement. Once all of the free
water has been removed, the fiber saturation point (FSP) had been reached
(usually at moisture contents of 25-30%, dry basis). The FSP represents the
point at which the cell walls are saturated with water, but no water is present in
the cell lumen or intercellular spaces. To enable bound water movement the
hydrogen bonds holding the moisture in the cells walls need to be broken (Pratt
and Turner 1986).
Numerous timber-drying models have been developed ?-uring the last 30 years
and these have generally been classified into three categories: empirically based,
diffusion based, and combined heat and mass transfer based. The empirical
models is based on the assumption that the rate of drying is proportional to the
equivalent equilibrium moisture content of the drying air. The diffusion models
have been widely used to describe the movement of moisture in wood at moisture
contents below the FSP. Difficulties arise in the measurement and selection of
the diffusion coefficient. The heat and mass transfer models are based on the
well-known Luikov equations and also contain experimentally determined
coefficients. The models are further being extended as the knowledge of wood
anatomy, fluid movement through porous media, and mass and heat transfer in
cellular material are integrated.
Kamke and Vanek (1995) investigated 12 diffusion and heat and mass transfer
drying models and found that the high variability recorded between the models
and experimental measurements was largely due to coefficient selection. The
more sophisticated models did not perform any better than the simpler models if
the physical property data was inadequate. Therefore, a simpler model can
adequately perform well in most practical situations encountered in the kiln
drying of timber. The purpose of this research is to develop such a simple model
for practical drying of Pinus Radiata timber, and show that the model
reasonably simulates the kiln drying of timber.
2. Constant and Falling Rate Drying Periods of Timber
In this research the drying of timber was considered to consist of two periods.
During the early stages of drying the material consists of so much water that
Perry 1976, Moyne and Basilico 1985, Waananen 1993). Constant drying rates
are achieved when surface free water is maintained and the only resistance to
mass transfer is external to the wood. Since the moisture source for the surface
is internal moisture, constant drying rates can only be maintained if there is
sufficient moisture transport to keep the surface moisture content above the
FSP. If this level is not maintained then some of the resistance to mass transfer
becomes internal and neither the drying rate nor the surface temperature
remains constant (Kayihan 1987) and drying proceeds to the falling rate period.
Drying in the falling drying-rate period involves the movement of moisture to the
surface of the material and the removal of the moisture from the surface. Due to
the complex physical nature of wood and the wood-water bond, the application of
classical diffusion theory to the moisture movement problem involves a certain
degree of approximation (Moschler and Martin 1968). For this study the falling
drying-rate period was modeled using an analytical solution of Fick's second law
(equation 1) which determines the moisture content at a point (x,y) in
2-dimensional space at some time t (Crank 1979).
16
= =1
.
((2i
+l)m:] .
((2
j +l)lZVJ
IV1(x,y,t)
=
A(+-z(M
i -JIIJIL.(?
)(. )
xsm SIn-Jr i=O j=O _l + 1 2 J + 1 a b
(
2((2i
+1)2
(2j +1)2
JJ
X exp -tJr a2 Dr + b2 D\.
The analytical solution assumes isothermal air conditions (temperature, velocity
and relative humidity) during the kiln cycle; 2-dimensional mass transfer;
moisture transfer is mainly by transient diffusion through the wood; the
diffusion coefficient is constant; and, the evaporation rate is proportional to the
difference between the actual moisture content on the surface and the moisture
content required to maintain equilibrium with the surrounding atmosphere
(Mounji et al. 19~1).
The diffusion coefficient is an important coefficient in the use of diffusion based
models. It has been reported (Comstock 1963, Luikov 1966, Simpson 1993, Chen
et al. 1996, Pang 1997) that the diffusion coefficient is influenced by the drying
temperature, density and moisture content of timber. The diffusion coefficient of
water in cellophane and wood substance was shown by Stamm (1959) to increase
with temperature in proportion to the increase in vapor pressure of water.
Stamm and Nelson (1961) also observed that the diffusion coefficient decreased
with increasing wood density. The exact nature of the relationship between
moisture content and the diffusion coefficient is still not known. Simpson (1993)
recorded an exponential relationship between for the diffusion coefficient in the
moisture content range of 5 to 30%. Other factors affecting the diffusion
coefficient that are yet to be quantified are the species (specific gravity) and the
growth ring orientation.
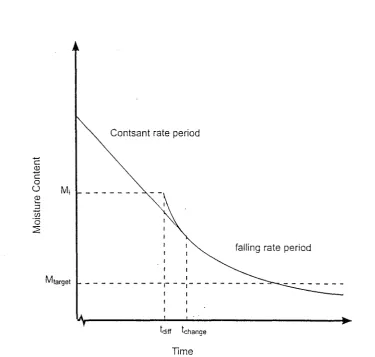
1) The constant drying-rate period was assumed to exist until such a time that
the slope of the diffusion model (using an initial moisture content of 40%)
was equal to the slope of the drying curve during the constant drying rate
period (Fig. 1). The assumption that the initial moisture content for the
diffusion model was equal to 40% was based on this being approximately
the average moisture content of timber when tpe surface moisture content
reached the FSP, approximately 30% ( Kininmonth and Whitehouse 1991,
Walker 1993, Pang 1995).
2) The diffusion coefficient in the analytical solution was assumed to be
constant in the x and y directions. Literature has suggested that the radial
diffusion coefficient is approximately 1.4 times the tangential diffusion
coefficient ( Luikov 1966, Kininmonth 1986). The majority of Pinus
Radiata timber in New Zealand is flat sawn, meaning that Dx is 1.4 times
greater in magnitude to Dy•
3) The summation portion of equation 1 was simplified to include the terms
representing the summation from i= 0 to 3 andj= 0 to 3, to reduce
computing time. This decision was based on determining the effect of
additional terms on the average moisture content values obtained from the
model. After 2 hours a difference of 0.3% was observed between the
average moisture content determined frOIp. the model using i= 0 to 3 and j=
o
to 3 and that using i= 0 to 20 andj= 0 to 20. The only time when thenumber of terms appears to be significant is in the determination of the
4) An empirical relationship was required for the equilibrium moisture
content. The equilibrium moisture content (ElVIC) of a material depends on
the physical nature of the material and the temperature and humidity of
the surrounding atmosphere. EMC values are usually published in table
form, however to enable a versatile model an empirical relationship was
required. The relationship that Pang (1995) used to determine the EMC of
Pinus Radiata timber in his research was used in this work.
(2)
Where:
w
=
187.6 + 0.694 x Tdb + 0.019 X Tdb25) During kiln drying the humidity inside the drying chamber is determined
by controlling the dry and wet bulb temperatures. To enable the EMC
value to be calculated from equation 2 the relative humidity was required
to be determined from the dry bulb and wet bulb temperatures using a
series of psychometric equations (ASHRAE, 1981).
3. Development of a Single Board Drying Model
The single board drying model was developed to allow constant drying rate and
conditions. These coefficients were determined by trial and error to adjust the
resulting drying curves to represent those measured using gravimetric
techniques. The intention of this was to determine the coefficients for a number
of boards and by using statistical analysis to obtain a relationship for the
coefficients for the use in the model. Constant drying rate and diffusion
coefficients were determined using 95 boards at dry bulb temperatures of 70, 80,
" 90, 110, 130 and 140°C, with timber thicknesses of 25, 40 and 50 mm and timber
densities of 350 to 550 kg m-3.
The average moisture content of the board is determined using equations 3 and
4. If drying is proceeding in the constant rate period then the moisture content
is found from:
AVG_MCConstantRate = CRCOe!fitient
x
Runtime + Mi(3)
If drying is proceeding in the falling rate period then the average moisture
content is determined from:
thickness width
f f
EQN(l) dx dyx=O y=o
A VG _ MCfallillgrrate = '
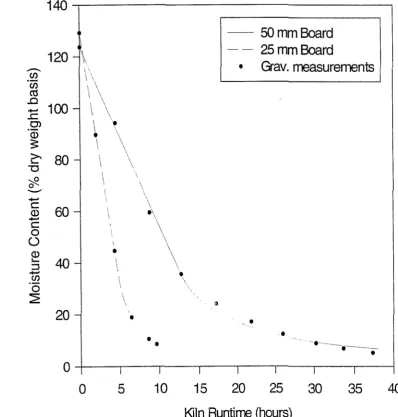
3.1 Results
The trial and error fitting of constant drying-rate and diffusion coefficients gives
an accurate indication of the drying curve for individual boards at temperatures
from 70 to 140 degrees Celsius. Drying curves, such as those shown in figures 2
and 3, were obtained at several kiln temperatures, timber dimensions and initial
moisture cont£,~.ltS. These results show that this type of model can be used to
accurately represent the drying curves for differing dimension timber drying at
different kiln settings.
3.2 Examination of the diffusion and constant drying-rate coefficients
An empirical relationship for the diffusion and constant drying rate coefficients
using the board density, thickness and drying temperature was developed using
regression analysis. Using the single board model, the diffusion and constant
drying rate coefficients were determined from gravimetric data for 95 pieces of
Pinus Radiata timber. The coefficients were determined by calibrating the
model to obtain a drying curve that matched the gravimetric measurements that
had previously been obtained. The coefficients were determined for three timber
thicknesses (25, 40 and 50 mm), six discrete drying conditions (70/57, 80/60,
90/60, 110170, 130/80 and 140/90) and each board had a different density
Initially a correlation matrix was calculated to examine whether any of the
variables were highly correlated with each other. This analysis showed that
both the dry bulb and wet bulb temperatures were highly correlated with each
other. As a result the wet bulb temperature was omitted from the analysis. The
width variable was also omitted from the analysis because most of the boards (82
of them) were 100 mm width timber with th.e left over pieces being 135, 150 and
200 mm timber.
3.2.1 Diffusion Coefficient
A General Linear Model (GLM) in statistical analysis was used to assess the
significance of the main effects and interactions of thickness, dry bulb
temperature and density in the diffusion coefficient. Initially all of the terms of
interest and the interaction terms were included in the analysis. The analysis of
variance showed that the only significant interaction was the TEMPxTHICK
(dry bulb temperaturexthickness) term. This indicated that the other interaction
terms could be omitted from the analysis as they had little effect on the
parameter determination.
The GLlVI obtained the following mode~ for the diffusion coefficient was obtained
Diffusion_ CoejJicient(xlO-9) = 30.97 - 0.056 x TEMP -1710 x THICK - 0.012 x DEN
(5)
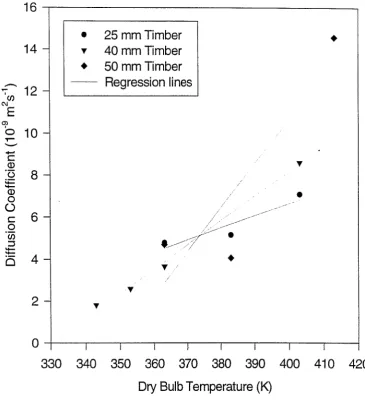
The significance of the TEMPxTHICK interaction term was of particular interest
as there are no other literature that suggests there is a relationship between the
thickness and the diffusion coefficient. The interaction between the temperature
and thickness was further investigated and it was determined that the slope of
the diffusion coefficient verses temperature differs for each thicknetss (Fig. 4).
As the thickness increases the rate of increase in the diffusion coefficient with
respect to temperature increases. It must be noted that a full selection of the
temperature and thickness combinations was not available.
The significance of the thickness (and interaction term) in the model appears to
be an important term although the physical situation does not justify this
inclusion. It was decided that the thickness term should not be included in the
model until more results had been obtained to further investigate the effect.
Completing the analysis without the thickness term gave the model below with
an R2 of 54.9%.
Diffusion_ Coefficient(10-9) = -34.6 + 0.128 x TEMP-.OO 179 x DEN
(6)
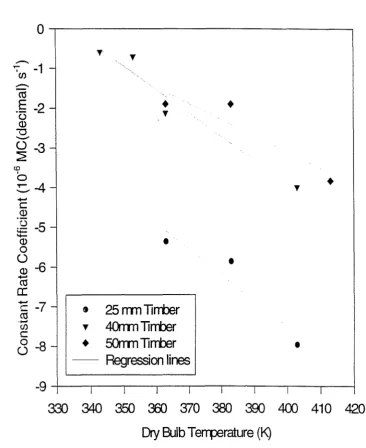
3.2.2. Constant rate coefficient
A similar process was used to determine the model for the constant rate
the interaction terms in the initial model once again showed that the only
significant interaction was the TEMPxTHICK interaction.
The following model was obtained from the GLM with R2 = 76.8%.
Constant_Rate(x10-5) = 33.15 - 0.127 x TEMP - 522 x THICK + 0.0117 x DEN
+ 1.80 x TEMP x THICK
(7)
Further analysis of the nature of the interaction term revealed that unlike with
the diffusion coefficient the slope of the constant rate coefficient verses
temperature for the different thicknesses was very similar (Fig. 5). Although the
interaction was significant in the analysis, because measurements were not
available at all of the temperature and thickness levels, and because there was
no significant difference in the slope of the lines in Fig. 5, the interaction term
was neglected. Omitting the interaction term from the analysis gave a simpler
model with only a small reduction in the R2 (75.2% compared with 76.8%
previously).
Cons tan t_Rate(xlO-5) = 5.98 - 0.0545 x TEMP + 165 x THICK + 0.0103 x DEN (8)
It must be emphasized that the deterministic relationships obtained in this
section were for a specific timber kiln. This kiln is a small experimental kiln
that will differ markedly from larger industrial kilns. This work does show that,
as reported previously, the timber density and drying temperature can be used to
possible effect of the timber thickness on the diffusion coefficient. The analysis
also showed that the constant drying-rate coefficient could be predicted from the
density, timber density and thickness with a good degree of accuracy.
4. Development of a Monte-Carlo simulation model
The Mc .... 1.te-Carlo model was an extension of the single board drying model in
that the drying of a charge of timber (in this case 200 boards) was simulated.
Parameters such as the board density and initial moisture content were
generated using probability distributions determined from the data collected for
this purpose. The relationships for the constant drying rate and diffusion
coefficients determined from the single board model were used to model the
drying of each board in the charge. The Monte-Carlo simulation determines the
moisture content of each board at each time interval (usually a 15 minute
increment) and evaluates whether 90% of the boards are deemed dry (having
average moisture contents within 2% of the target moisture content,
approximately 12%). On the completion of drying the moisture contents of each
board are written to a file and these can be further analyzed to obtain the
average drying rate and the distribution of moisture content within the charge at
the completion of drying.
The densities (basic densities) of the individual boards were assumed to be
normally distributed. The mean was assumed to be 450 kg m-\ based on the
measurements in the single boards. A standard deviation was 30 kg m-3
represented approximately 99% of the timber densities being in the range of
350-550 kg m"3 (±3 standard deviations).
The initial moisture content of each board was determined from the density of
the generated piece of timber. The initial moisture content was determined by
calculating the maximum moisture content (moisture content at total saturation)
using the equation 9. The maximum moist.ure content was then adjusted to
represent the moisture loss before the timber is put into the kiln using a
uniformly generated value between 10 and 50%. These values that represented
the moisture loss prior to placement in the kiln were randomly selected and take
into account moisture loss during felling, sawing, transportation and filleting.
Me
=
1500-P x 103MAX 1500 x P
4.1 Results
(9)
During the examination of the Monte-Carlo simulation model it was noticed that
the constant drying-rate coefficients obtained at 70 and 80°C for 40 and 50 mm
timber gave positive values for high density timber (in excess of 450 kg m"3).
Obviously this result is not physically possible because the wood cannot absorb
moisture when it is wetter than the equivalent equilibrium moisture content of
the surrounding air. The most likely reason for this result was the lack of
measurements at these temperatures. In fact there was only 4 complete
Due to the large errors involved when interpolating the out to these
temperatures the Monte Carlo simulation was conducted at temperatures at 900
C and above.
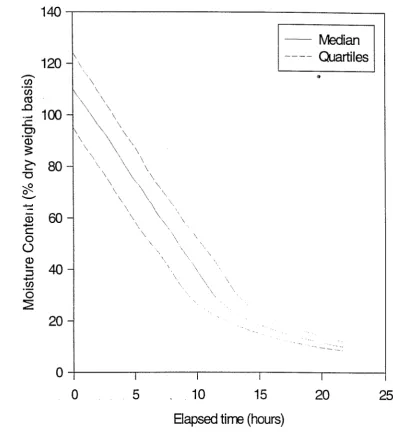
The Monte-Carlo simulation was conducted at kiln settings of 90160, 110/70,
120/70, 130/S0 and 140/90 with 25,40 and 50 mm timber. During,each
simulation the moisture content distribution on the 200 boards was examined (
Fig. 6). As expected the variation of the moisture contents reduced as drying
proceeded and at the completion of drying 75% of the boards had moisture
contents of between S.5 and 12.0%.
At the completion of drying, the moisture contents of a charge of 50 mm -Pinus
Radiata dried at 110/70 were approximately normally distributed with a
minimum of 6.0% and a maximum of 16.3%. While this result suggests that
there is strong evidence of over dried boards, schedules for kiln drying of Pinus
Radiata include an equalization phase to minimize the final moisture content
variation (Ministry of Forestry, 1996). The equalization period raises the wet
bulb temperature (to achieve an EMC of2 percent below the target moisture
content) to restrict over drying of the fastest drying boards while maintaining
the drying of the slower drying pieces. For example, the fast~st option for drying
in at 90160 in an accelerated conventional kiln with a target moisture content of
10% is to maintain the dry bulb at 90°C and raise the wet bulb to SO°C during
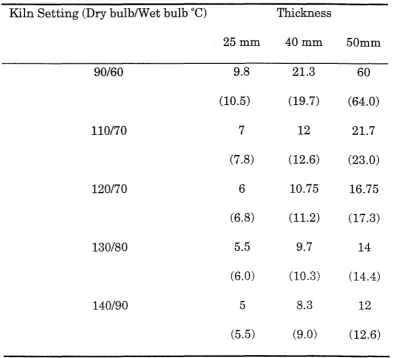
A summary of the time taken for 90% of the timber to have a moisture content of
<14% is provided in Table 1. The table shows that the drying times differ
considerably with timber thickness. The drying times obtained from the model
were consistent with the drying times obtained from another set of boards which
were not used to determine the diffusion and constant drying-rate coefficients,
but dried under the same drying conditions.
Table 1: Predicted average drying times in hours for Pinus Radiata timber
using different kiln settings. Experimental values are in parentheses.
Kiln Setting (Dry bulblW et bulb °C) Thickness
25mm 40mm 50mm
90160 9.8 21.3 60
(10.5) (19.7) (64.0)
110170 7 12 21.7
(7.8) (12.6) (23.0)
120170 6 10.75 16.75
(6.8) (11.2) (17.3)
130/80 5.5 9.7 14
(6.0) (10.3) (14.4)
140/90 5 8.3 12
5. Conclusions
Due to the complex nature of the physical processes occurring as timber dries
and the high variability in wood structure, modeling timber drying is a difficult
task. The model presented in this paper used gravimetric measurements to
..
determine relationships between density and drying temperature to predict
diffusion and constant drying-rate coefficients. A Monte-Carlo simulation was
conducted at several kiln setting to examine the coefficients and how differences
in timber density effect the moisture content variation at the completion of
drying. The simulations showed that this method of modeling the drying of
timber was accurate, however improvements could be made by:
· analyzing more boards using the single board model to improve the coefficient
prediction;
· examining the inclusion of more variables in the coefficient determination,
such as fan velocity and thickness;
· examining the use of a diffusion equation that enables changes in the kiln
conditions to be included.
References
American Society of Heating, Refrigerating and Air-Conditioning Engineers, Inc.
1981. ASHRAE Handbook 1981 Fundamentals. American Society of
Chen, Y. & Choong, E.T. & Wetzel, D.M. 1994. Optimum Average Diffusion
Coefficient: An Objective Index in Description of Wood Drying Data. Wood
and Fiber Science, 26(3): 412-420.
Comstock, G.L. 1963. Moisture Diffusion in wood as calculated from adsorption,
desorption, and steady state data. Forest Produsts Journal, 13(3): 97-103.
Crank, J. 1979. The Mathematics of Diffusion, 2nd Ed. Oxford: Clarendon
Press.
Henderson, S.M. & Perry, R.L. 1976. Drying, Chapter 11 in: 'Agricultural
Process Engineering', 3rd Edition, The AVI Publishing Company,
Conneticut.
Kamke, F.A. & Vanek, M. 1995. Computer Models for Wood Drying. In Drying
Pacific Northwest Species for Quality Markets: proceedings of a conference
sponsored by the Forest Products Society in cooperation with Inciustry
Canada and MPB Technologies Inc. October 30-November 1, 1995,
Bellevue, Washington. p.59-70.
Kayihan, F. 1987. Wood Drying from Theory to Practice. Proceedings Stress
Development and Degrade during Wood Drying, September 28-0ctober 2,
Kininmonth, J.A. & Whitehouse, L.J. 1991. Properties and Uses of New
Zealand Radiata Pine. Ministry of Foresty, Rotorua, NZ.
Luikov, A.V. 1966. Heat and Mass Transfer in Capilliary-Porous Bodies.
Translation by Harrison, P.W.B, Translation Edited by Pun, W.M, First
Edition. Pergamon Press, Oxford, UK.
Ministry of Forestry. 1996. Producing Quality Kiln Dried Timber in New
Zealand. Ministry of Forestry Publication, Wellington, New Zealand.
Moschler, W.W. & Martin, R.E. 1968. Diffusion Equation Solutions in
Experimental Wood Drying. Wood Science, 1(1): 47-57.
Mounji, H., Bouzon, J. & Vergnaud, J.M. 1991. Modeling the Process of
Absorption and Desorption of Water in Two Dimensions (transverse) in a
Square Wood Beam. Wood Science and Technology, 26: 23-37.
Moyne, C. & Basilico, C. 1985. High Temperature Convective Drying of
Softwood and Hardwood: Drying Kinetics and Product Quality
Interactions. In: Drying '85. Ed: Mujumdar, A.S. Hemisphere Publishing
Pang, S. 1995. High Temperature Drying of Pinus radiata Boards in a Batch
Kiln. Ph. D Thesis, University of Canterbury, Christchurch, New Zealand.
Pang, S. 1997. Relationship Between a Diffusion Model and a Transport Model
for Softwood Drying. Wood and Fiber Science, 29(1): 58-67.
Pratt, G.H. & Turner, C.H.C. 1986. Timber Drying Manual. Building and
Research Establishment, Watford,
UK.
Simpson, W.T. 1993. Determination and use of Moisture Diffusion Coefficients
to Characterize Drying of Northern Red Oak (Quercus rubca). Wood
Science and Technology, 27: 409-420.
Stamm, A.J. 1959. Bound-water Diffusion into Wood in the Fibre Direction.
Forest Products Journal, 9(1): 27-32.
Stamm, A.J. & Nelson, R.M. 1961. Comparison Between Measured and
TheoreticalD rying Diffusion Coefficients for Southern Pine. Forest
Products Journal, 11(11): 536-543.
Waananen, K.M., Litchfield, J.B. & Okos, M.R. 1993. Classification of Drying
Walker, J.C.F. 1993. Water and Wood, Chapter 3 in: 'Primary Wood
Processing: Principles and Practice.' Walker, J.C.F. Ed. Chapman and
List of Symbols
t = the elapsed drying time, s.
Me
=
the equilibrium moisture content, kg kg-1.M; = the initial moisture content, dry basis, kg kg-1.
Dx and Dy
=
the diffusion coefficients in the x a~d y directions, m2 S-l.a and b = the dimensions of the timber, m.
cp
=
the relative humidity, decimal.Tdb = the dry bulb temperature, °C.
TEMP = the dry bulb temperature, K.
THICK = the timber thickness, m.
DEN = the timber basic density, kg m-3
•
MCMAX = the moisture content at total saturation, decimal.
p = the basic density of the board, kg m-3
Contsant rate period
M;
1
~
11
falling rate period
Mtarget - - - - -1- -1 -1- -1 - - - - - -
-tdiff tchange
Time
Figure 1: Outline of the method used to model the drying of a piece of timber,
140
- - 50 mm Board
120
\
25mmBoard
...-
•
Grav. measurements
en en
\
co
.c
100
\
+-'
..c
C>
\
Q)
•
3:
\ \C
80
"0 ~ \ 0
--
+-' C60
Q) +-' C 0 0Q)
•
lo...
40
::::l
+-'
.,
en \
·0
~ ·ll
20
•
•
..
•
•
.....
-....
.. -.. - ....
_
.•
0
0
5
10
15
20
25
30
35 40Kiln Runtime (hours)
Figure 2: Measured and predicted drying curves for 25- and 50- mm Pinus
180
160
--
CJ)140
CJ) ('Ij .c--
120
.c 0') Q);. 100
l... "C ~80
0--
--
c Q)--
c60
0 () Q)
40
l... :::::s--
CJ) 0 ~20
0
•
\
\
•
o
2
4
6100x40 mm limber
100x25
mm limber
•
Grav Measurements
----.
8
10
12
Kiln Runtime (hours)
14
. Figure 3: Measured and predicted drying curves for 25 and 40 mm Pinus
...-... .-, (f) C\J
E
m 0 T""--
+-' C Q) "(3 .:;::::::-
Q) 0 () c 0 "00 ::J--
i:5
16,---, 14 12 10 8 6 4 2• 25 mm Timber
T 40 mm Timber
• 50 mm Timber - - Regression lines
•
•
•
o
~--~----~--~--~--~--~----~--~--~330 340 350 360 370 380 390 400 410 420
Dry
Bulb Temperature (K)o.---~
--'7
-1
en--
ccs.§
-2u
Q)
"'0
...
() -3
~ co b s-4
...
c .~ u.;: -5
"+-Q)
o
~-6
...
ccs
0::
C
-7
ccs
-
...
rJ)
c
8
-8•
T•
et 25
nm lirrber
T
40rrrn
lirrber
• 50mn
lirrber
-
Regression lines
•
•
•
•
330 340 350
360 370 380 390 400 410 420Dry
Bulb
T~rature(K)
Figure 5: Effect of the TEMPxTHICK interaction on the
Figure 6: Drying curve showing the predicted median and quartiles of