~·
Indian J. Plant Physiol., Vol. 3, No. 2, (N.S.) pp. 89-93 (April-June, 1998)
BIOCHEMICAL CHANGES OCCURING DURING DEVELOPMENT OF LEAVES
EMERGED AT THREE DIFFERENT STAGES IN PIGEONPEA
ISHWAR SINGH*, A.S. NANDWAL, M.S. KUHAD AND N. SINGH
Department ofBotany, CCS Haryana Agricultural University, Hisar-125004, Haryana
Received on 9 June, 1997, Revised on 29 Dec., 1997
SUMMARY
The leaf development and senescence of pigeonpea (Cajanus Cajan (L.) Millsp.) cultivar H-77-216 were studied at vegetative and flowering stages at weekly intervals upto 35 ·days from leaf emergence. Leaf development leading to senescence followed a significant decrease in fresh weight to dry weight ratio, chlorophyll content, total soluble carbohydrates, starch and proteins. Leaf carotenoids were comparatively stable while total leaf nitrogen, activities of cellulase, a-amylase and protease increased significantly at flowering stage. It is, therefore, inferred that the carbohydrates and proteins in leaves are solublized more rapidly during flowering stage leading to mobilization of reducing sugars and nitrogen from leaves to developing flowers/pods, which led to rapid leaf senescence and ultimately caused leaf abscission.
Key words: Pigeonpea, senescence, a-amylase, protease, chlorophyll.
INTRODUCTION
Leaf shedding in pigeonpea occurs frequently during early vegetative stage when atmospheric temperature is high and at the onset of reproductive phase due to high demand of nitrogen for develping flowers/pods (Singh et al., 1994). Plant modifies its source-sink activities by initiating leaf senescenc/shedding and mobilizing nutrients especially reducing sugars and nitrogen from the senescing leaves to the developing pods (Sheldrake and Narayanan, 1979 Sinha, 1980). However, initiation of leaf senescence leads to decline in photosynthetic rate and activities of photosynthetic enzymes resulting less dry matter production. The present investigation were undertaken to study the process of leaf development and senescence m p1geonpea.
MATERIALS AND METHODS
The crop of pigeonpea (cajanus cajan (L.) Millsp.) cultivar, H-77-216 (indeterminate) was raised at the
*
Present Add: Division of Plant Physiology & Biochemistry,Research Farm ofCCS Haryana Agricultural University. Hisar. Before sowing, seeds were inoculated with
standard-Raizobiumculture(PH-8666). Sowingwasdoneinspacing of 75x25 em in well prepared plot size of 5x6 M, replicated three times. The normal irrigation was given to the crop and all package of practices were used well in time.
Hundred unexpanded (newly emerged) leaves on the main stem in each plot were tagged at three different growth stages namely: early vegetative i.e. 15 days after sowing (DAS), late vegatative (45 DAS) and flowering (75 DAS) stages and designated as S1 S2 and S3 respectively. Sampling from each stage was done after 0, 7, 14, 21, 28 and 35 days after tagging (OAT), which represented the age of the leaf at a particular growth stage. For fresh weight (FW), three leaves were weighed seperately and then were allowed to dry in an oven at 85°C for 72 hours to obtain a constant weight. The leaf area was determined by portable leaf area meter (Model Li-3000, LiCor, USA).
Indian Institute of Sugarcane Research, Lucknow- 226002 U.P.
Total chlorophyll and carotenoids were extracted with 80% ethanol and estimated by the method of Amon (I 949) and Kaler (1960) respectively and were expressed as mg g-1 fresh weight (FW). Total soluble carbohydrates (TSC), reducing sugars and starch were estimated by using the methods ofYemm and Willis (1954), Nelson (1944) and Hassid and Neufeld (1964) respectively and the data was expressed as mg g-1 FW. Soluble proteins were estimated by Folin-Phenol reagent (Lowry et al.
1951) and the values were expressed as mg g-1 FW. All the estimations were done from fresh leaves.
Total nitrogen of leaves was determined by conventional Micro Kjeldhal method (AOAC, 1970). Cellulase activity in leaves was measured by the method described by Horton and Osborne (1967) and expressed as percent change in flow time of reaction mixture h-1 g-1 FW of leaves.
Protease and a-amylase were extracted from 500 mg fresh leaves as described earlier (Singh eta!., 1995). The enzymatic proteins were determined according to method of Lowry et.al. (1951) after precipitating extracts with 10% TCA and dissolving residue in IN NaOH in boiling water bath for 10 minutes.
Amylase activity was estimated according to method of Shuster and Gifford (1962). For calculation change in absorbance of 0.01 was taken as one unit of enzyme activity. The amylase activity was expressed as units g-1 FW Min. -1
. The protease activity was measured by the method of Beevers (1968) and specific activity was expressed as Jlg amino acids produced min-1 mg-1 proteins. The data was analysed statistically and significance was tested at 5% LSD.
RESULTS AND DISCUSSION
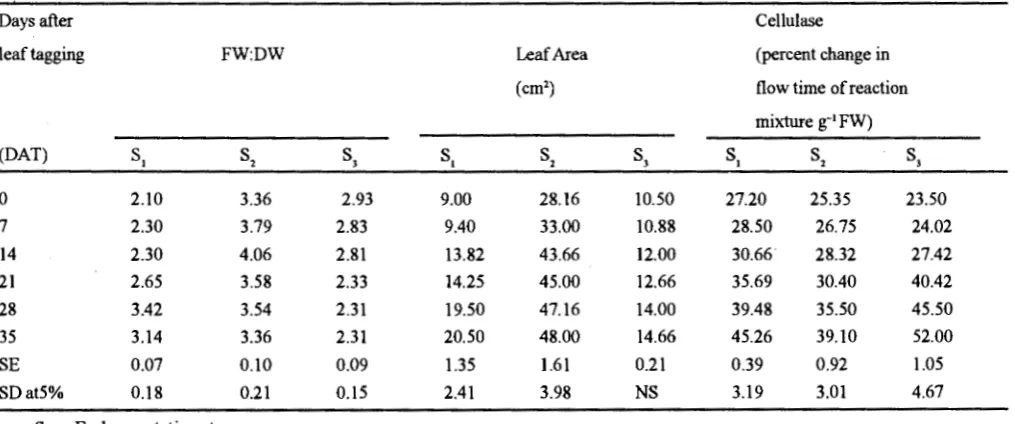
The ratio offresh weight to dry weight (FW:DW) in leaves (Table-1) increased initially during vegetative stage but declined during flowering stage. The maximum FW:DW was observed at 14 DAT (4.06) during late vegetative stage which may be possibly due to more initial water uptake. The decrease in the ratio at flowering stage may be due to more dry matter accumulation per unit fresh weight because at this stage dry matter increased a,nd water content decreased (Grover et.al., 1985).
Leaf area (Table-I) increased during vegetative and flowering stages, and maximum was attained during late
Table I. Changes in fresh weight to dry weight ratio, leaf area and cellulase activity during different stages of leaf development and senescence in pigeonpea
Days after
leaf tagging
(DAT)
0 7
14
21
28 35
SE
SDat5%
FW:DW
81
s2
2.10 3.36 2.30 3.79
2.30 4.06 2.65 3.58
3.42 3.54 3.14 3.36
0.07 0.10
0.18 0.21
8 1
=
Early vegetative stage8
2
=
Late vegetative stage8
3
=
Flowering stage90
s3
s.
2.93 9.00
2.83 9.40
2.81 13.82 2.33 14.25
2.31 19.50 2.31 20.50
0.09 1.35
0.15 2.41
Cellulase
Leaf Area (percent change in
(cm
2)
flow time of reactionmixture g-• FW)
s2
s3
81s2
s3
28.16 10.50 27.20 25.35 23.50 33.00 10.88 28.50 26.75 24.02
43.66 12.00 30.66' 28.32 27.42
45.00 12.66 35.69 30.40 40.42
47.16 14.00 39.48 35.50 45.50 48.00 14.66 45.26 39.10 52.00
1.61 0.21 0.39 0.92 1.05
3.98 N8 3.19 3.01 4.67
LEAF DEVELOPMENT OF PIGEONPEA
vegetative stage, while maximum leaf area increased during early vegetative stage. Thus decrease in FW:DW and comparatively less increase in leaf area during flowering stage might be due to the mobilization of nitrogen from the leaves to newly developed sinks i.e. flowers/pods (Grover et.a/1985) and fluctuation in day and night temperature, which induced 'premature leaf abscission (Singh et al. 1994).
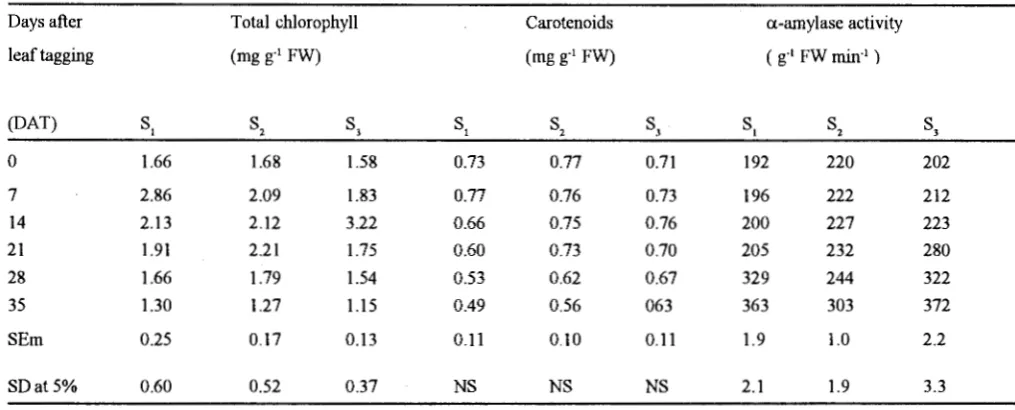
The total chloroyphyll content in leaves was significantly higher during vegetative stage than the flowering stage but no significant change in chlorophyll content of leaves was observed during early and late vegetative stages, however, maximum degradation of chlorophyll was recorded during flowering stage
(Table-11). Thus leaves at flowering stage were more sensitive to
senescence which might be induced by flower development. Similar loss of chlorophyll have been observed in wheat (Camp et a!., 1982) and soyabean ( Ghiasi et al., 19 8 7). Leaf carotenoids (Table-II) decreased more slowly than chlorophyll and were found comparatively stable at flowering stage indicating that carotenoids were less prone to the process of leaf senescence.
TSC in leaves increased significantly upto 21 DA T during vegetative stage and upto 14 DA T during flowering stage (Table-11) whereas reducing sugars in leaves
Table II. Changes in total chlorophyll, carotenoids
development and senescence in pigeonpea
Days after Total chlorophyll
leaf tagging (mg g·' FW)
(DAT)
s,
s2
sl
s,
0 1.66 1.68 1.58 0.73
7 2.86 2.09 1.83 0.77
14 2.13 2.12 3.22 0.66
21 1.91 2.21 1.75 0.60
28 1.66 1.79 1.54 0.53
35 1.30 1.27 1.15 0.49
SEm 0.25 0.17 0.13 0.11
SDat5% 0.60 0.52 0.37 NS
lndianJ. Plant Physiol., Vol. 3, No.2, (N.S.) pp. 89-93 (April-June, 1998)
increased upto 28 OAT during early vegetative stage (Table-III) and then declined. The change in starch content followed same pattern as of TSC (Table-III).
During flowering stage starch content was reduced significantly due to increased a-amylase activity (Table-H). Although amylase activity also increased significantly during early vegetative stage, but starch content remained comparatively higher at this stage. Cellulase activity increased significantly after 21 DA T during vegetative stage and after 14 DA T during flowering stage (Table-I).
Higher concentration of total carbohydrates and starch were also observed in soybean during pod filling stage (Brevendan et a/., 1977) and the vegetative and reproductive growth competed for available carbohydrates. Therefore, increased activity of a-amylase and cellulase caused breakdown of carbohydrates. The soluble products of carbohydrates (mainly reducing sugars) were mobilized towards developing flowers/ pods and thus induce/initiate senescence of leaves especially older ones.
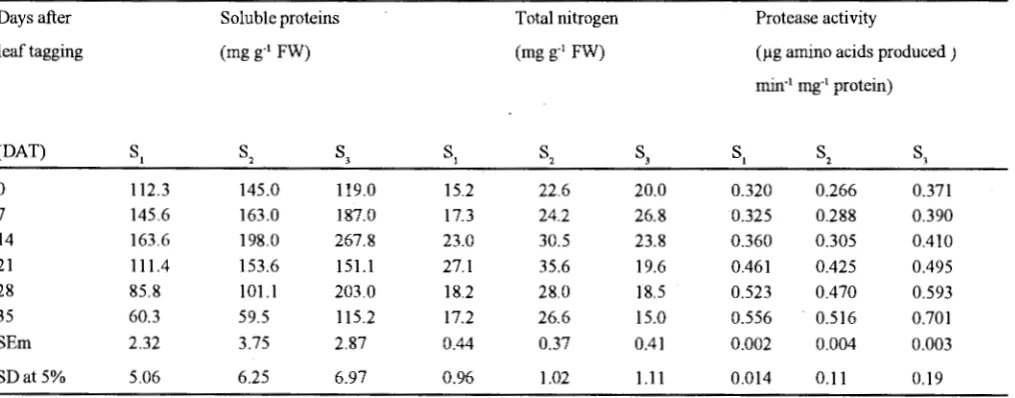
The soluble proteins in leaves increased upto 14 OAT during all the growth stages followed by a significant decrease, but initial increase was much higher during flowering stage (Table-IV). These observations are well documented by the high value of protease
-and a-amylase activity during different stages of leaf
Carotenoids a-amylase activity
(mgg·' FW) ( g·1 FW min·' )
s2
s3
s,
s2
sl
0.77 0.71 192 220 202
0.76 0.73 196 222 212
0.75 0.76 200 227 223
0.73 0.70 205 232 280
0.62 0.67 329 244 322
0.56 063 363 303 372
0.10 0.11 1.9 1.0 2.2
NS NS 2.1 1.9 3.3
Table III. Changes in TSC, starch and reducing sugars during different stages of leaf development and senescence
m p1geonpea
Days after TSC Starch Reducing sugars
leaf tagging (mg g-1 FW) (mg g-1 FW) (mg·1 FW)
(DAT)
sl
s2
s3
sl
s2
s3
sl
s2
s3
0 10.32 21.32 33.93 12.37 15.20 5.82 0.88 7.77 22.94
7 12.33 23.96 45.30 16.64 17.74 7.96 1.32 9.89 32.33
14 13.40 38.15 63.18 22.29 22.14 13.98 1.83 14.92 47.50
21 15.86 40.16 24.74 40.35 34.74 7.67 2.58 11.46 16.89
28 10.63 20.83 20.71 20.69 24.82 4.07 6.30 7.98 12.23
35 8.97 17.51 17.46 12.41 14.11 2.51 5.55 6.51 8.21
SEm 0.23 0.54 0.38 1.07 0.72 0.59 0.10 0.35 0.71
SDat5% 0.72 0.93 1.07 2.46 1.32 1.79 0.49 1.12 1.36
Table IV. Changes in soluble proteins, total nitrogen and protease activity during different stages ofleaf development
and senescence in pigeonpea
Days after Soluble proteins
leaf tagging (mg g·1 FW)
(DAT)
sl
s2
s3
sl
0 112.3 145.0 119.0 15.2
7 145.6 163.0 187.0 17.3
14 163.6 198.0 267.8 23.0
21 111.4 153.6 151.1 27.1
28 85.8 101.1 203.0 18.2
35 60.3 59.5 115.2 17.2
SEm 2.32 3.75 2.87 0.44
SDat5% 5.06 6.25 6.97 0.96
activity during flowering stage (Table-IV) Hashimoto
et. a/., (198 9) reported that level of soluble proteins per
unit fresh weight of leaves decreased with advancing senescence. Kar and Mishra (1977) reported increase in protease activity during senescence of rice leaves.
Totalleafnit1vgen (Table-IV) was significantly higher during late vegetative stage but during flowering stage it showed enhancement upto 14 DAT and then declined
92
Total nitrogen Protease activity
(mg g·1 FW) (Jlg amino acids produced)
min·1 mg·1 protein)
s2
s3
sl
s2
s3
22.6 20.0 0.320 0.266 0.371 24.2 26.8 0.325 0.288 0.390 30.5 23.8 0.360 0.305 0.410 35.6 19.6 0.461 0.425 0.495 28.0 18.5 0.523 0.470 0.593 26.6 15.0 0.556 0.516 0.701 0.37 0.41 0.002 0.004 0.003
1.02 1.11 0.014 0.11 0.19
significantly. Sheldrake (1984) indicated thatthe nitrogen in pigeopea leaves declined from 4.5 to 1.5 percent at the time of anthesis, therefore, two third of the nitrogen from leaves was mobilized to developing flowers/pods and thus induced leaf senescence. Therefore, proteins in leaves were solubilized more rapidly during flowering stage and nitrogen from leaves was mobilized 11> developing flower/pods which led to rapid leaf senescencL and ultimately caused leaf abscission.
LEAF DEVELOPMENT OF PIGEONPEA
REFERENCES
A O.A.C. ( 1970)Association ofOfficialAnalytical Chemistis official methods of analysis. Washington, DC.
Arnon, D.I. (1949).Copper enzymes in isolated chloroplasts, polyphenoloxidase in Beta vulgaris. Plant Physiol., 24: 1-5.
Beevers, L. (1968). Protein degradation and proteolytic activity in cotyledons of germinating pea seeds. Phytochern. 7: 1837-1844.
Brevendan, R.F. Egli D.B. and Leggett, J.E. (1977). Influence of nitrogen nutrition on total nitrogen, nitrate and carbohydrate levels in soybean. Agron J., 69: 965-969.
Camp, P.J., Huber, S.C., Burke, J.J. and Moreland, D.E. (1982). Biochemical changes that occur during senescence of wheat leaves. I Basis for the reduction of photosynthesis. Plant Physiol., 70: 1641-1646.
Ghiasi, H., Dybing, C.D. and Paech, C. (1987). Changes in contents of chlorophyll, protein and saccharides in leaves during plant development of determinate, semideterminate and indeterminate lines of soybean. Bioi. Plant., 29: 283-289. Grover, A, Koundal, K.R. and Sinha, S.K. (1985). Senscence of
attached leaves: Regulation by developing pods. Physiol Plant., 63: 87-92
Hashimoto, H., Kura-Hotta, M. and Kotoh, S. (1989). Changes in protein content and in the structure and number of chloroplasts during leaf senescence. Plant Cell Physiol., 30: 707-715. Hassid, W.Z. and Neufeld, E.F. (1964). Quantitative determination
of starch in plant tissues, Methods Carbohydrates Chern. 4: 33.
Horton, R.F. and Osborne, D.J. (1967). Senescence, abscission and cellulase activity in Phaseolus vulgaris. Nature, 214: I 086-1088.
Indian J. Plant Physiol., Vol. 3, No.2, (N.S.) pp. 89-93 (April-June, 1998)
Kaler, V.L. (1960). Carotenoids. In Bulletin of the Institute of Biology of Academic of Science Belorussian SSR for 1958. Vol. 4: 141-144.
Kar, M. and Mishra. D. (1977). Protease activity during rice leaf senescence. Bioi. Plant., 19: 365-369.
Lowry. O.H., Rosebrough,N.J.,Farr,AL. and Randall, R.J. (1951 ). Protein measurement with the Fohn-Phenol Reagent, J. Bioi. Chern., 193: 265-275.
Nelson, N. (1944 ). A photometric adaptation of the Somogy's method for the determination of glucose. J. Bioi. Chern., 153: 375-380.
Sheldrake, AR. (1984). Pigeonpea. In: Physiology oftropical field crops. Eds. P.R. GoldworthyandN.M. Fisher. John Wiley and sons Ltd., pp. 385-417.
Sheldrake, AR. and Narayanan, A ( 1979). Growth, development and nutrient uptake in pigeonpea (Cajanus Cajan). J. Agric Sci., 92: 513-526.
Shuster, L. and Gifford, R.L. (1962). Changes in nucleotidase during the germination of wheat embryos. Arch. Biochern. Biophys., 96: 534-540.
Singh, I. Nandwal, AS., Bharti, S. and Singh, J. (1994). Extent pattern and periodicity of leaf production and shedding in pigeonpea. Indian J. Plant Physiol., 37: 69-72.
Singh, I., Nandwal, AS. Bharti, S. and Kuhad, M.S. (1995). Biochemical characterization of corolla and carpel during flower ageing in pigeonpea (Cajanus cajan L.) Indian J. Plant Physiol., 38: 284-287.
Sinha, S.K. (1980). Plant Physiology Research. Indian Farming.,
30: 41-45.
Yemm,E.W. and Willis,AJ. (1954). The estimation of carbohydrates in plant extract by anthrone. Biochern. J., 57: 508-514.