Illinois farmers markets using EBT: Impacts on
SNAP redemption and market sales
Afroza Hasin a * and Sylvia Smith a Southern Illinois University Carbondale
Pat Stieren b
Illinois Farmers Market Association
Submitted August 11, 2014 / Revised November 3 and November 18, 2014 / Accepted November 18, 2014 / Published online December 19, 2014
Citation: Hasin, A., Smith, S., & Stieren, P. (2014). Illinois farmers markets using EBT: Impacts on SNAP redemption and market sales. Journal of Agriculture, Food Systems, and Community Development, 5(1), 179–188.
http://dx.doi.org/10.5304/jafscd.2014.051.015
Copyright © 2014 by New Leaf Associates, Inc.
Abstract
The number of people in the Supplemental Nutrition Assistance Program (SNAP), formerly known as food stamps, is currently at an all-time high. The switch from food stamp coupons to the Electronic Benefit Transfer (EBT) system was
completed nationwide in 2004, yet almost 75% of the nation’s farmers markets are not equipped to accept EBT. The state of Illinois has the sixth largest number of farmers markets in the U.S. and only 24% of its farmers markets accept EBT. The objective of this study is to identify variables important to facilitate successful EBT transactions at Illinois farmers markets. A survey was
administered electronically to all Illinois farmers market managers who reported using EBT in 2011 in this cross-sectional study. Twenty-four markets participated and completed the survey. The main outcome measure was EBT sales at farmers markets in 2011. We used linear regression analysis to examine effects of selected market
characteristics and management variables on EBT sales. We also performed a paired sample t-test to compare the sales of 2010 and 2011 and did correlation analysis to explore relationships between EBT and total credit and debit sales. SNAP redemptions increased significantly in aDepartment of Animal Science, Food and Nutrition,
Southern Illinois University Carbondale, Carbondale, Illinois.
bExecutive Director, Illinois Farmers Market Association,
Springfield, Illinois.
*Corresponding author: Afroza Hasin, MS, Instructor, Depart-ment of Animal Science, Food and Nutrition, Southern Illinois University, Carbondale; 875 South Normal Avenue, Mail Code 4317; Carbondale, Illinois 62901 USA; +1-618-453-5193; afroza@siu.edu
Disclosures
Illinois farmers markets using EBT. Use of
incentives, receipts or direct swipes, and volunteers handling EBT transactions had significant positive effects on EBT sales. Total credit and debit sales and the number of EBT transactions were found to be positively correlated. We conclude that having EBT service increases SNAP redemption at farmers markets, and that obtaining funds for incentive programs and using “receipts” method over tokens or scripts in processing EBT transactions should be areas to prioritize in adopting EBT at farmers markets.
Keywords
access to healthy food, Electronic Benefit Transfer, EBT, farmers market, SNAP
Introduction
The Supplemental Nutrition Assistance Program (SNAP), formerly known as the “food stamp” program, is the nation’s largest federal entitlement nutritional assistance program. It is administered by the United States Department of Agriculture’s (USDA) office of Food and Nutrition Service (FNS). Families and individuals who are elderly, unemployed, receiving welfare or other public assistance payments, and are low income and/or have a disability receive this assistance in order to reduce the amount of money they spend on food (USDA FNS, 2014). Federal spending on SNAP in 2012 was a record high of US$80.4 billion, up from US$68 billion in 2010, due in part to the economic recession and a high unemployment rate (Tiehen, Jolliffe, & Gundersen, 2012). Electronic Benefit Transfer (EBT), the system that allows individuals and families to access their SNAP benefits elec-tronically using a card similar to a credit or debit card, was introduced in 1994 to reduce processing costs, misuse, and fraud (Federal Electronic Bene-fits Transfer Task Force, 1994; Humphrey, 1996). The switch from food stamp coupons to EBT was completed nationwide in 2004.
In 2013 an estimated 49.1 million people in the U.S., including 15.8 million children, lived in households that experienced food insecurity, resulting from lack of affordability as well as accessibility to adequate food (Feeding America, 2014). Food insecurity can be defined in many
different ways. Since 2006, the USDA has referred to “reduced quality, variety, or desirability of diet” as “low food security,” and “multiple indications of disrupted eating patterns and reduced food intake” as “very low food security,” previously known as “food insecurity without hunger” and “food security with hunger,” respectively (USDA ERS, 2014a). Lack of access to healthful foods is another reason why many people, including children, are not eating the recommended amount of fruits and vegetables. Studies have shown direct correlations between the incidences of poor diet and related chronic diseases such as type 2 diabetes and obesity, which are more prevalent among the poor, people of color, and those living in food deserts (Feldeisen & Tucker, 2007; Ver Ploeg et al., 2009; Wiig & Smith, 2009). The USDA defines food deserts as “urban neighborhoods and rural towns without ready access to fresh, healthy, and afford-able food” (USDA Agricultural Marketing Service [AMS], n.d., para. 1). Farmers markets have the potential to be useful in alleviating healthy food disparities in food deserts by lowering the cost of, and improving access to, fresh produce (Larsen & Gilliland, 2009, McGuirt, Jilcott, Liu, & Ammer-man, 2011). People worldwide are rediscovering the benefits of buying local foods at farmers markets; not only are the foods perceived to be fresher and often more nutritious than those found at supermarkets, but buying directly from family farmers helps the farmers stay in business and the whole community benefits from the boost to their local economy (Favell, 1998; Govindasamy, Italia, & Adelaja, 2002; Serafini, Bugianesi, Salucci, Azzini, Raguzzini, & Maiani, 2002; Vallejo, Tomás-Barberán, & Garciá-Viguera, 2003; Wolf, Spittler, & Ahern, 2005).
Redeeming SNAP Benefits at Farmers Markets
process the transactions manually. The free “EBT only” machines provided by the USDA can only accept EBT cards, not credit or debit cards, and they require a phone line and electricity (Briggs, Fisher, Lott, Miller, & Tessman, 2010). These machines may appear ineffective since the farmers markets usually operate in a field or parking lots with no electricity or telephone connections, and only operate once or twice a week for a small number of hours. Although only 0.012% of the US$68 billion of SNAP benefits was redeemed at farmers markets in 2010, the total value of this redemption was US$7,547,028 (Love, 2011). There is limited literature available on the successful use of EBT at farmers markets, as well as on
identifying challenges and investigating practices to overcome these challenges. Several pilot studies have suggested effective strategies to attract SNAP customers to farmers markets, such as offering incentives, partnering with organizations (public or private sector) to acquire funding for incentives, having a central POS terminal, hiring adequate staff support, etc. (Briggs et al., 2010). The purpose of this study was to identify variables related to market management that are playing roles in the successful EBT implementations at Illinois farmers markets.
With the evolution of wireless technology, many individual farmers and market organizations are using wireless point-of-sale (POS) devices which allow them to swipe EBT as well as credit and debit cards. Farmers can buy or rent this device from third-party processors. The farmers markets using the device set up a central terminal where SNAP customers swipe their EBT card at the POS device location, the staff enters the requested amount into the device, and when the transaction is approved, tokens (wooden nickels) or paper scripts are given to the SNAP customers to be used as cash to purchase SNAP-eligible items at the market. In the receipt system, vendors itemize the products a customer wants to buy and writes down the amounts to be paid on a piece of paper. At the central terminal, that particular amount is then charged on the customer’s EBT card, and the customer is given the payment receipt, which the customer exchanges for the product (Owens & Verel, 2010). An intervention
program conducted in Arizona found four out of five markets that received a POS device experi-enced a significant increase in SNAP redemption as well as in overall sales (Bertmann, Ohri-Vachaspati, Buman, & Wharton, 2012). Another study con-ducted in West Philadelphia reported a 38% increase in SNAP redemption when each vendor was given a POS device to operate (Buttenheim, Havassy, Fang, Glyn, & Karpyn, 2012).
Partnerships with organizations like food banks, food pantries, and community-based groups can be valuable for farmers markets since they have direct contact with people in the community, including SNAP recipients. State agencies like departments of human services are responsible for promoting and processing SNAP applications, but they can also play an important role by channeling funds for a market to obtain wireless EBT devices. Philanthropic organizations like Wholesome Wave are funding price-matching programs known as “Double Value Coupon” (DVC) programs in 26 states and over 200 farmers markets (Wholesome Wave, 2011; Young, Aquilante, Solomon, Colby, Kawinzi, Uy, & Mallya, 2013). Markets offering a US$2–US$5 DVC incentive for every EBT swipe have been successful at attracting more SNAP recipients to redeem their benefits at farmers markets for several years (Briggs et al., 2010).
Although low-income communities can benefit from having well-run farmers markets, there are often economic, social, and sometimes cultural barriers impeding success (Appalachian Sustainable Agriculture Project, 2012; Leone et al., 2012). Studies showed that low-income consumers per-ceive “convenience” as one of the major barriers to shopping at farmers markets. Convenience has been identified as 24-hour access, access to public transportation, one-stop shopping, and availability of products (Briggs et al., 2010; Colasanti, Connor, & Smalley, 2010; Grace, Grace, Becker, & Lyden, 2007). Researchers have also cited insufficient revenue, lack of balance between the number of vendors and the number of customers, product mix, and unpaid markets managers as reasons for market failure (Stephenson, Lev, & Brewer, 2006).
the sixth largest number of farmers markets in the nation, yet at the time of this study, only 55 of the 292 USDA registered farmers markets accepted EBT (USDA AMS, 2014b). About 75% (6,183 out of 8,161 markets) of U.S. farmers markets are still not equipped to accept EBT (USDA AMS, 2014b).
SNAP sales dropped to their lowest level at farmers markets in 2007 because farmers markets vendors were not given a universal, feasible meth-od to accept SNAP benefits, and SNAP recipients were not well informed about the services at farm-ers markets (Briggs et al., 2010). Successful EBT implementations at farmers markets can provide SNAP customers with better access to healthful, fresh fruits and vegetables, and have a positive impact on the overall health of our nation, in addition to improving the economic viability of small to medium-size produce farmers.
The objectives of our study were to find out the following: (1) whether SNAP redemption (in dollar amounts) increases when farmers markets offer the EBT service, (2) whether credit and debit transactions are positively related to EBT sales at farmers markets, and (3) whether markets offering incentive programs have higher EBT sales. We also wanted to explore the effects of operational vari-ables such as the location of the market (located in or near food deserts) and the method of EBT transactions (through tokens or receipts, and the handling of transactions by paid employees or volunteers) on EBT sales. Farmers market mana-gers, policy makers, community nutritionists, and public health officials can utilize findings from this study as they attempt to facilitate successful EBT programs at farmers markets across the U.S.
Methods
Study Design
This quantitative study was carried out using a cross-sectional survey of farmers markets in Illinois that were using EBT during the 2011 market sea-son. All Illinois farmers markets that were accept-ing EBT in the years 2010 and 2011 were consid-ered as the sampling frame for this study (a total of 40 farmers markets). The study was approved by the Institutional Review Board for human subject research. The survey questionnaire was distributed
electronically with LimeSurvey (an open-source Web-based questionnaire tool) during the months of December 2011 through February 2012. Farm-ers market managFarm-ers were contacted four times, as recommended by Dillman (2007): first with a pre-notice email, second with the actual electronic survey, followed by two reminders via email.
Instrument and Data Collection
The EBT questionnaire was developed, checked for face validity, and pretested by a panel of four experts (who were market managers administering EBT and farmers market consultants). A number of questions were reworded and added after pre-testing the survey. The 37-item survey included questions regarding (1) market size and location, (2) EBT transactions, (3) credit and debit transac-tions, (4) vendor participation, (5) staff support, (6) partnership with organizations, (7) methods of processing EBT, and (8) associated costs. The following detailed questions were asked in order to identify operational variables affecting EBT sales at farmers markets in Illinois: “Who is responsible for the EBT/Credit/Debit program?” (The categories were government, nongovernmental organization (NGO), business, and other); “How did you handle EBT/credit/debit transactions with your ven-dors?” (tokens/scripts, receipts, other); “How did you process transactions?” (manual voucher, free EBT machine, owned/leased EBT-only machine, owned/leased POS machine, other); “Who handled the EBT transactions at your market?” (volunteer, employee, intern, other); “Did you offer any incentive programs for those customers using EBT?” (yes or no); “Did you accept credit/debit cards?” (yes or no); “Did you require all vendors to participate in your EBT/credit/debit programs?” (yes or no). Information on whether the market was located in or near a food desert was collected using the online Food Desert Locator tool devel-oped by the USDA’s Economic Research Service.
Statistical Analysis
to identify market management variables influ-encing the 2011 EBT sales (dependent variable), linear regression analysis was performed with a significance level of 0.05. The data were checked for the assumptions of normality, multicollinearity, and homoscedasticity, and the assumptions were met before running the regression. Dummy variables were constructed for the independent variables that were categorical. Market size was included in the analysis as a control variable. However, dummy variables for two large markets with very high EBT sales relative to their number of vendors (Daley market in Chicago and the Urbana market) were included in the regression analysis to deal with outlier effects. The linear regression model we used to predict market management variables influencing EBT sales was specified as:
2011 1 2
3 4 5 6 7
8 9
Where X1=number of vendors selling SNAP-approved items; X2=NGO-administered EBT, credit, and debit program; X3=Handling EBT, credit, and debit transactions with receipts or direct swipe; X4=Use of owned or leased EBT-only machine; X5=Employee handling of EBT, credit, and debit transactions; X6=Use of incentives for EBT; X7=Acceptance of credit and debit cards; X8=All vendors are required to accept EBT, credit, and debit transactions; and X9=Farmers market located in or near a food desert. Correlation analysis was used to examine the relationship between EBT sales and the amount of credit and debit transactions.
Results
Twenty-four market managers responded out of 40 Illinois farmers markets that were using EBT in 2011 (60% response rate). Twelve of these markets were among the 25 markets that were using EBT in 2010 as well. A statistically significant 104.7% increase in EBT sales was observed between 2010 and 2011 (from US$3,760 to US$5,922). The sizes of the markets varied from a single vendor to 66 vendors, with the average being 22 vendors. In
66.7% of the markets, the farmers markets required all vendors to participate in the EBT program. The one-time start-up cost for the electronic
transaction service per market ranged from US$0 to US$2,500 with an average of US$390 to
purchase tokens, supplies, or equipment. Forty-five percent of the markets financed the start-up cost through local government or public agencies, 20% through the private sector or NGOs, and the rest
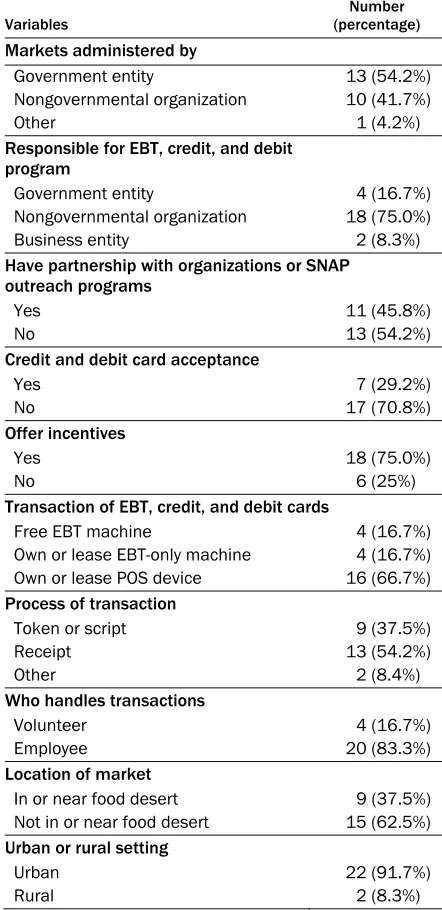
Table 1. Characteristics of Illinois Farmers Markets Using EBT in 2011 (N=24)
Variables (percentage) Number
Markets administered by
Government entity 13 (54.2%)
Nongovernmental organization 10 (41.7%)
Other 1 (4.2%)
Responsible for EBT, credit, and debit program
Government entity 4 (16.7%)
Nongovernmental organization 18 (75.0%)
Business entity 2 (8.3%)
Have partnership with organizations or SNAP outreach programs
Yes 11 (45.8%)
No 13 (54.2%)
Credit and debit card acceptance
Yes 7 (29.2%)
No 17 (70.8%)
Offer incentives
Yes 18 (75.0%)
No 6 (25%)
Transaction of EBT, credit, and debit cards
Free EBT machine 4 (16.7%)
Own or lease EBT-only machine 4 (16.7%)
Own or lease POS device 16 (66.7%)
Process of transaction
Token or script 9 (37.5%)
Receipt 13 (54.2%)
Other 2 (8.4%)
Who handles transactions
Volunteer 4 (16.7%)
Employee 20 (83.3%)
Location of market
In or near food desert 9 (37.5%)
Not in or near food desert 15 (62.5%)
Urban or rural setting
Urban 22 (91.7%)
by federal, state, or county grants. About 70% of the markets did not accept credit or debit cards. Descriptive statistics of the participating markets are shown in Table 1. The total credit and debit sales of the markets (n=7) ranged from US$200 to US$67,966, with an average of US$30,517 per season. A significant positive correlation was found between credit and debit sales and the number of EBT transactions in the market (r=0.755; p=0.050).
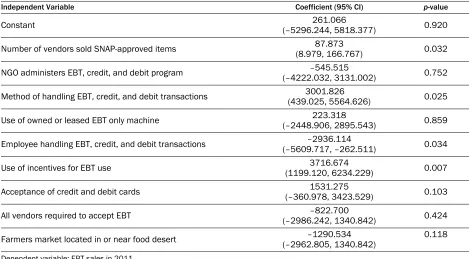
Results of the regression analysis (adjusted
R2=0.866) showed that the use of incentives (p=0.007), paid employees versus volunteers (p=0.034), and the handling of transactions by receipts and direct swipe (p=0.025) were significant predictors of EBT sales at markets. Results are shown in Table 2. These results indicate that markets that offered incentives for EBT use had on average US$3,716.67 (95% CI: US$1199.12, US$6234.23) more in EBT sales compared to EBT sales of the markets that did not offer any incen-tives. Results also indicate that markets that used receipts or direct swipes on individual POS devices rather than using tokens in EBT transaction had on
average US$3,001.83 (95% CI: US$439.03, US$5564.63) more in EBT sales. On the other hand, markets where a paid employee handled the EBT transactions rather than a volunteer had an average US$2936.11 (95% CI: US$5609.717, US$262.511) less in EBT sales.
Discussion
When comparing sales data (2010 to 2011), we found that EBT sales (dollar amount) in Illinois farmers markets significantly increased when the EBT technology was used. We also found a signifi-cant positive correlation between the number of EBT transactions and the amount of credit and debit sales at farmers markets. These findings suggest that having the wireless POS device that can be used to accept EBT, credit, and debit cards can not only increased SNAP redemption, but also generated revenue through credit and debit trans-actions at these farmers markets. These results supportthe findings of other studies in which the researchers reported significant increases in SNAP redemption as well as increased total revenue for
Table 2. Regression Results Showing Determinants of EBT Sales in Illinois Farmers Markets in 2011
Independent Variable Coefficient (95% CI) p-value
Constant (–5296.244, 5818.377) 261.066 0.920
Number of vendors sold SNAP-approved items (8.979, 166.767) 87.873 0.032
NGO administers EBT, credit, and debit program (–4222.032, 3131.002) –545.515 0.752
Method of handling EBT, credit, and debit transactions (439.025, 5564.626)3001.826 0.025
Use of owned or leased EBT only machine (–2448.906, 2895.543) 223.318 0.859
Employee handling EBT, credit, and debit transactions (–5609.717, –262.511)–2936.114 0.034
Use of incentives for EBT use (1199.120, 6234.229)3716.674 0.007
Acceptance of credit and debit cards (–360.978, 3423.529) 1531.275 0.103
All vendors required to accept EBT (–2986.242, 1340.842) –822.700 0.424
Farmers market located in or near food desert (–2962.805, 1340.842) –1290.534 0.118
Dependent variable: EBT sales in 2011 Adjusted R2=0.866
the markets when operating EBT services (Institute for Agriculture and Trade Policy [IATP], 2011; Krokowski, 2014).Our third objective was to find out whether the amount of SNAP redemption is influenced by the presence of customer incentive programs. We found that offering incentives for EBT use was a significant predictor of SNAP redemption at these farmers markets. These incen-tives are typically double value coupons; in essence, SNAP customers receive double the amount of fresh produce for every dollar spent. This finding is supported by those of other studies (Obadia, 2011; Wholesome Wave, 2011). No significant effect on sales was found for EBT sales at farmers market located in or near food deserts. However, addi-tional research is warranted with a larger sample size to investigate any effect of farmers markets being located in food deserts on EBT sales. It will also be beneficial to conduct qualitative research on the perceptions of SNAP recipients living in food deserts in regard to redeeming their benefits at farmers markets.
The use of receipts or direct swipe was found to have a significant positive effect on EBT sales over the token or script transaction methods. This finding suggests that customers found receipts, or getting the commodity directly from vendors by swiping the EBT cards, more convenient than handing and counting tokens or scripts. Results of another study showed that disbursing tokens to reimburse farmers was one of the major challenges reported by the market managers (Krokowski, 2014). Three of the Illinois markets had single vendors, and therefore the customers were able to use the EBT card like a credit or debit card without going through the central terminal.
Often farmers markets are run by volunteers, but may run better with paid employees (Ragland & Tropp, 2009). However, the handling of the EBT, credit, and debit transactions by paid employees as opposed to volunteers was found to have a significant negative effect on EBT sales. This came out as an additional finding of this study suggesting that EBT sales were higher when mar-kets were run by volunteers. A plausible explana-tion for this finding could be the fact that almost 60% of the nation’s farmers markets are run by volunteer market manager (Ragland & Tropp,
2009). Historically, market managers have been volunteers as they were also producers or vendors at the market as well. They volunteered their services in order to organize the operation of the market, ultimately to be more successful in selling their own products. However, we acknowledge that volunteerism does not necessarily indicate experience and since we did not know the years of experience of any paid employee or volunteer in the current study, we suggest caution in inter-preting this result. Further investigation is needed to understand the role of volunteer staffing on EBT sales.
Among the limitations of this study, informa-tion regarding the experience of market managers and cash sales by vendors was not collected. Vendors usually were reluctant to report total cash sales; the lack of information on cash transactions by vendors has also been reported by others (Obadia, 2011). One of major limitations of this study is the small sample size and not having data from the markets that did not participate. We acknowledge that there is potential respondent bias in our study as the markets that participated could be completely different from the markets that did not participate. However, we are not aware of any differences and have no reason to believe that any differences exist. Additionally, due to the very small number (n=7) of markets in our sample that accept credit and debit transactions, inferential statistical analysis was not performed to identify the variables influencing credit and debit sales. More research is warranted in other geographic locations and one should be cautious before gen-eralizing the findings of this study. In spite of these caveats, the findings provide insight into various practices involving EBT transactions at farmers markets, which can be valuable for the markets that are in the process of obtaining EBT service.
Conclusions
qualitative findings from a focus group consisting of managers at a combination of markets that accept EBT and do not. Vendors at farmers mar-kets should be educated about the financial and public-relations benefits of offering EBT, and SNAP customers should be informed about the availability of EBT services at their local farmers markets. Market associations should select the most user-friendly options of an EBT operation, for example using receipts or swipe methods instead of tokens or scripts, when deciding to implement EBT at a market. Obtaining data on years of market managers’ experience (whether volunteer or employed) will be useful to better understand how it affects sales at a market. Although it is unclear what long-term impact incentives might have on SNAP customer behavior (that is, if they will keep coming back to farmers markets even when the incentives are not offered), obtaining funds for an incentive program could be a possible policy instrument to attract more SNAP customers to farmers markets. It is important that the new farm bill address issues related to effective implementation of EBT technology at farmers markets, which can not only promote healthy eat-ing in low-income communities, but also support local farmers by increasing SNAP redemption at farmers markets.
Acknowledgements
The authors thank Dr. Stephen Brown and Dr. Subhash Sharma of SIUC for their valuable input in preparing this manuscript.
References
Appalachian Sustainable Agriculture Project. (2012).
Farmers markets for all: Exploring barriers and opportunities for increasing fresh food access by connecting low-income communities with farmers markets. Ashville, North Carolina: Appalachian Sustainable Agriculture Project Local Food Research Center. Retrieved from
http://asapconnections.org/downloads/asap-farmers-markets-for-all-full-report.pdf
Bertmann, F. M. W., Ohri-Vachaspati, P., Buman, M. P., & Wharton, C. M. (2012). Implementation of wireless terminals at farmers’ markets: Impact on SNAP redemption and overall sales. American
Journal of Public Health, 102(7), e53–e55. http://dx.doi.org/10.2105/AJPH.2012.300727 Briggs, S., Fisher, A., Lott, M., Miller, S., & Tessman, N.
(2010). Real food, real choice: Connecting SNAP recipients with farmers’ markets. Community Food Security Coalition and Farmers Market Coalition. Retrieved from http://oregonhunger.org/real-food-real-choice-connecting-snap-recipients-farmers-markets Buttenheim, A. M., Havassy, J, Fang, M., Glyn, J., &
Karpyn, A. E. (2012). Increasing Supplemental Nutrition Assistance Program/Electronic Benefit Transfer sales at farmers’ markets with vendor- operated wireless point-of-sale terminals. Journal of the Academy of Nutrition and Dietetics, 112(5), 636–641. http://dx.doi.org/10.1016/j.jand.2011.12.021 Colasanti, K. J. A, Connor, D. S., & Smalley, S. B.
(2010). Understanding barriers to farmers’ market patronage in Michigan: Perspectives from marginalized populations. Journal of Hunger and Environmental Nutrition, 5(3), 316–338.
http://dx.doi.org/10.1080/19320248.2010.504097 Dillman, D. (2007). Mail and internet surveys: The tailored
design method (2nd ed.). Hoboken, New Jersey: John Wiley & Sons.
Favell, D. J. (1998). A comparison of the vitamin C content of fresh and frozen vegetables. Food Chemistry,62(1), 59–64. Retrieved from http://ucanr.edu/datastoreFiles/608-97.pdf Federal Electronic Benefits Transfer Task Force. (1994).
From paper to electronic: Creating a benefit delivery system that works better & costs less — An implementation plan for nationwide EBT. Washington, D.C.: Government Accountability Office.
Feeding America. (2014). Hunger and poverty fact sheet.
Retrieved from http://www.feedingamerica.org/ hunger-in-america/impact-of-hunger/hunger-and-poverty/hunger-and-poverty-fact-sheet.html Feldeisen, S. E., & Tucker, K. L. (2007). Nutritional
strategies in the prevention and treatments of metabolic syndrome. Applied Physiology, Nutrition, and Metabolism, 32(1), 46–60.
http://dx.doi.org/10.1139/h06-101 Govindasamy, R., Italia, J., & Adelaja, A. (2002).
Farmers’ markets: Consumer trends, preferences, and characteristics. Journal of Extension, 40(1), 1RIB6. Retrieved from
Grace, C., Grace, T., Becker, N., & Lyden, J. (2007). Barriers to using urban farmers’ markets: An investigation of food stamp clients’ perceptions.
Journal of Hunger and Environmental Nutrition, 2(1), 55–75.
http://dx.doi.org/10.1080/19320240802080916 Humphrey, D. B.(1996).The economics of electronic benefit transfer payments. Federal Reserve Bank of Richmond Economic Quarterly, 82(2), 77–94. Retrieved from https://www.richmondfed.org/publications/ research/economic_quarterly/1996/spring/ humphrey.cfm
Illinois Department of Agriculture. (2001). Facts about Illinois agriculture. Retrieved December 10, 2014, from http://www.agr.state.il.us/about/agfacts.html Institute for Agriculture and Trade Policy [IATP].
(2011).Electronic benefits at three farmers markets in Minneapolis: An analysis of the 2010 pilot program.
Minneapolis, Minnesota: Author. Retrieved from http://www.iatp.org/documents/electronic- benefits-at-three-farmers-markets-in-minneapolis-an-analysis-of-the-2010-pilot-
Krokowski, K. (2014). Evaluating the economic and nutrition benefits of EBT programs at farmers’ markets. Journal of Agriculture, Food Systems, and Community Development, 4(2), 37–44.
http://dx.doi.org/10.5304/jafscd.2014.042.011 Larsen, K., & Gilliland, J. (2009). A farmers’ market in a
food desert: Evaluating impacts on the price and availability of healthy food. Health & Place, 15(4), 1158–1162. http://dx.doi.org/10.1016/j. healthplace.2009.06.007
Leone, L. A., Beth, D., Ickes, S. B., MacGuire, K., Nelson, E., Smith, R. A.,…Ammerman, A. S. (2012). Attitudes toward fruit and vegetable consumption and farmers’ market usage among low-income North Carolinians. Journal of Hunger and Environmental Nutrition, 7(1), 64–76.
http://dx.doi.org/10.1080/19320248.2012.651386 Love, D. (2011). Farmers market SNAP sales soar in 2010.
Farmers Market Coalition. Retrieved from http://www.farmersmarketcoalition.org/snap-sales-soar-2010
McGuirt, J. T., Jilcott, S. B., Liu, H., & Ammerman, A. S. (2011). Produce price savings for consumers at farmers’ markets compared to supermarkets in North Carolina. Journal of Hunger and Environmental
Nutrition, 6(1), 86–98.
http://dx.doi.org/10.1080/19320248.2010.551031 Obadia, J. (2011). Why some markets succeed when others fail:
Final report, October 2010–August 2011. Medford, Massachusetts: The Friedman School of Nutrition Science and Policy, Tuft University. Retrieved from http://www.ams.usda.gov/AMSv1.0/getfile?dDoc Name=STELPRDC5093846
Owens, N., & Verel, K. (2010). SNAP/EBT at your farmers market: Seven steps to success. Project for Public Spaces, Inc., & Wholesome Wave. Retrieved from the Project for Public Spaces website:
http://www.pps.org/pdf/SNAP_EBT_Book.pdf Ragland, E., & Tropp, D. (2009). USDA national farmers
market manager survey, 2006. Washington, D.C.: USDA, Agricultural Marketing Service. http://dx.doi.org/10.9752/MS037.05-2009 Serafini, M., Bugianesi, R., Salucci, M., Azzini, E.,
Raguzzini, A., & Maiani, G. (2002). Effect of acute ingestion of fresh and stored lettuce (Latuca sativa) on plasma total antioxidant capacity and antioxidant levels in human subjects. British Journal of Nutrition, 88(6), 615–623.
http://dx.doi.org/10.1079/BJN2002722 Stephenson, G., Lev, L., & Brewer, L. (2006). When
things don’t work: Some insights into why farmers’ markets close (Special Report No. 1073). Corvallis, Oregon: Oregon State University Extension Service. Retrieved from http://smallfarms.oregonstate.edu/ sites/default/files/small-farms-tech-report/ eesc_1073.pdf
Tiehen, L., Jolliffe, D., & Gundersen, C. (2012).
Alleviating poverty in the United States: The critical role of SNAP benefits (Economic Research Report No. ERR-132). Retrieved from the USDA Economic Research Service website: http://www.ers.usda. gov/publications/err-economic-research-report/err132.aspx
U.S. Department of Agriculture [USDA]. (2012). USDA directory records more than 7,800 farmers markets [Press release]. Retrieved December 7, 2014, from http://www.usda.gov/wps/portal/usda/usdahome ?contentid=2012/08/0262.xml
USDA Agricultural Marketing Service [AMS]. (n.d.).
USDA AMS. (2014a). National count of farmers market directory listing graph: 1994–2014 [Chart].
Retrieved from http://www.ams.usda.gov/AMS v1.0/ams.fetchTemplateData.do?template=Templa teS&leftNav=WholesaleandFarmersMarkets&page =WFMFarmersMarketGrowth&description=Farm ers%2520Market%2520Growth
USDA AMS. (2014b). Farmers markets directory search.
Retrieved on July 7, 2014, from
http://search.ams.usda.gov/farmersmarkets/ USDA Economic Research Service (2014a). Definitions of
food security. Retrieved on October 26, 2014, from http://www.ers.usda.gov/topics/food-nutrition- assistance/food-security-in-the-us/definitions-of-food-security.aspx#.VA9KYkvDA00
USDA Food and Nutrition Service [FNS]. (n.d.). USDA Supplemental Nutrition Assistance Program (SNAP): Putting healthy food within reach.Retailer Policy and Management Division, 2012 annual report. Retrieved from http://www.fns.usda.gov/sites/default/ files/2012-annual-report.pdf
USDA FNS. (2014). Supplemental Nutrition Assistance Program (SNAP): Facts about SNAP. Retrieved from http://www.fns.usda.gov/snap/facts-about-snap Vallejo, F., Tomás-Barberán, F., & Garciá-Viguera, C. (2003). Health-promoting compounds in broccoli as influenced by refrigerated transport and retail sale period. Journal of Agricultural and Food Chemistry, 51(10), 3029–3034.
http://dx.doi.org/10.1021/jf021065j
Ver Ploeg, M., Breneman, V., Farrigan, T., Hamrick, K., Hopkins, D., Kaufman, P.,…Tuckermanty, E. (2009). Access to affordable and nutritious food — Measuring and understanding food deserts and their consequences: Report to Congress (AP-036). USDA Economic Research Service. Retrieved from http://www.ers.usda.gov/publications/ap-administrative-publication/ap-036.aspx
Wholesome Wave. (2011). Double Value Coupon program: A 2010 snapshot. Bridgeport, Connecticut: Author. Wiig, K., & Smith, C. (2009). The art of grocery
shopping on a food stamp budget: Factors
influencing the food choices of low-income women as they try to make ends meet. Public Health
Nutrition, 12(10), 1726–1734.
http://dx.doi.org/10.1017/S1368980008004102 Wolf, M. M., Spittler, A., & Ahern, J. (2005). A profile
of farmers’ market consumers and the perceived advantages of produce sold at farmers’ markets.
Journal of Food Distribution Research, 36(1), 192–201. Retrieved from http://purl.umn.edu/26768 Young, C. R., Aquilante, J. L., Solomon, S., Colby, L.,
Kawinzi, M. A., Uy, N., & Mallya, G. (2013). Improving fruit and vegetable consumption among low-income customers at farmers markets: Philly Food Bucks, Philadelphia, Pennsylvania, 2011.