https://doi.org/10.5194/os-15-179-2019
© Author(s) 2019. This work is distributed under the Creative Commons Attribution 4.0 License.
Dynamics of the North Balearic Front during an autumn
tramontane and mistral storm: air–sea coupling processes
and stratification budget diagnostic
Léo Seyfried, Claude Estournel, Patrick Marsaleix, and Evelyne Richard Université de Toulouse, CNRS, UPS, Laboratoire d’Aérologie, Toulouse, France Correspondence:Léo Seyfried ([email protected])
Received: 6 February 2018 – Discussion started: 20 February 2018
Revised: 22 December 2018 – Accepted: 18 January 2019 – Published: 1 March 2019
Abstract. The North Balearic Front forms the southern branch of the cyclonic gyre in the northwestern Mediter-ranean Sea. Its dynamics exhibit significant seasonal vari-ability. During autumn, the front spreads northward during the calm wind periods and rapidly moves back southward when it is exposed to strong northerly wind events such as the tramontane and mistral. These strong winds considerably enhance the air–sea exchanges. To investigate the role of air– sea exchanges in the dynamics of the North Balearic front, we used observations and a high-resolution air–sea coupled modelling system. We focused on a strong-wind event ob-served in late October 2012, which was well-documented during the Hydrological Cycle Mediterranean Experiment. The coupled model was able to correctly reproduce the 4◦C sea surface temperature drop recorded in the frontal zone to-gether with the observed southwestward displacement of the front. The comparison between the weak wind period pre-ceding the event and the strong-wind event itself highlighted the impact of the wind regime on the air–sea coupling. Dur-ing the low-wind period the couplDur-ing is thermal and dynam-ical whereas during the strong-wind period the coupling is mainly thermal. The effect of air–sea exchanges on the strat-ification variations in the frontal zone was investigated with a stratification budget diagnosis. The stratification variations are controlled by diabatic air–sea buoyancy flux, adiabatic Ekman buoyancy flux, and advective processes. During the strong-wind period, the Ekman buoyancy flux was found to be 3 times greater than the air–sea buoyancy flux and thus played a major role in the de-stratification of the frontal zone. The role of Ekman pumping and inertial wave in the advec-tive processes is also discussed.
1 Introduction
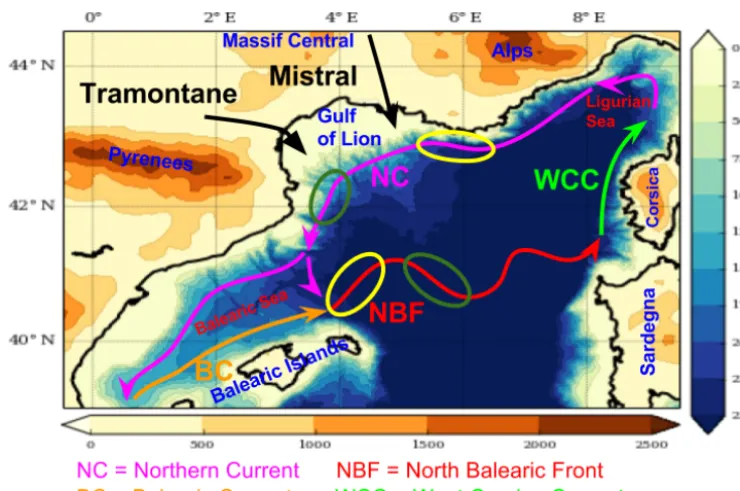
The surface circulation in the northwestern Mediterranean Sea (NWMS) is formed by a cyclonic oceanic gyre (Fig. 1). This cyclonic gyre is closed to the north and west by the Northern Current (Millot, 1999) and to the east by the West Corsica Current (WCC) (Fig. 1). The south branch of the sur-face gyre is defined by a frontal zone, the so-called North Balearic Front (NBF). The NBF is an extension of the Balearic Current (BC), from the Balearic Sea to the Ligurian Sea (Font et al., 1988). This surface density front (100–200 m deep) separates the warm and fresh Atlantic water (AW) which has recently entered the south of the basin from the colder and saltier AW present in the centre of the cyclonic gyre (Millot and Taupier-Letage, 2005). This front forms a Lagrangian barrier (Mancho et al., 2008), which plays an important role in the nutrient budget and planktonic ecosys-tem (Estrada et al., 1999) and marine ecosysecosys-tem distributions (Gannier and Praca, 2007; Cotté et al., 2011).
180 L. Seyfried et al.: Dynamics of the North Balearic Front
Figure 1.Schematic representation of the surface oceanic circulation in the northwestern Mediterranean Sea. Coloured area: orography in brown and bathymetry in blue. The directions of the prevailing mistral and tramontane winds are indicated with black arrows. Up-front and down-front wind zones are indicated with yellow and green ellipses, respectively.
wind is strong, the front shifts southward (Estournel et al., 2016a).
This study focuses on the NBF dynamics during an au-tumn storm. This storm occurs during the Intensive Ob-servation Period (IOP) number 16 (26–29 October 2012) of the HyMeX program (Drobinski et al., 2013; Ducrocq et al., 2013; Estournel et al., 2016b). This IOP can be di-vided into two parts, the first part IOP16a (26 October 2012) was dedicated to heavy precipitation events whereas the second part IOP16b (27–29 October 2012) focussed on strong-wind events. During IOP16a the convergence between southwesterly and southeasterly flows initiated and main-tained strong precipitation offshore and over the southeast-ern French coasts (Duffourg et al., 2016). During IOP16b a severe northerly wind event, associated with tramontane and mistral and a large decrease in the sea surface temper-ature (SST) were observed at the Lion meteorological buoy (Lebeaupin Brossier et al., 2014). Lebeaupin Brossier et al. (2014) explained this large SST drop by the intense surface heat losses producing cooling of surface water and vertical mixing. Estournel et al. (2016a) showed that the large de-crease in SST at the buoy was also associated with the rapid southward displacement of the NBF.
The tramontane and mistral are two strong, dry and cold northwesterly/northerly winds which are channelled by the topography, between the Pyrenees and the Massif Central for the tramontane and between the Massif Central and the Alps for the mistral (Fig. 1). These winds produce strong air–sea exchanges (Flamant, 2003; Hauser et al., 2003) which lead
In the NWMS Lebeaupin Brossier and Drobinski (2009), Small et al. (2012), Renault et al. (2012), and Rainaud et al. (2017) showed the importance of using air–sea coupled mod-elling to represent the rapid variations in air–sea exchanges induced by the decrease in SST during tramontane and mis-tral events. Furthermore, in frontal zones, the air–sea ex-changes are clearly an air–sea coupled process. The SST front and sea surface frontal currents directly impact the air– sea exchanges with significant feedback between the sea and the atmosphere (Small et al., 2008). The atmospheric re-sponse to the front creates wind stress divergence and curl impacting the sea by Ekman pumping (Chelton and Xie, 2010). These air–sea feedbacks in frontal zones may also have a marked influence on the diabatic and Ekman buoy-ancy fluxes (Thomas and Lee, 2005).
The first aim of this paper is to describe the dynamics of the NBF during IOP16 of the HyMeX programme. Our ap-proach combines satellite data, in situ data and air–sea cou-pled simulation at a kilometre scale. A second aim is to eval-uate the air–sea exchanges in the frontal zone and investigate their impact on ocean stratification. In particular, the compet-ing roles of the diabatic buoyancy flux, the adiabatic Ekman buoyancy flux and advective processes will be assessed by means of an original stratification budget diagnosis.
This paper is organised as follows. Section 2 presents the IOP16 case study. In Sect. 3, the results of the air–sea cou-pled simulation are analysed and discussed with respect to the available observations. Then, the NBF dynamics and as-sociated air–sea exchanges are investigated in Sects. 4 and 5, respectively. The computation and results of the stratification budget diagnosis are presented in Sect. 6. Finally, the results are discussed and some conclusions are drawn in Sect. 7.
2 Case study
2.1 Atmospheric conditions
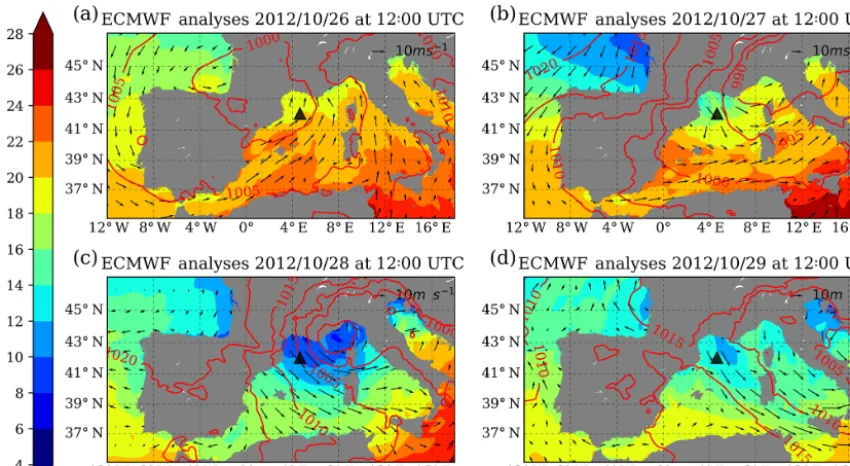
Figure 2 shows the mean sea level pressure (MSLP) and the surface air temperature and wind from the European Centre for Medium-range Weather Forecasts (ECMWF) analysis at 12:00 UTC for IOP16a (26 October 2012) and IOP16b (27, 28 and 29 October 2012). IOP16a (Fig. 2a) was character-ized by low pressure centred over the Pyrenees and a south-westerly wind advecting warm air (temperature above 20◦C) over the NWMS. On the next day (Fig. 2b), the low pres-sure was positioned over the Alps, leading to flow reversal with northwesterly/northerly winds advecting cold air over the NWMS. On 28 October (Fig. 2c) the surface low was deeper and located over the Ligurian Sea. The northerly/northerly wind increased and extended over the west-ern Mediterranean basin with an air temperature lower than 10◦C in the NWMS. Finally, on 29 October (Fig. 2d) the cyclone dissipated and the air temperature increased again.
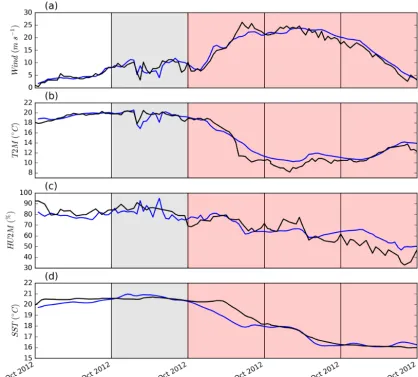
The Lion meteorological buoy, positioned in the abyssal plain of the Gulf of Lion (42.06◦N–4.64◦E, indicated by the black triangle in Fig. 2) and in the tramontane and mistral flows, provides hourly measurements of the 10 m wind, the 2 m temperature and humidity, and the SST (Fig. 3). Dur-ing IOP16a (26 October 2012) the Lion buoy measured low wind speeds between 5 and 10 m s−1. The 2 m temperature and relative humidity remained nearly constant around 20◦C and 80 %, respectively. At 09:00 UTC a brief decrease in wind and 2 m temperature was observed, corresponding the signature of a precipitation event. Then, on 27 October, the wind speed increased from 8 m s−1at 06:00 UTC to a max-imum of 26.2 m s−1at 18:00 UTC. On 28 October, the wind speed remained nearly constant around 22 m s−1and finally decreased on 29 October to less than 5 m s−1at the end of the day. A rapid decrease in the 2 m temperature was observed on 27 October during the wind increase, with a temperature drop of 7.5◦C in a few hours. After this rapid decrease, the 2 m temperature continued to fall slowly, reaching a minimum of 8◦C on 28 October at 09:00 UTC before rising slowly by 3◦C on 29 October. During IOP16b, the 2 m humidity de-creased from 80 % at 00:00 UTC on 27 October to 40 % at 00:00 UTC on 30 October.
To summarise, this autumn tramontane and mistral storm (27, 28 and 29 October 2012) was characterised by northerly/northwesterly winds exceeding 20 m s−1. Mean-while, the surface air temperature and humidity dropped by 10◦C and 40 %, respectively.
2.2 Oceanic conditions
182 L. Seyfried et al.: Dynamics of the North Balearic Front
Figure 2.Atmospheric surface synoptic conditions from ECMWF analyses at 12:00 UTC (a)on 26 October,(b)on 27 October,(c)on 28 October and(d)on 29 October 2012. Coloured area: atmospheric surface temperature in◦C. Contour lines: mean sea level pressure in hPa. Arrows: surface wind. The black triangle indicates the position of the Lion meteorological buoy.
thermal front of 4◦C. At the Lion buoy, the SST in situ mea-surement (Fig. 3d) showed a rapid decrease in SST of about 4◦C between 12:00 UTC on 27 October and 00:00 UTC on 29 October in agreement with the analyses.
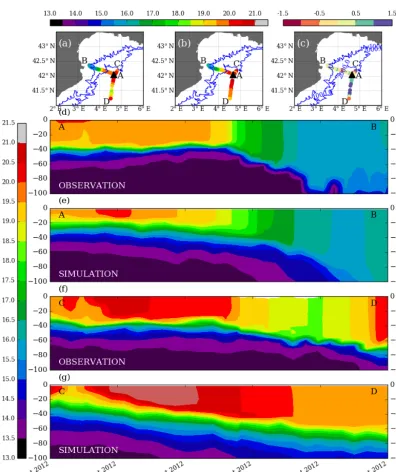
Gliders provided information on the oceanic stratification and the spatial distribution of water masses during IOP16 (see their position in Fig. 4). Two gliders were present near the Lion buoy on 25 October 2012, in the frontal zone (Fig. 5). During the IOP, the first glider, named Eudoxus, moved to the west (Section A–B in Fig. 5). The second glider, named Campe, moved to the south (section C–D in Fig. 5). Before the strong wind, according to the two gliders, the mixed layer depth (MLD) near the Lion buoy was about 40 m, the potential temperature was higher than 19.5◦C in the mixed layer (Fig. 5d and f) and the salinity was lower than 38.2 (not shown). This temperature corresponds to the surface temperature of the cold side of the NBF (Fig. 4a and d). According to the Eudoxus glider (Fig. 5d), between the two ends of the section, the difference in the MLD was about 60 m and the temperature drop about 3.5◦C. These differ-ences resulted from both the crossing of the NBF and the onset of the strong wind. According to the Campe glider (Fig. 5f), which remained on the southern side of the front, the difference in the MLD was 40 m and the temperature in-creased by 0.5◦C. However, along this glider track, the 2◦C temperature drop measured between 27 and 29 October was probably due to the strong-wind event whereas the temper-ature increase observed after 29 October resulted from the southward displacement of the glider (see Fig. 4e).
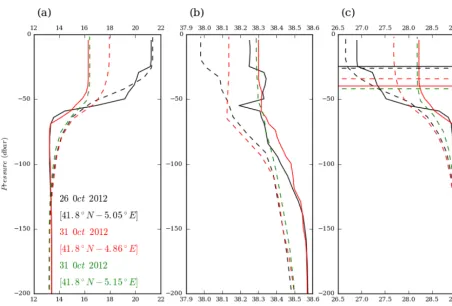
Furthermore, two Argo profiles (see their position in Fig. 4) were available during IOP16 in the frontal zone (Fig. 6). The first profile was obtained on 26 October, 40 km east of the Lion buoy (41.8◦N–5.05◦E), and the second one on 31 October, 30 km east of the Lion buoy (41.8◦N– 4.86◦E). In the mixed layer, the potential temperature drop between the two profiles was large (about 5◦C) while the salinity decrease was about 0.05. Finally, the potential den-sity increase (about 1.32 kg m−3 at the surface) was driven directly by the potential temperature decrease and the MLD deepened from 25 to 40 m.
In summary, the observations showed a rapid decrease in the SST (greater than 4◦C) in the frontal zone. This rapid decrease was associated with the southward displacement of the NBF and a deepening of 20 m of the MLD in the frontal zone. As satellite and in situ data only give a partial view of the NBF dynamics, and in order to better describe and under-stand this process, a high-resolution air–sea coupled simula-tion was performed.
3 Numerical experiment 3.1 Air–sea coupled simulation
cou-Figure 3.Time series at the Lion meteorological buoy of(a)the 10 m wind speed,(b)the 2 m air temperature,(c)the 2 m air humidity and(d)the sea surface temperature. Observations in black and simulations in blue.
pled system was described and validated in Seyfried et al. (2017).
A high-resolution configuration of this coupled system was implemented with a horizontal resolution of 1 km in the oceanic model and of 2.5 km in the atmospheric model. At this resolution, the oceanic model can be considered as eddy-resolving. In the NWMS, the Rossby radius is of the order of 5 to 10 km (Beuvier et al., 2012), which corre-sponds to the effective resolution of the oceanic model. Bosse (2015) showed the ability of the Symphonie oceanic model to reproduce the symmetric instability process at this resolu-tion. However, at this resolution, the oceanic model convec-tion must be parameterised, as described in Estournel et al. (2016a). The non-solar heat fluxes and water fluxes are ac-tually redistributed over the whole mixed layer, in accor-dance with Deardorff et al. (1969). The atmospheric model at 2.5 km can be considered as a convection-permitting model; i.e. the convection is directly resolved by the atmospheric
model equations. In the vertical, the oceanic model uses 40 generalised sigma vertical levels, 10 of them in the first 100 m (above the abyssal plain) with a resolution just be-low the sea surface of 1.5 m. The atmospheric model uses 52 terrain-following vertical levels ranging from 15 to 15 000 m. Using the SURFEX OASIS3-MCT interface (Voldoire et al., 2017), the SST and sea surface current are sent to the SURFEX model, which then returns the wind stress (τ), the shortwave flux (SW), the non-solar heat fluxes (Qns=
184 L. Seyfried et al.: Dynamics of the North Balearic Front
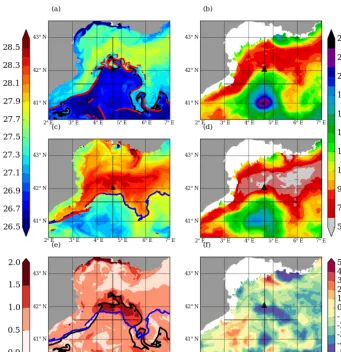
Figure 4.Sea surface temperature analysis from the OSTIA product(a–c), from the Mediterranean Copernicus product(d–f), from the coupled simulation(g–i)at 00:00 UTC on 25 October (a,dandg) and at 00:00 UTC on 30 October (b,eandh), and the difference between 00:00 UTC on 30 and on 25 October (c,fandi). The triangle indicates the Lion buoy. The dots correspond to the position of the Argo profiles shown in Fig. 6 and the dashed lines to the glider sections shown in Fig. 5.
The atmospheric model covers the whole western Mediter-ranean basin (same spatial coverage as in Seyfried et al., 2017). The ocean model covers the western Mediterranean Sea, excluding the Alboran Sea and part of the Tyrrhenian Sea (same grid as in Seyfried et al., 2017). In the oceanic part of the atmospheric grid not covered by the ocean grid, the air–sea fluxes are computed using the sea surface tem-perature provided by the SST OSTIA product (Donlon et al., 2012) and without using sea surface current.
The coupled simulation started at 00:00 UTC on 25 Octo-ber 2012 (24 h before the beginning of IOP16) and ended at 00:00 UTC on 30 October 2012 (at the end of IOP16). The ocean model was initialised with a coupled simulation as described in Seyfried et al. (2017) (from all the simula-tions presented in this paper, the so-called MOON simulation was chosen for its better agreement with the available obser-vations). Spin-up was avoided as the initial state given by the MOON simulation was based on the same oceanic model
configuration and grid. The boundary conditions of the ocean model were provided by the analyses of the MERCATOR-OCEAN operational centre (Lellouche et al., 2013) based on the NEMO model (Maraldi et al., 2013). Initial and boundary conditions of the atmospheric model were provided by the 6 h ECMWF analyses with a horizontal resolution of 1/8◦. 3.2 Simulation validation
Figure 5.SST measurement(a), simulation(b)and bias of the simulation(c), along the trajectory of the glider Eudoxus (moving westward) and Campe (moving southward). Vertical section of potential temperature between 0 and 200 m depth for the Eudoxus glider observa-tion(d)and simulation(e)and the Campe glider observation(f)and simulation(g).
Then, to validate the SST decrease in the NWMS and the NBF dynamics, the SST satellite analyses and the simulated SST were compared (Fig. 4). The simulated temperature field contained more small-scale structures (fronts, eddies, fila-ments) than the corresponding satellite field. The horizon-tal resolution of the latter was, in fact, substantially lower than that of the model. The initial surface temperature and NBF position were well represented by the simulation, but the extension of the warm AW to the east of the Lion buoy was greater than in the observations. At the end of IOP16,
the SST decrease and the NBF southward shifting were also well represented even if the latter was less pronounced than in the observations. At the Lion buoy (Fig. 3d), the SST de-crease of 4◦C was well represented by the simulation but the decrease started 6 h earlier.
186 L. Seyfried et al.: Dynamics of the North Balearic Front
Figure 6.Argo potential temperature(a), salinity(b)and potential density(c)measured (solid line) and simulated (dashed line) at the different dates indicated in the figure. For 31 October, only simulated profiles are given (in green). The horizontal lines(c)indicated the MLD for each density profiles.
was less deep (by about 20 m) and the thermocline thicker, probably because of the insufficient vertical resolution of the model. In comparison with results from the first glider (Eu-doxus), which moved westward, the SST and MLD deepen-ing were well represented. However, at the end of the sec-tion, the MLD was deeper than in the observasec-tion, probably because of the crossing of the Northern Current visible from the slope of the isopycnals, which differed in the simulation and the observations. For the second glider (Campe), which moved southward, the temperature evolution was represented differently by the glider and the simulation due to the pres-ence of small-scale structures in the simulation that were not observed. During strong-wind events, the temperature de-crease was less intense in the simulation but the MLD deep-ening was well represented. Finally, after the strong-wind event (29 October), the temperature increase was not simu-lated. The Argo comparison (Fig. 6) showed good agreement for the initial temperature profile, while a surface negative salinity bias of about 0.2 was shown by the model. At the end of the strong-wind event, the simulation showed a de-crease in temperature and an inde-crease in salinity, density and MLD. The temperature decrease was smaller than in the ob-servations – 3.3◦C compared to 5.3◦C – whereas the salin-ity increase was more important in the simulation than in the
observations: 0.15 compared to 0.05. The increase in density and MLD were smaller than in the observations: 1 kg m−3 and 15 m compared to 1.32 kg m−3 and 25 m, respectively. However, it is worth noting that the observed profile is lo-cated to the north of the NBF, whereas the corresponding one in the simulation is within the frontal zone. When the comparison is made with a simulated profile located slightly further east (41.8◦N–5.15◦E, green dashed line in Fig. 6), the simulation results are much closer to the Argo observa-tions.
4 Characteristics and dynamics of NBF
The NBF dynamics during IOP16 (26 to 30 October 2012) are now examined through an analysis of the air–sea coupled simulation.
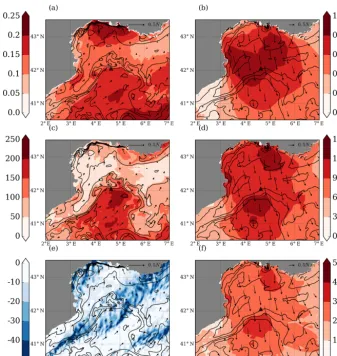
Figure 7a–b represents the surface potential density spa-tial distribution before (00:00 UTC on 26 October), and after (00:00 UTC on 30 October) the IOP16 and Fig. 7c shows the density difference between these two dates. Two specific surface water masses of the NWMS (the relatively light AW to the south and the dense AW to the north) appear clearly in Fig. 7a and b (in blue and yellow–red, respectively). Be-fore IOP16 (Fig. 7a), the Atlantic waters protrude northward forming a meander of light water extending to 42◦N and from 3 to 6◦E. The difference in surface density between the two sides of the front is about 1 kg m−3with a surface density gradient locally greater than 0.1 kg m−3per kilometre. Fila-ments formed at the periphery of the meander extend north-ward. Further to the east (around 6.5◦E) a second intrusion of light water occurs, but its northward extension is smaller and its density front weaker. These two meanders shape the NBF, which can be characterised by the 27.0 kg m−3surface isopycnal. After IOP16 (Fig. 7b), the light water patch is shifted to the southwest and the surface potential density in-creases in the NWMS. The NBF surface density gradient is reduced except along the western part of the meander, and filament structures have dissipated. The NBF is now charac-terised by the 28.0 kg m−3surface isopycnal. Looking at the surface density evolution between the beginning and the end of IOP16, the maximum potential density increase (Fig. 7c), larger than 1.5 kg m−3, is located in the area impacted by the NBF dynamics (along the meander) and along the north coast of the Gulf of Lion. Note the appearance of cold, dense wa-ters along the French coast (around 5.5◦E), a sign of coastal upwelling.
The cumulative effect of the strong-wind event on the stratification of the upper layers can be analysed through the stratification index (SI) (Estournel et al., 2016a).
SI(H )=
0 Z
H
(ρ(H )−ρ(h))dh, (1)
whereρis the potential density (kg m−3) andHthe reference level (m). SI is expressed in kg m−2. It represents the amount of buoyancy to be extracted to mix the water column from the surface to level H and achieve a homogeneous density ρ(H ).
Figure 7d–f shows the SI at 250 m (a depth below which no significant changes are observed) before and after IOP16 and the SI differences between these two periods. Before the IOP16 (Fig. 7d), the light Atlantic water corresponds to higher stratification, with an SI at 250 m greater than 120 kg m−2. Inside this meander, a mesoscale anticyclonic eddy has a noticeable effect on stratification with an SI
higher than 200 kg m−2(around 41◦N and 4.5◦E). The NBF separates this patch of highly stratified water from the less stratified Atlantic water characterised by an SI lower than 90 kg m−2, i.e. a stratification front of about 30 kg m−2. The filaments visible in the surface potential density map (Fig. 7a) are too thin to have a significant impact on the upper layer integrated stratification. The SI evolution dur-ing IOP16 (Fig. 7f) shows a maximum loss of stratification (about 50 kg m−2) in the northern and eastern parts of the NBF meander and a stratification gain (about 20 kg m−2) in the western part of the NBF meander. Outside the frontal re-gion, SI variations appear to be related to the displacement of mesoscale and sub-mesoscale eddies.
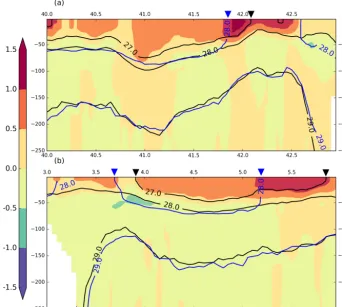
Two vertical sections of potential density are now exam-ined to illustrate the vertical processes. Figure 8 presents the vertical distribution of isopycnals before (black lines in Fig. 8) and after IOP16 (blue lines in Fig. 8) and the sea-water potential density difference (in colours) along north– south (NS) and east–west (EW) sections (indicated by black lines in Fig. 7).
On the NS section (Fig. 8a), before the strong-wind event, the section intersects the NBF meander at 42.1◦N (the NBF position is defined by the 27.0 kg m−3 isopycnal). South of the NBF, a patch of light AW, with a density lower than 27.0 kg m−3, extends over a depth of about 50 m. To the north, the light water thins to 10 m around 42.4◦N, corre-sponding to the filament structure. This section also inter-sects the mesoscale anticyclonic eddy previously described around 41◦N (explaining the local deepening of the isopyc-nals) and the Northern Current along the bathymetric slope. Between 41.75 and 42.75◦N, the doming of the isopyc-nals corresponds to the cyclonic gyre. After the strong-wind event, the NBF migrates southward by about 0.3◦ (about 35 km), and the NBF position is now defined by the 28.0 kg m−3isopycnal. The maximum increase in potential density (more than 1.5 kg m−3to a depth of 40 m) is obtained in the displacement area of the NBF.
188 L. Seyfried et al.: Dynamics of the North Balearic Front
Figure 7.Sea surface density in kg m−3(a, c, e)and stratification index at 250 m in kg m−2(b, d, f)at 00:00 UTC on 26 October(a, b)and at 00:00 UTC on 30 October(c, d)and the difference between 00:00 UTC on 30 and 26 October(e, f). The black contour(a, e)represents the 27.0 kg m−3isopycnal, the blue contour(c, e)represents the 28.0 kg m−3isopycnal and the red line(a, c)represents the surface density gradient greater than 0.1 kg m−3per kilometre. The straight black lines indicate the position of the vertical sections shown in Fig. 8.
To conclude, during the strong-wind event, a horizontal displacement of the NBF of several tens of kilometres is sim-ulated. This directly impacts the evolution of oceanic strati-fication in the NBF zone. The stratistrati-fication evolution is also impacted by vertical advective processes producing isopyc-nal deepening.
5 Air–sea exchanges
The air–sea exchanges can be divided into three fluxes: the wind stress (τ, in N m−2), the net heat flux (Q
net=SW+
LW+H+LE, in W m−2) and the water flux (F
w=E−P,
in mm h−1).
Figure 9 shows the time evolution of wind stress, net heat flux and water flux calculated at the Lion buoy, positioned in the NBF zone. The wind stress variation (Fig. 9a) corre-sponds to the wind speed variation (Fig. 3a), with a maxi-mum wind stress higher than 1.5 N m−2. On average, the net heat flux (Fig. 9b) was close to zero between 25 and 26
Oc-tober. During this low-wind period the solar heat flux bal-anced the non-solar heat flux. During the strong-wind event, upward (i.e. cooling the sea) net heat fluxes were correlated with the wind speed, with a maximum net heat flux close to 2000 W m−2on 28 October 2012. The water flux (Fig. 9c)
was impacted by the high-precipitation event occurring on 26 October, with a maximum downward instantaneous wa-ter flux of about 25 mm h−1. During the strong-wind event, evaporation dominated and led to an upward (positive) water flux.
maxi-Figure 8. (a)South–north section at 4.65◦E and(b)west–east section at 41.7◦N (see Fig. 7 for their positions) of the potential density dif-ference between 00:00 UTC on 30 October and 00:00 UTC on 25 October. Contour lines: Isopycnals on 25 (black lines) and 30 October 2012 (blue lines).
mum heat loss appears on the warm patch, due to the higher SST, directly impacting turbulent heat fluxes. Downward wa-ter fluxes (Fig. 10e) are organised in bands during this high-precipitation event. During IOP16b, the NWMS is dominated by strong northerly/northwesterly winds (Fig. 10b), corre-sponding to tramontane and mistral events. The maximum wind stress is located in these wind veins, off the Gulf of Lion. The NBF has no clear impact on the wind stress spa-tial distribution. On the other hand, the net heat flux and wa-ter flux are directly impacted by the NBF position, with a maximum heat and water loss higher than 1200 W m−2and 30 mm day−1on the warm side of the front, and cross-frontal differences greater than 200 W m−2and 10 mm day−1.
The wind stress curl during IOP16a and IOP16b is pre-sented in Fig. 11. As explained by Chelton and Xie (2010), surface winds are weaker on the cold side of a thermal front. This produces a divergence when the wind blows across the front and a curl when the wind blows parallel to the front. In the case of the NBF meander during the low-wind period of IOP16a, Fig. 11a indicates the wind curl modifications linked to the front. In the eastern part of the meander, a negative along-front wind stress curl appears clearly, and, in the west-ern part of the meander, a positive along-front wind stress
curl also appears clearly. During IOP16b the wind stress curl appears principally around the tramontane and mistral wind corridors. A positive (negative) wind stress curl corresponds to the left cyclonic (right anticyclonic) side of the wind vein. In the eastern part of the NBF meander (around 5◦E and 41.8◦N) a positive wind stress curl appears. However, it is difficult to know whether the wind stress curl is directly con-nected to the NBF meander or to the fine wind jet structures. Finally, during the strong-wind event, unlike the situation in the low-wind event, the NBF meander does not appear to have a major influence on the wind stress curl.
To conclude, the NBF position and dynamics directly im-pact the spatial and temporal distributions of air–sea heat and water exchanges. Furthermore, during the low-wind period, the NBF also impacts the wind stress with the generation of along-front wind stress curl.
6 Stratification budget diagnosis
turbu-190 L. Seyfried et al.: Dynamics of the North Balearic Front
Figure 9.Time series of(a)the wind stress,(b)the net heat flux and(c)the water flux simulated at the Lion meteorological buoy.
lent mixing of heat and water at the air–sea interface. Follow-ing Mertens and Schott (1998), the air–sea exchanges induce a surface or diabatic buoyancy flux that can be diagnosed as B0=gα
Qnet ρ0Cp
+g βSSS(E−P ), (2)
whereB0is the diabatic buoyancy flux in m2s−3,αthe
ther-mal expansion coefficient in K−1,Cpthe specific heat
capac-ity in J kg−1K−1,β the saline contraction coefficient, SSS the sea surface salinity,Ethe evaporation andP the precipi-tation in m s−1.
This one-dimensional approximation is suitable if the ocean is horizontally homogeneous. In reality, mesoscale and sub-mesoscale structures populate the ocean. Theses struc-tures are marked by horizontal buoyancy fronts. As shown by Thomas and Lee (2005) and Thomas and Ferrari (2008), the stratification can be significantly modified by interac-tions between these fronts and Ekman flow generated by fric-tional forcing. When the winds are down-front, the density advection of dense water over light water by Ekman trans-port destabilises the water column and triggers convection. This process de-stratifies the water column by Ekman advec-tion of buoyancy and mixing through the mixed layer. On the contrary when the winds are up-front the Ekman flow yields
an Ekman advective re-stratification in the surface layer. Fol-lowing Thomas and Taylor (2010), the frictional forcing in-duces a wind-driven or Ekman buoyancy flux (EBF), which can be diagnosed as
EBF= −g ρ0
Me· ∇hρ(z=0), (3)
where the EBF is in m2s−3, M
e is the Ekman transport
(Eq. 4) in m2s−1, ∇h is the horizontal gradient, g is the gravitational acceleration andρ(z=0) is the surface density in kg m−3.
Me=
ˆ z×τ
ρ0ζa
, (4)
wherezis the vertical unit vector,τthe wind stress in N m−2,
andζathe absolute vorticity in s−1.
stratifi-Figure 10. (a, b)Wind stress (N m−2);(c, d)net surface heat flux (W m−2);(e, f)surface water flux (mm day−1) averaged over IOP16a(a, c, e)and IOP16b(b, d, f). Contour lines: sea surface density averaged over IOP16a(a, c, e)and IOP16bb, d, f; contour interval: 0.3 kg m−3).
cation budget diagnosis we evaluate the residual term corre-sponding to other potential sources of horizontal and vertical advection of buoyancy (geostrophic circulation, frontogene-sis, Ekman pumping, etc.) that are not directly diagnosed in this study.
1SI(H )=SI(H )T2−SI(H )T1= ρ0
g T2 Z
T1
B0(t )·dt
+ρ0 g
T2 Z
T1
EBF(t )·dt+R, (5)
where the first and second right-hand-side terms represent the mass fluxes, induced by diabatic and friction processes, respectively, whereas the third term induces all the remaining processes.
Figures 12 and 13 present the spatial distribution of the dif-ferent terms of the stratification budget diagnosis (Eq. 5) for IOP16a and IOP16b. During the low-wind period (IOP16a), the stratification (Fig. 12a) decreases (increases) by about
192 L. Seyfried et al.: Dynamics of the North Balearic Front
Figure 11. Wind stress curl (N m−3×10⁶) averaged over IOP16a(a)and IOP16b(b). Contour lines: sea surface density aver-aged over IOP16a(a)and IOP16b(b); contour interval: 0.3 kg m−3.
−45 kg m−2(15 to 30 kg m−2). In a second order, the residual
term (Fig. 13d) also plays a role in how stratification evolves in the NBF zone, particularly in the western part of the NBF meander, with a stratification gain.
Figure 14 shows the time evolution of the different terms of the stratification budget (Eq. 5) in the eastern and west-ern parts of the NBF meander. Firstly, the presence of os-cillations produced by inertial waves can be noted on the evolution of the stratification. These oscillations have a pe-riod of about 1 h and an amplitude of about 10 kg m−2. Ex-cept for these oscillations, the stratification remains approx-imately constant from 25 to 27 October (IOP16a). During IOP16b, the stratification decreases (increases) from 122 to 69 kg m−2(from 86 to 102 kg m−2) along the eastern (west-ern) part of the NBF meander. Along the east of the NBF meander (Fig. 14a), the stratification decrease (53 kg m−2) is
due to the buoyancy fluxes and, more precisely, the Ekman buoyancy flux, (45 kg m−2 compared to 17 kg m−2 for dia-batic buoyancy mass flux). In this region, the advective pro-cesses remain negligible (about 1 kg m−2). Along the west of the NBF meander (Fig. 14b), the stratification decreases by about 5 kg m−2during the low-wind period and increases by about 20 kg m−2 during the strong-wind period. The
strati-fication decrease during the low-wind period is driven by a negative Ekman buoyancy flux. During the strong-wind pe-riod, the Ekman buoyancy flux of 20 kg m−2balances the
dia-batic buoyancy loss of 18 kg m−2. The residual term of about 18 kg m−2plays a major role in the stratification increase in this zone.
The residual term is not negligible in our stratification bud-get diagnosis, particularly along the western part of the NBF meander. A source of this term is the vertical advection gen-erated by the Ekman pumping directly connected to the wind stress curl (Eq. 6).
We=
∇ ×τ
ρ0ζa
(6)
To illustrate this, Fig. 15 shows the 28.5 kg m−3 isopyc-nal depth variation and the Ekman pumping averaged over IOP16a and IOP16b. During IOP16a, the isopycnal depth variation (Fig. 15a) is directly anti-correlated with the resid-ual term of the stratification budget (Fig. 12d). The stratifi-cation decreases in ascending isopycnal zones and increases in subsiding isopycnal zones. This anti-correlation illustrates the major role of the vertical processes in the residual term. The Ekman pumping, generated by the interaction between the wind and the front, is an important source of this vertical advection (Fig. 15c). Although, at the scale of the whole do-main, the Ekman pumping does not appear to be correlated with the change in the level of the isopycnals, this is not the case along some parts of the meander such as its western part, where the angle between the wind and the isopycnals is small and the Ekman pumping seems to contribute to the change in stratification. During IOP16b, the isopycnal depth variations (Fig. 15b) are also anti-correlated with the residual term of the stratification budget (Fig. 13d). In the western, unlike in the eastern, part of the NBF meander, the isopycnal deepen-ing is clearly produced by the Ekman pumpdeepen-ing (Fig. 15d). Another source of vertical advection in frontal zones is the ageostrophic secondary circulation cell generated by down-front wind and down-frontogenesis processes (Thomas and Lee, 2005), with upward and downward vertical currents, respec-tively, in the light and dense parts of front. It is probably this circulation that impacts the isopycnal depth in this zone.
In conclusion, to a first-order approximation, the strati-fication variations in the eastern part of the NBF (down-front wind) during IOP16b are principally driven by the Ek-man buoyancy flux generated by the interactions between the strong-wind event and the NBF. However, the residual term of stratification budget diagnosis is not negligible, particu-larly in the western part of the front through an Ekman pump-ing effect.
7 Summary and discussion
Figure 12.Stratification variation budget diagnosis (Eq. 5) during IOP16a:(a)SI difference,(b)diabatic buoyancy mass flux,(c)Ekman buoyancy mass flux and(d)residual term. Red circles indicate the areas chosen for the budget diagnostic in Fig. 14.
194 L. Seyfried et al.: Dynamics of the North Balearic Front
Figure 14.Time series of the different terms of the stratification budget diagnosis (SI in black, diabatic buoyancy flux in blue, Ekman buoyancy flux in red, total buoyancy flux in magenta and residual in green):(a)for the eastern part of the NBF meander (averaged over 10 km2around 41.9◦N and 5.1◦E) and(b)for the western part of the NBF meander (averaged over 10 km2around 41.6◦N and 3.9◦E; see Figs. 12 and 13). In order to compare the different terms, all the curves start with the same value, which is the initial SI.
which, during a first period (IOP16a), was characterised by weak southwesterly winds followed, in period IOP16b, by a strong northerly wind event.
Before IOP16, the light AW present south of the NBF spread up to 42◦N. After IOP16, the observations showed a southward displacement of the NBF, of several tens of kilo-metres, with a rapid decrease in SST, larger than 4◦C in the frontal zone. To better describe and understand the NBF dynamics during this case study, we performed an air–sea coupled simulation at a kilometre scale. This simulation is in good agreement with the observations and has the abil-ity to reproduce meso- and sub-mesoscale structures (ed-dies, fronts, filaments). The simulation showed that, before the strong northerly wind event, the NBF reached the Lion buoy and surface filaments of light water (not visible in the satellite SST) became detached and were entrained north-ward. During the strong-wind event, the simulation repro-duced the rapid displacement of NBF, of several tens of kilo-metres, and the SST decrease of 4◦C at the Lion buoy. Fur-thermore, the filaments were dissipated. As suggested by Es-tournel et al. (2016a), the SST decrease at the Lion buoy was associated with the NBF dynamics. These dynamics also im-pacted the oceanic stratification with a significant loss (gain)
of about 40 kg m−2 (20 kg m−2) of stratification along the eastern (western) part of the NBF meander.
During the period of light southwesterly wind, the NBF clearly impacted the wind stress and the net heat flux through two effects: first a decrease in the air–sea exchanges on the cold side of the NBF (to the north) and second, as explained by Chelton and Xie (2010), the formation of a wind stress curl.
rep-Figure 15.Panels(a, b)show 28.5 kg m−3isopycnal deepening (m), and(c, d)Ekman pumping (m) during IOP16a(a, c)and IOP16b(b, d). Contour lines: sea surface density averaged over IOP16a(a, c)and IOP16b(b, d). Contour interval: kg m−3.
resentation of the frontal dynamics is essential to correctly depict the space and time evolution of the air–sea exchanges. Finally, a stratification budget diagnosis was performed during the low- and strong-wind periods. The results differed greatly according to the wind regime. During the low-wind period, the evolution of the stratification in the frontal zone was directly controlled by the advective processes whereas, during the strong-wind period, it was controlled by the Ek-man buoyancy flux, which could be up to 3 times stronger than the diabatic heat flux in the eastern part of the NBF. This flux directly impacted the frontal dynamics and the stratification variations. The stratification increased by up to 20 kg m−2 in the western part of the NBF meander (where the wind was parallel to and in the same direction as the cur-rent) and decreased by up to 40 kg m−2in the eastern part of the NBF meander (where the wind was parallel but in the op-posite direction to the current). The advective processes also played a role in the evolution of stratification. One of these processes clearly appears to be the Ekman pumping. Finally, the inertial waves also impacted the stratification, with vari-ations of the order of 10 kg m−2.
To the best of our knowledge, this study is the first realistic study that uses an air–sea coupled model to evaluate the im-pact of Ekman buoyancy fluxes on an oceanic front that is not topographically controlled. Without bathymetric constraint,
the front moves by several tens of kilometres during the strong-wind events. This displacement is associated with a marked loss of buoyancy and a rapid de-stratification, largely induced by the wind–front interaction. In an academic study, Thomas (2005) described a frontogenesis process generated by the Ekman buoyancy flux. This process is not reproduced in our study probably because of the absence of bathymetric constraint and front displacement. On the contrary, after the strong-wind event, the surface density gradient is less marked (Fig. 7). In our case study the frontal dynamics clearly appear to be an air–sea coupling process. However, the impact of this coupling depends directly on the wind regime, as suggested by Small et al. (2008). During low-wind periods, the NBF af-fects the diabatic buoyancy flux and the interactions between the thermal front and the Ekman pumping generated by wind stress and can also impact the Ekman buoyancy flux. This in-teraction is, therefore, air–sea thermal and dynamic coupling. During strong-wind periods, the NBF position and dynamics clearly affect the diabatic buoyancy flux. They also affect the wind stress, but only weakly. There is, therefore, mainly air– sea thermal coupling.
pro-196 L. Seyfried et al.: Dynamics of the North Balearic Front
cesses have an important effect on the stratification evolu-tion. In future work, the various sources of advection could be distinguished in the stratification budget to better under-stand the coupling effects, particularly the Ekman pumping. The interaction between inertial waves and front could also be studied in detail. For example, Thomas et al. (2016) show that the Ekman buoyancy flux is more efficient when the in-ertial waves reduce the stratification.
This case study of the North Balearic Front highlights the major role of Ekman buoyancy fluxes in frontal dynam-ics and stratification evolution. The Ekman buoyancy fluxes could significantly influence the open-ocean deep convection that occurs in the centre of the cyclonic gyre of the Gulf of Lion during winter as shown by Giordani et al. (2016), who highlight a large impact along the eastern and north-ern branches of the Northnorth-ern Current (NC). Estournel et al. (2016a) suggest that the autumnal NBF dynamics could play a major role in the preconditioning of the deep convection. Our study shows that this process is principally driven by Ekman buoyancy fluxes. In future work, the impact of the Ekman buoyancy flux, all around the cyclonic gyre circula-tion, could be quantified during the different phases of the open-ocean deep convection.
Data availability. The Argo data were collected and made freely available by the CORIOLIS project (http://doi.org/10.17882/ 42182).
Author contributions. The work was carried out by LS as a PhD candidate under the supervision of CE, PM and ER. All authors worked on the paper.
Competing interests. The authors declare that they have no conflict of interest.
Acknowledgements. This work is a contribution to the MIS-TRALS/HyMeX programme through the ASICS-MED (ANR-12-BS06-0003) project funded by the French National Agency for Research (ANR). Data were obtained from the HyMeX programme, sponsored by grants from MISTRALS/HyMeX and Météo-France. The authors acknowledge the international Argo programme, the LEFE/GMMC programme and the French NAOS project for supporting the deployment of profilers. Argo and CTD data were collected and made freely available by the CORIOLIS project (http://www.coriolis.eu.org, last access: 8 February 2019) and programmes that contribute to it. We acknowledge the crews of R/V Suroit and Tethys II and the scientists involved in the different cruises mentioned in this paper. Numerical simulations were performed using HPC resources of CALMIP (CALcul en MIdi-Pyrénées, projects 1247, 09115 and 1325) and GENCI (Grand Equipement National de Calcul Intensif, project 010569).
Edited by: Simon Josey
Reviewed by: two anonymous referees
References
Beuvier, J., Béranger, K., Lebeaupin Brossier, C., Somot, S., Se-vault, F., Drillet, Y., Bourdallé-Badie, R., Ferry, N., and Lyard, F.: Spreading of the Western Mediterranean Deep Water after winter 2005: Time scales and deep cyclone transport, J. Geophys. Res., 117, C07022, https://doi.org/10.1029/2011JC007679, 2012. Bosse, A.: Circulation générale et couplage physique-biogéochimie
à (sous-) mésoéchelle en Méditerranée Nord-occidentale à partir de données in situ, Ph.D. thesis, Paris 6, http://www.theses.fr/ 2015PA066451, 2015.
Buongiorno Nardelli, B., Tronconi, C., Pisano, A., and Santoleri, R.: High and Ultra-High resolution processing of satellite Sea Surface Temperature data over Southern European Seas in the framework of MyOcean project, Remote Sens. Environ., 129, 1– 16, https://doi.org/10.1016/j.rse.2012.10.012, 2013.
Chelton, D. B. and Xie, S.-P.: Coupled ocean-atmosphere in-teraction at oceanic mesoscales, Oceanography, 23, 52–69, https://doi.org/10.5670/oceanog.2010.05, 2010.
Cotté, C., d’Ovidio, F., Chaigneau, A., Lévy, M., Taupier-Letage, I., Mate, B., and Guinet, C.: Scale-dependent interac-tions of Mediterranean whales with marine dynamics, Limnol. Oceanogr., 56, 219–232, 2011.
Deardorff, J. W., Willis, G. E., and Lilly, D. K.: Laboratory investi-gation of non-steady penetrative convection, J. Fluid Mech., 35, 7–31, 1969.
Donlon, C. J., Martin, M., Stark, J., Roberts-Jones, J., Fiedler, E., and Wimmer, W.: The Operational Sea Surface Temperature and Sea Ice Analysis (OSTIA) system, Remote Sens. Environ., 116, 140–158, https://doi.org/10.1016/j.rse.2010.10.017, 2012. Drobinski, P., Ducrocq, V., Alpert, P., Anagnostou, E., Béranger, K.,
Borga, M., Braud, I., Chanzy, A., Davolio, S., Delrieu, G., Es-tournel, C., Boubrahmi, N. F., Font, J., Grubišic, V., Gualdi, S., Homar, V., Ivancan-Picek, B., Kottmeier, C., Kotroni, V., Lagou-vardos, K., Lionello, P., Llasat, M. C., Ludwig, W., Lutoff, C., Mariotti, A., Richard, E., Romero, R., Rotunno, R., Roussot, O., Ruin, I., Somot, S., Taupier-Letage, I., Tintore, J., Uijlenhoet, R., and Wernli, H.: HyMeX: A 10-Year Multidisciplinary Program on the Mediterranean Water Cycle, Am. Meterol. Soc., 95, 1063– 1082, https://doi.org/10.1175/BAMS-D-12-00242.1, 2013. Ducrocq, V., Braud, I., Davolio, S., Ferretti, R., Flamant, C., Jansa,
Duffourg, F., Nuissier, O., Ducrocq, V., Flamant, C., Chazette, P., Delanoë, J., Doerenbecher, A., Fourrié, N., Di Girolamo, P., Lac, C., Legain, D., Martinet, M., Saïd, F., and Bock, O.: Offshore deep convection initiation and maintenance during the HyMeX IOP 16a heavy precipitation event, Roy. Meterol. Soc., 142, 259– 274, https://doi.org/10.1002/qj.2725, 2016.
Estournel, C., Testor, P., Damien, P., D’Ortenzio, F., Marsaleix, P., Conan, P., Kessouri, F., Durrieu de Madron, X., Cop-pola, L., Lellouche, J.-M., Belamari, S., Mortier, L., Ulses, C., Bouin, M.-N., and Prieur, L.: High resolution modeling of dense water formation in the north-western Mediterranean dur-ing winter 2012–2013, Processes and Budget, 121, 5367–5392, https://doi.org/10.1002/2016JC011935, 2016a.
Estournel, C., Testor, P., Taupier-Letage, I., Bouin, M.-N., Coppola, L., Durand, P., Conan, P., Bosse, A., Brilouet, P.-E., Beguery, L., Belamari, S., Béranger, K., Beuvier, J., Bourras, D., Canut, G., Doerenbecher, A., Durrieu de Madron, X., D’Ortenzio, F., Drobinski, P., Ducrocq, V., Fourrié, N., Giordani, H., Houpert, L., Labatut, L., Brossier, C. L., Nuret, M., Prieur, L., Roussot, O., Seyfried, L., and Somot, S.: HyMeX-SOP2 The Field Cam-paign Dedicated to Dense Water Formation in the Northwestern Mediterranean, Oceanography, 29, 196–206, 2016b.
Estrada, M., Varela, R. A., Salat, J., Cruzado, A., and Arias, E.: Spatio-temporal variability of the winter phytoplankton distribu-tion across the Catalan and North Balearic fronts (NW Mediter-ranean), J. Plankton Res., 21, 1–20, 1999.
Flamant, C.: Alpine lee cyclogenesis influence on air-sea heat exchanges and marine atmospheric boundary layer thermodynamics over the western Mediterranean during a Tramontane/Mistral event, J. Geophys. Res., 108, 8057, https://doi.org/10.1029/2001JC001040, 2003.
Font, J., Salat, J., and Tintoré, J.: Permanent features of the circulation in the Catalan Sea, Oceanol. Ac., 51–57, http:// archimer.ifremer.fr/doc/00267/37808/ (last access: 8 February 2019), 1988.
Gannier, A. and Praca, E.: SST fronts and the summer sperm whale distribution in the north-west Mediter-ranean Sea, J. Mar. Biol. Assoc. UK, 87, 187–193, https://doi.org/10.1017/S0025315407054689, 2007.
García, M. J. L., Millot, C., Font, J., and García-Ladona, E.: Surface circulation variability in the Balearic Basin, J. Geophys. Res., 99, 3285–3296, https://doi.org/10.1029/93JC02114, 1994.
Giordani, H., Lebeaupin-Brossier, C., Léger, F., and Caniaux, G.: A PV-approach for dense water formation along fronts: Application to the Northwestern Mediterranean, J. Geophys. Res., 143, 2448– 2462, https://doi.org/10.1002/2016JC012019, 2016.
Hauser, D., Branger, H., Bouffies-Cloché, S., Despiau, S., Drennan, W. M., Dupuis, H., Durand, P., Durrieu de Madron, X., Estournel, C., Eymard, L., Flamant, C., Graber, H. C., Guérin, C., Kahma, K., Lachaud, G., Lefèvre, J.-M., Pelon, J., Pettersson, H., Piguet, B., Queffeulou, P., Tailliez, D., Tournadre, J., and Weill, A.: The FETCH experiment: An overview, J. Geophys. Res., 108, 8053, https://doi.org/10.1029/2001JC001202, 2003.
Lafore, J. P., Stein, J., Asencio, N., Bougeault, P., Ducrocq, V., Duron, J., Fischer, C., Héreil, P., Mascart, P., Masson, V., Pinty, J. P., Redelsperger, J. L., Richard, E., and Arellano, J. V.-G. d.: The Meso-NH Atmospheric Simulation System. Part I: adiabatic formulation and control simulations, Ann. Geophys., 16, 90–109, https://doi.org/10.1007/s00585-997-0090-6, 1998.
Lebeaupin Brossier, C. and Drobinski, P.: Numerical high-resolution air-sea coupling over the Gulf of Lions during two tramontane/mistral events, J. Geophys. Res., 114, D10110, https://doi.org/10.1029/2008JD011601, 2009.
Lebeaupin Brossier, C., Arsouze, T., Béranger, K., Bouin, M.-N., Bresson, E., Ducrocq, V., Giordani, H., Nuret, M., Rain-aud, R., and Taupier-Letage, I.: Ocean Mixed Layer responses to intense meteorological events during HyMeX-SOP1 from a high-resolution ocean simulation, Ocean Model., 84, 84–103, https://doi.org/10.1016/j.ocemod.2014.09.009, 2014.
Lellouche, J.-M., Le Galloudec, O., Drévillon, M., Régnier, C., Greiner, E., Garric, G., Ferry, N., Desportes, C., Testut, C.-E., Bricaud, C., Bourdallé-Badie, R., Tranchant, B., Benkiran, M., Drillet, Y., Daudin, A., and De Nicola, C.: Evaluation of global monitoring and forecasting systems at Mercator Océan, Ocean Sci., 9, 57–81, https://doi.org/10.5194/os-9-57-2013, 2013. Mancho, A. M., Hernández-García, E., Small, D., Wiggins, S., and
Fernández, V.: Lagrangian Transport through an Ocean Front in the Northwestern Mediterranean Sea, J. Phys. Oceanogr., 38, 1222–1237, https://doi.org/10.1175/2007JPO3677.1, 2008. Maraldi, C., Chanut, J., Levier, B., Ayoub, N., De Mey, P., Reffray,
G., Lyard, F., Cailleau, S., Drévillon, M., Fanjul, E. A., Sotillo, M. G., Marsaleix, P., and Team, M.: NEMO on the shelf: assess-ment of the Iberia-Biscay-Ireland configuration, Ocean Sci., 9, 745–771, https://doi.org/10.5194/os-9-745-2013, 2013. Marsaleix, P., Auclair, F., Floor, J. W., Herrmann, M. J.,
Estour-nel, C., Pairaud, I., and Ulses, C.: Energy conservation issues in sigma-coordinate free-surface ocean models, Ocean Model., 20, 61–89, https://doi.org/10.1016/j.ocemod.2007.07.005, 2008. Marsaleix, P., Auclair, F., Duhaut, T., Estournel, C.,
Nguyen, C., and Ulses, C.: Alternatives to the Robert-Asselin filter, Ocean Model., 41, 53–66, https://doi.org/10.1016/j.ocemod.2011.11.002, 2012.
Marshall, J. and Schott, F.: Open-ocean convection: Obser-vations, theory, and models, Rev. Geophys., 37, 1–64, https://doi.org/10.1029/98RG02739, 1999.
Masson, V., Le Moigne, P., Martin, E., Faroux, S., Alias, A., Alkama, R., Belamari, S., Barbu, A., Boone, A., Bouyssel, F., Brousseau, P., Brun, E., Calvet, J.-C., Carrer, D., Decharme, B., Delire, C., Donier, S., Essaouini, K., Gibelin, A.-L., Giordani, H., Habets, F., Jidane, M., Kerdraon, G., Kourzeneva, E., Lafaysse, M., Lafont, S., Lebeaupin Brossier, C., Lemonsu, A., Mahfouf, J.-F., Marguinaud, P., Mokhtari, M., Morin, S., Pigeon, G., Sal-gado, R., Seity, Y., Taillefer, F., Tanguy, G., Tulet, P., Vincendon, B., Vionnet, V., and Voldoire, A.: The SURFEXv7.2 land and ocean surface platform for coupled or offline simulation of earth surface variables and fluxes, Geosci. Model Dev., 6, 929–960, https://doi.org/10.5194/gmd-6-929-2013, 2013.
Mertens, C. and Schott, F.: Interannual variability of deep-water for-mation in the northwestern Mediterranean, J. Phys. Oceanogr., 28, 1410–1424, 1998.
Michaud, H., Marsaleix, P., Leredde, Y., Estournel, C., Bourrin, F., Lyard, F., Mayet, C., and Ardhuin, F.: Three-dimensional mod-elling of wave-induced current from the surf zone to the inner shelf, Ocean Sci., 8, 657–681, https://doi.org/10.5194/os-8-657-2012, 2012.
198 L. Seyfried et al.: Dynamics of the North Balearic Front
Millot, C. and Taupier-Letage, I.: Circulation in the Mediterranean Sea, in: The Mediterranean Sea, edited by: Saliot, A., no. 5K in Handbook of Environmental Chemistry, Springer Berlin Heidel-berg, 29–66, https://doi.org/10.1007/b107143, 2005.
Moon, I.-J., Ginis, I., Hara, T., and Thomas, B.: A Physics-Based Parameterization of Air-Sea Momentum Flux at High Wind Speeds and Its Impact on Hurricane Inten-sity Predictions, Mon. Weather Rev., 135, 2869–2878, https://doi.org/10.1175/MWR3432.1, 2007.
Rainaud, R., Lebeaupin Brossier, C., Ducrocq, V., and Giordani, H.: High-resolution air-sea coupling impact on two heavy precipi-tation events in the Western Mediterranean, Roy. Meteor. Soc., 122, 995–1015, https://doi.org/10.1002/qj.3098, 2017.
Rainville, L., Jayne, S. R., McClean, J. L., and Maltrud, M. E.: For-mation of Subtropical Mode Water in a high-resolution ocean simulation of the Kuroshio Extension region, Ocean Model., 17, 338–356, https://doi.org/10.1016/j.ocemod.2007.03.002, 2007. Renault, L., Chiggiato, J., Warner, J. C., Gomez, M., Vizoso, G.,
and Tintore, J.: Coupled atmosphere-ocean-wave simulations of a storm event over the Gulf of Lion and Balearic Sea, J. Geophys. res., 117, 1–25, https://doi.org/10.1029/2012JC007924, 2012. Seyfried, L., Marsaleix, P., Richard, E., and Estournel, C.:
Mod-elling deep-water formation in the north-west Mediterranean Sea with a new air-sea coupled model: sensitivity to tur-bulent flux parameterizations, Ocean Sci., 13, 1093–1112, https://doi.org/10.5194/os-13-1093-2017, 2017.
Small, R. J., deSzoeke, S. P., Xie, S. P., O’Neill, L., Seo, H., Song, Q., Cornillon, P., Spall, M., and Minobe, S.: Air-sea interaction over ocean fronts and eddies, Dynam. Atmos. Oceans, 45, 274– 319, https://doi.org/10.1016/j.dynatmoce.2008.01.001, 2008. Small, R. J., Carniel, S., Campbell, T., Teixeira, J., and
Allard, R.: The response of the Ligurian and Tyrrhe-nian Seas to a summer Mistral event: A coupled atmosphere-ocean approach, Ocan Model., 48, 30–44, https://doi.org/10.1016/j.ocemod.2012.02.003, 2012.
Taylor, J. R. and Ferrari, R.: Buoyancy and Wind-Driven Con-vection at Mixed Layer Density Fronts, J. Phys. Oceanogr., 40, 1222–1242, https://doi.org/10.1175/2010JPO4365.1, 2010. Thomas, L. and Ferrari, R.: Friction, Frontogenesis, and the
Stratifi-cation of the Surface Mixed Layer, J. Phys. Oceanogr., 38, 2501– 2518, https://doi.org/10.1175/2008JPO3797.1, 2008.
Thomas, L. N.: Destruction of Potential Vorticity by Winds, J. Phys. Oceanogr., 35, 2457–2466, https://doi.org/10.1175/JPO2830.1, 2005.
Thomas, L. N. and Lee, C. M.: Intensification of Ocean Fronts by Down-Front Winds, J. Phys. Oceanogr., 35, 1086–1102, https://doi.org/10.1175/JPO2737.1, 2005.
Thomas, L. N. and Taylor, J. R.: Reduction of the us-able wind-work on the general circulation by forced symmetric instability, Geophys. Res. Lett., 37, L18606, https://doi.org/10.1029/2010GL044680, 2010.
Thomas, L. N., Taylor, J. R., D’Asaro, E. A., Lee, C. M., Kly-mak, J. M., and Shcherbina, A.: Symmetric Instability, Iner-tial Oscillations, and Turbulence at the Gulf Stream Front, J. Phys. Oceanogr., 46, 197–217, https://doi.org/10.1175/JPO-D-15-0008.1, 2016.