EXPERIMENTAL INVESTIGATION OF
PARAMETERS EFFECTING THE
NOISE REDUCTION IN
HERMITICALLY SEALED
RECIPROCATING COMPRESSOR
G.Laxmaiah 1 , Dr. P Ravinder Reddy2 , M N S V Kiran Kumar31 Associate Professor, Chaitanya Bharathi Institute of Technology(CBIT), Hyderabad, India 2 Professor & Head, Mechanical Engineering Department, CBIT, Hyderabad, India.
3 Sr Manager, Tecumseh Products India Pvt Ltd, Hyderabad, India. Email: [email protected], [email protected]
Abstract
Hermetic reciprocating compressors are most commonly used in the refrigeration industry. The main source of noise in refrigerating and air conditioning machinery is the compressor. Reduction of noise in compressors is a complex criterion as many factors such as Shell Thickness, Shell Material, Suction Port Area and Discharge Port Area etc. contribute its effect on the noise and they also interact in a complex manner. In this work a screening test is carried out to find the relative effect of the parameters and their interaction, which can be used as an initial step for further investigations concentrating on the most influencing parameters and their interactions using Taguchi Technique. Here Shell Thickness (ST), Shell Material (SM), Suction Port Area (SPA) and Discharge Port Area (DPA) are chosen as input parameters and the noise is the output parameter. L8 orthogonal array is selected, the factors are assigned and experiments are carried out. Column effect method is used to find the most effective parameters for the noise reduction in the compressor.
Keywords: Reciprocating Compressor, Noise, Orthogonal Array (OA), Column Effect Method.
1. Introduction
reduction in reciprocating compressors. Number of experiments is needed to find out the effect of the parameters, which consumes time and are expensive. To reduce the number of experiments Adler et al. [8], Fisher et al. [9] statistically designed experiments based on the factorial technique to obtain the main and the interaction effects with the response parameter. A designed experiment is the simultaneous evaluation of two or more factors (parameters) for their ability to affect the resultant average or variability of particular product or process characteristics [10]. The quality engineering methods of Taguchi which employ design of experiments provides an efficient and systematic way to optimize the noise in compressor. A lot of investigations were reported in literature on parametric studies taking a few factors in to account. It is found that no work has been reported in the literature concentrating on the complex interaction of the effected parameters on noise in compressor. In the present work an attempt is made to find out the most significant parameters that are contributing to the noise in hermitically sealed compressor. The experimentation is carried out on the compressors with the different specifications.
2. Screening Test
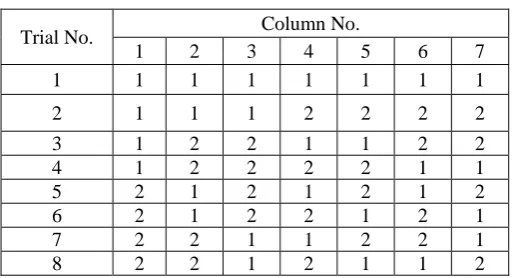
Initially a screening test is planned using a two level L-8 orthogonal array. The factors and their levels are
shown in Table 1. The Standard L-8 orthogonal array is presented in Table 2 and the factors shown in Table 1 are assigned to 1-2-4-7 columns of orthogonal array of Table 2 and the array after assignment of factors is
shown in Table 3.
Table 1: Factors and their levels
Factors Level I Level II Shell Thickness (ST) 2.83mm 3.8mm
Shell Material (SM) Hot Rolled Steel (HRS) Cold Rolled Steel (CRS) Suction Port Area (SPA) 0.9737 cm2 1.0537cm2
Discharge Port Area(DPA) 6.099cm2 9.23cm2
Table 2: Standard L-8 Orthogonal Array
Trial No. Column No.
Table 3: Assignment factors to orthogonal array
Trial No.
COLUMN NUMBER ST
(mm) SM
SPA (cm2)
DPA (cm2) 1 2.83 HRS 0.9737 6.099 2 2.83 HRS 1.0537 9.23 3 2.83 CRS 0.9737 9.23 4 2.83 CRS 1.0537 6.099 5 3.8 HRS 0.9737 9.23 6 3.8 HRS 1.0537 6.099 7 3.8 CRS 0.9737 6.099 8 3.8 CRS 1.0537 9.23
3.Experimental Set Up
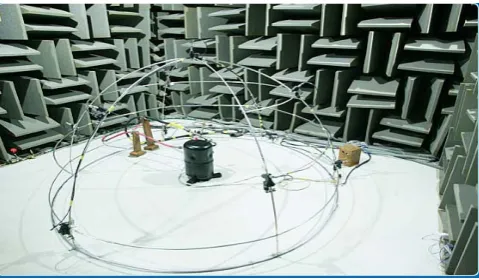
The compressor is placed in a marked location near the center of the room, resting on rubber mounting grommets. The refrigerant lines are flexible hoses, connected to lines through the floor to a load stand located outside the room. The reason for this precaution is to avoid introducing noise from the vibration of copper lines or gas noise through restrictor valves, etc. the cement floor is the mounting base for the compressor and is too massive to respond to the compressor running vibration. The sound test measures only the sound radiating from the compressor housing under normal preset load conditions. The signal from the microphones is fed to a Bruel & Kjcer ( B&K) microphone multiplexer. The signal from the multiplexer is sent to the analyzer where the signal is filtered and broken down into 1/3 octave frequency bands. From the analyzer the signal is sent to the graphic level recorder where the sound pressure level in 1/3 octave bands is converted to Sound Power Level (1 Pico Watt as reference) and plotted on the chart paper.
Fig. 1 Anechoic Chamber 4. Results and Discussion
The compressors with different combinations as per the standard orthogonal array are assembled and kept in the
anechoic chamber as shown in Fig1 and the noise measurements were recorded three times for each run. The
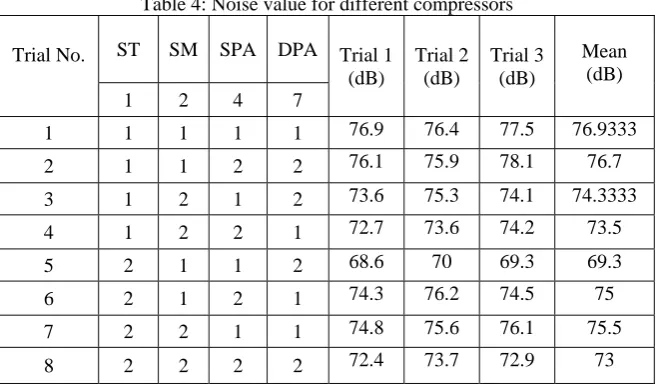
Table 4: Noise value for different compressors Trial No. ST SM SPA DPA Trial 1
(dB)
Trial 2 (dB)
Trial 3 (dB)
Mean (dB) 1 2 4 7
1 1 1 1 1 76.9 76.4 77.5 76.9333 2 1 1 2 2 76.1 75.9 78.1 76.7 3 1 2 1 2 73.6 75.3 74.1 74.3333 4 1 2 2 1 72.7 73.6 74.2 73.5 5 2 1 1 2 68.6 70 69.3 69.3 6 2 1 2 1 74.3 76.2 74.5 75 7 2 2 1 1 74.8 75.6 76.1 75.5 8 2 2 2 2 72.4 73.7 72.9 73
Column effect method, a simplified analysis of variance, proposed by Taguchi is used to subjectively point out columns, which have large influences on the response. The column effect analysis generates information, about which factors make a difference, the relative importance of those factors and which direction for levels of those factors will lead to further improvement. In column effect method sum at level 1 (S1) and level 2 (S2) is computed and the magnitudes of the differences (S1-S2) are compared to each other to find the relatively large effects. The relative magnitudes indicate the relative power of the factors in affecting the results. The strongest factors or interactions will have the largest differences. The level sum that is more desirable from a technical viewpoint indicates whether lower levels or higher levels of the influential factors potentially would have even better results. The sums S1 & S2 and the differences S1-S2 are computed for Noise is presented in tables 5.
Table 5: Sums and difference of sums for the Noise levels ST SM SPA DPA
1 75.3667 74.4833 74.0167 75.2333 2 73.2 74.0833 74.55 73.3333
Δ 2.16667 0.4 0.53333 1.9
From the table 5 it is observed that the differences of sums at level 1 and level 2 (S1-S2) is maximum for Shell thickness followed by Discharge port area. So the most influencing parameter for Noise is Shell thickness (ST) next followed by Discharge port area (DPA).
136 138 140 142 144 146 148 150 152
1 2
Shell thickness Level number
No
i s
e
DPA1 DPA2
Fig 2.Interaction graph between Shell thickness and DPA for Noise
144 146 148 150 152
0 1 2 3
Shell thickness Level number
No
i s
e
SPA1 SPA2
Fig 3.Interaction graph between Shell thickness and SPA for Noise
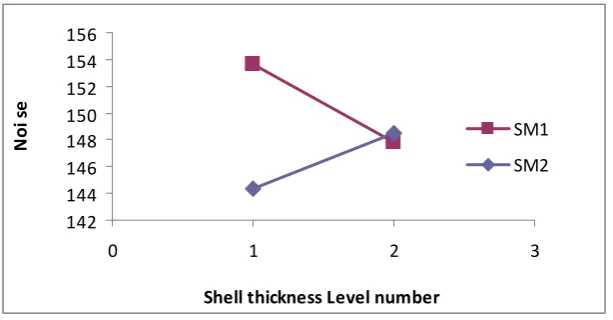
142 144 146 148 150 152 154 156
0 1 2 3
Shell thickness Level number
No
i s
e
SM1 SM2
142 144 146 148 150 152 154
0 1 2 3
Suction port area Level number
No
i s
e
DPA1 DPA2
Fig 5.Interaction graph between Suction port area and Discharge port area for Noise
From the Fig 2, Fig 3, Fig 4 and Fig 5 it is clear that there is considerable interaction between the most
influencing parameters. Hence the effect of influential parameters on noise reduction to be studied combinedly.
5. Conclusions
The following conclusions can be enumerated from the present work.
• The most influencing parameter for the noise is the Shell thickness and is followed by Discharge port area.
• There is considerable interactions between the influencing parameters of the noise
6. References
1. Morse P M., Ingard, K U.,(1971). Theoretical Acoustics” Mc Graw-hill, New York 2. Skudrzyk E (1971). “The foundations of Acoustics”, Springer-Verlag,New York .
3. Cremer L, Heckl M (1973). “Structure born sound” Translated by E E Ungar, Springer- Verlag, New York.
4. Koss L, Alfredson, (1974). “Transient sound from colliding spheres-normalized results, Journal of sound and vibration,,Vol 36,,pp541-554.
5. Dreiman N at all. (1979) “The effect of material properties on the radiation of impact sound from cylinders” Experimental Mechanics,pp331-335.
6. Endo M at all , (1981). “Sound radiation from a circular cylinder subjected to elastic collision by a sphere” Journal of sound and vibration, Vol 75(2),,pp285-302
7. Joon-Hyun Lee and J Kim (2000). “Sound transmission through cylindrical shell of hermetic compressors”. International Compressor Engineering Conference At Purdue, pp 933-940.
8. Adler, Y. P; Markov, E. V; Granovsky, Y. V: The Design of Experiments to Find Optimal Conditions, MIR Publishers, Moskow, 1975.
9. Fisher, R. A: Statistical Methods for Research Workers, 12th edition, Edinburgh, Oliver and Boyd, 1952.
10. Phillip J. Ross: Taguchi Techniques for Quality Engineering, McGraw-Hill, Second Edition, 1996.
11. Smith, P. W., Jr. (1957). “Sound Transmissions through Thin Cylindrical Shells”. Journal of Acoustic Society of America, Vol29, pp712-729.
12. White, P, (1966). “Sound Transmission through a Finite, Closed, Cylindrical Shell”. Journal of Acoustic Society of America, Vol 40, pp 1124-1130.
13. The anatomy of sound Manual by Tecumseh products company Ltd, Michigan.