Abstract—This paper presented an experimental investigation on the behaviour of a quarter-sized three bay five storey reinforced concrete dual structural system subjected to lateral load and their performance were assessed based on load carrying capacity, stiffness, ductility and energy dissipation capacity. The study covered the entire loading range from the initial elastic stage until the ultimate failure stage. Analytical results were obtained using finite element analysis software ANSYS for monotonic loading and push over analysis using SAP2000Nonlinear. Analytical results were compared with experimental results and concluded.
Index Terms—Dual system, ductility, energy dissipation, load carrying capacity, lateral load, stiffness
I. INTRODUCTION
A dual system is a structural system in which an essentially complete frame provides support for gravity loads, and resistance to lateral loads is provided by a specially detailed moment-resisting frame and shear walls or braced frames. Both shear walls and frames participate in resisting the lateral loads resulting from earthquakes or wind or storms, and the portion of the forces resisted by each one depends on its rigidity, modulus of elasticity and its ductility, and the possibility to develop plastic hinges in its parts. The moment-resisting frame may be either steel or concrete, but concrete intermediate frames cannot be used in seismic zones 3 or 4. The moment-resisting frame must be capable of resisting at least 25 percent of the base shear, and the two systems must be designed to resist the total lateral load in proportion to their relative rigidities.
In the dual system, both frames and shear walls contribute in resisting the lateral loads. The frame is a group of beams and columns connected with each other by rigid joints, and the frames bend in accordance with shear mode, whereas the deflection of the shear walls is by a bending mode like the cantilever walls. As a result of the difference in deflection properties between frames and walls, the frames will try to pull the shear walls in the top of the building, while in the bottom, they will try to push the walls. So the frames will resist the lateral loads in the upper part of the building, which means an increase in the dimensions of the cross section area of the columns in the upper part of the frame more than what it needs to resist the gravity loads, while the shear walls will resist most of the vertical loads in the lower part of the
building. So the distribution of the lateral loads in the top depends on the rigidity of the frames where we suppose a spring support, whose rigidity equals the rigidity of the frames in the top, and the reaction of this spring is the share of the frames, and the rest is the share of the walls. So, the walls are pinned or supported by the frames at the top and fixed at the bottom and they are resisting the seismic loads. So we need to find out the value of this reaction at the top which equals a point load as the share of the frames according to the Macloed Theory [1], then the share of the frames will be distributed to each frame due to its rigidity and position relating to the center of mass taking into consideration the torsion and shear resulting from torsion. Naveed Anwar [2] has modeled shear walls as truss models in which boundary elements were considered as columns. The dimension of diagonal strut was considered to be equal to t x t, where„t‟ is the thickness of shear wall. Yaw-Jeng Chiou et al [3] have studied the failure mechanism and ductility of R.C. frame-shear walls for school buildings by the full-scale experiments. Eight specimens subjected to reversed cyclic lateral loading have been tested to failure. The experimental results, as expected, show that the crack load, yield load, and limit load are superior for specimens with higher concrete strength and frame with wall. In addition, the energy consumption of bare frame is greater than that of dual frame. Kuo[4] have conducted experimental tests on dual structures. The maximum redistribution of forces and moments occurs at failure in frame wall systems with the stiff walls and the flexible frames.
II. NEED FOR THE PRESENT WORK
To satisfy the strong column-weak beam collapse mechanism, it is important to understand the progress of damage and failure pattern, which can be obtained by cyclic loading test. The large number of publications available on shear wall structures indicates the importance of these structures in the field of multi-storey building construction and the consequent interest evinced by the structural engineers in trying to understand the behaviour of such structures. From literature review, it has been noticed that a lot of research work was carried out on R.C. shear wall both analytically and experimentally. The actual performance of these systems has not been validated in the laboratory. There is a need to investigate the behaviour of these systems, to quantify their behaviour, validate and improve models of their behaviour, and to determine whether current code provisions properly indicate the relative performance of these systems.
Behaviour of Reinforced Concrete Dual Structural System:
Strength, Deformation Characteristics, and Failure
Mechanism
Govindan Nandini Devi
III. DIMENSIONS OF SPECIMENS
Based on National Building Code (NBC) of India, the various load combinations were considered for the design of prototype at ultimate limit state. The worst combination of 1.2(D.L+L.L+E.L) seismic load (zone III) was adopted for the lateral load design of prototype. Beams and columns were designed in the conventional way as per IS: 456-2000[5]. Shear wall was designed as per IS: 13920-1993[6] for zone III. The model dimensions were fixed using one-fourth scale. The simulated lateral loading at three points in line with the beams was considered for the model.
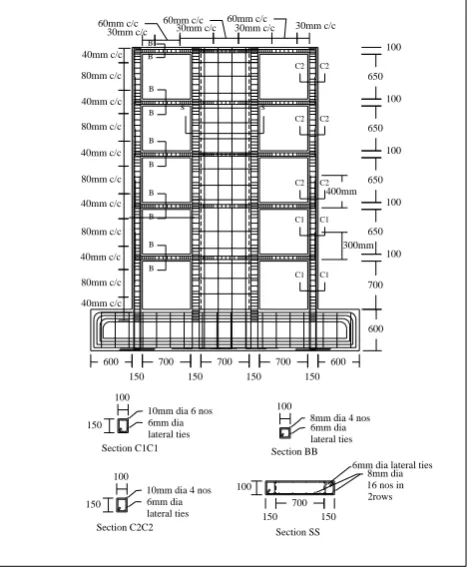
It may be noted that the strength provided matches the moment in the columns of first and second storey. Therefore curtailment is effected without affecting the strength as well as ensuring that plastic hinge does not form any where in the column. The beams have the same strength. The strength variation in beams permits the beam hinges to form before the on set of yield in the column. The details of the sections for the beams, columns and shear wall for the three models are given in Table I and shown in Fig. 1.
IV. SPECIMEN PREPARATION AND TEST SETUP
The frames were cast in the structural engineering laboratory and sufficient precautions were taken so that the specimen could be easily removed from the casting place and erected for testing. The concrete mix was designed as per IS: 269-1976 for a characteristic strength of 30N/mm2 [7]. Four numbers of bolt holes of 50mm diameter were provided in the footing portion of the frame at the same locations as that in foundation block. After 24 hours of concrete curing, the frame and the companion specimens were covered with wet gunny bags and watering was done continuously for 21 days. The frame was lifted and transported to the foundation block with the help of the overhead crane available in the laboratory. The test setup is schematically presented in Fig. 2.
To ensure proper fixity at the base, a suitable pre-cast foundation fastened to the test floor was used. Three load points were located at first, third and fifth storey levels. The
load points roughly simulate the equivalent static seismic load in the frame [Santhakumar 1974]. The static lateral cyclic loads were applied at the jack locations of the frame by double acting jacks of 500kN capacity in push direction. The reaction frame, which is used for loading arrangements, is rigidly fixed to the test floor. The jacks were fixed to the reaction frame. Load was transferred to the specimens by using couplers and the jacks were controlled by a common console. Load cells which were calibrated earlier through proving rings were used to measure the applied load. For the application of load, hand operated oil pumps were used.
300mm 400mm 30mm c/c 60mm c/c 30mm c/c 60mm c/c B 30mm c/c 60mm c/c 30mm c/c 40mm c/c 80mm c/c 40mm c/c 80mm c/c 40mm c/c 80mm c/c 40mm c/c 80mm c/c 40mm c/c 80mm c/c 40mm c/c 600 150 700 150 700 150 600 C1 B B B B B B B B B 700 100 650 100 650 100 650 100 650 100 C1 C1 C1 C2 C2 C2 C2 C2 C2 150 100
10mm dia 6 nos 6mm dia
lateral ties 6mm dia lateral ties 100
8mm dia 4 nos
Section C1C1 Section BB
Section C2C2 6mm dia lateral ties 10mm dia 4 nos 100 150 150 700 150 100 8mm dia 16 nos in 2rows 6mm dia lateral ties
Section SS
s s
700 150 600
Fig. 1. Schematic diagram of model with reinforcement details
9 7
5 7
6
1. FOUNDATION BLOCK 2. PUSH PULL JACK 3. FRAME FOR TEST 4. STEEL STAND TO HOLD LVDT 5. JUNCTION BOX FOR PUSH 6. JUNCTION BOX FOR PULL 7. OIL PUMP UNIT 8. STRONG TEST FLOOR 9. REACTION FRAME 10. LVDT TO MEASURE DISPLACEMENT 11. DEFLECTOMETER 2 11 8 1 11 2 2 3 10 11 11 4 10 10 10 10 10 10
Fig. 2. Schematic diagram showing complete test setup
LVDTs (Linear Variable Differential Transformers) of least count 0.01mm were used for measuring deflections at each storey level. LVDTs were connected to slotted angles that were in turn connected to the fixed type of steel reaction frame available in the laboratory. For top storey 100mm LVDT was used to measure deflection and 50mm LVDT for other storeys. If needed, LVDT‟s were removed and resetting was done to ensure correct measurement of deflection. The load increment for each cycle was 2kN at the initial stages i.e., before initial cracking, 6kN after the first cracking and same TABLE I: MODEL DIMENSIONS WITH REINFORCEMENT DETAILS.
Details Size in mm Flexural Reinforcement Shear Reinforcement
Beams 100 × 100
8 mm φ 2 nos., both at top and bottom
6 mm φ legged at 30 mm c/c near junction region and 60 mm c/c at middle region. Columns
(for I and II storey)
100 ×150
10 mm φ 6 nos, 3 nos. on either
side 6 mm legged at 40 mm c/c at junction region and 80 mm c/c at middle region. Columns
(for III, IV and V storey)
100 ×150
10 mm φ 4 nos., 2 nos. on either side
Shear wall
100 ×1000 in which 100 ×
150 on either side act as boundary element
8 mm φ 16 nos., 8 nos. on either side
increment was adopted during final loading for post ultimate study. The deflections at all storey levels were measured using LVDT at each increment or decrement of load. The load cycles were continued till the final collapse occurred. In general the testing continued for about 12 or 15 days. The formation and propagation of cracks, hinge formation and failure pattern have been recorded. The displacement due to rigid body rotation of the footing and the foundation block were incorporated in the calculation for net deflection.
The reinforced cement concrete members of the frame namely, beams, columns and shear wall have been modelled using BEAM23 2-D Plastic Beam. ANSYS 2D model and the deflected shape of dual frame is shown in Fig. 3. Ultimate base shear obtained from ANSYS-2D analysis was 283.0kN and ultimate deflection was 31.212mm.
Fig. 3. ANSYS 2D model and deflected shape of R.C. dual frame
VI. EXPERIMENTAL INVESTIGATION
A. Loading and Load Deflection Behaviour
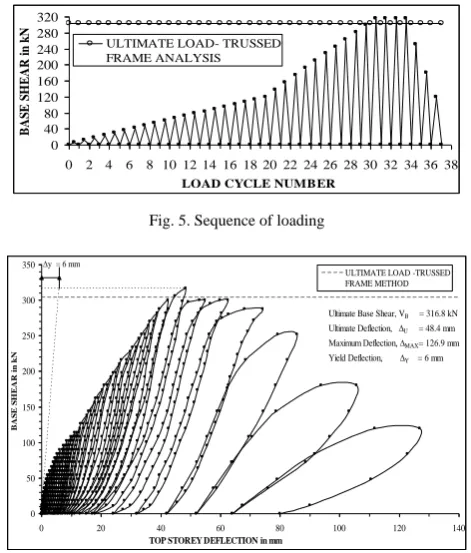
The lateral load was applied at the 1st, 3rd and 5th storey level using double acting hydraulic jacks. The history of load sequence followed is presented in Fig. 5. The load increment for each cycle was 2kN at the initial stages i.e., before initial cracking (up to 20th cycle), 6kN in the later cycles i.e., after the first cracking (from 21st to 31st cycle) and the same was adopted till collapse (from 32nd to 37th cycle) for post ultimate study. The ultimate base shear of 316.8kN was reached in the thirty first cycle. The theoretically predicted ultimate base shear was 303.8kN using trussed frame analysis. It was found that the estimated ultimate load by trussed frame analysis is 4.1% less than that obtained from experimental study.
The variation of maximum top storey deflection with respect to base shear is presented in Fig. 6 for 1 to 37 cycles. From the hysteresis curve, assuming bi-linear behaviour, the yield deflection (y) was found to be 6 mm.
At the ultimate load, the top storey deflection was found to be 48.4 mm (experimental value) whereas it was obtained as 42.32 mm from ANSYS on application of monotonic loading. From push over analysis using SAP, the top storey deflection was found to be 42.75mm. The drift in percentage of dual frame was calculated at the crack load, at the ultimate load and at collapse and it was found to be 0.33, 1.3 and 3.3 respectively.
B. Stiffness Characteristics
The stiffness of the shear wall was calculated as the base
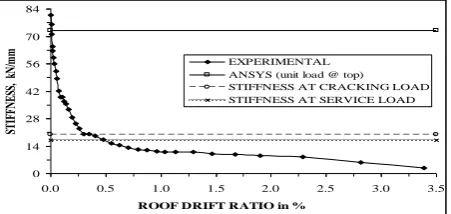
shear required to cause unit deflection at the top storey level. The stiffness in a particular cycle was calculated as the secant stiffness drawn to the curve at the base shear P = 0.75*Pu, where Pu is the maximum base shear of that cycle. The initial stiffness of the frame was 80.8kN/mm and it was reduced to 3.0kN/mm in the final cycle of loading. The theoretical maximum stiffness was 72.88kN/mm from ANSYS-3D). At the cracking load, stiffness was 19.9kN/mm and at service load (50% of ultimate load) it was 16.9kN/mm. The frame showed considerable degradation in stiffness in the early cycles of loading i.e. before 0.5% drifts cycles as in Fig. 8.
The stiffness of the shear wall was calculated as the base shear required to cause unit deflection at the top storey level. The stiffness in a particular cycle was calculated as the secant stiffness drawn to the curve at the base shear P = 0.75*Pu, where Pu is the maximum base shear of that cycle. The initial stiffness of the frame was 80.8kN/mm and it was reduced to 3.0kN/mm in the final cycle of loading. The theoretical maximum stiffness was 72.88kN/mm from ANSYS-3D). At the cracking load, stiffness was 19.9kN/mm and at service load (50% of ultimate load) it was 16.9kN/mm. The frame showed considerable degradation in stiffness in the early cycles of loading i.e. before 0.5% drifts cycles as in Fig. 8.
0 40 80 120 160 200 240 280 320
0 2 4 6 8 10 12 14 16 18 20 22 24 26 28 30 32 34 36 38
LOAD CYCLE NUMBER
BA
S
E
S
H
EA
R
i
n
k
N
ULTIMATE LOAD- TRUSSED FRAME ANALYSIS
Fig. 5. Sequence of loading
0 50 100 150 200 250 300 350
0 20 40 60 80 100 120 140
TOP STOREY DEFLECTION in mm
BA
S
E
S
H
EA
R
i
n
k
N
ULTIMATE LOAD -TRUSSED FRAME METHOD y = 6 mm
Ultimate Base Shear, VB = 316.8 kN Ultimate Deflection, ∆U = 48.4 mm Maximum Deflection, ∆MAX= 126.9 mm Yield Deflection, ∆Y = 6 mm
Fig. 6. Base shear Vs top storey deflection diagram
0 40 80 120 160 200 240 280 320
0 10 20 30 40 50 60 70 80 90 100 110 120 130
TOP STOREY DEFLECTION in mm
BA
SE
SH
EA
R
in
k
N
EXPERIMENTAL ANSYS-3D SAP2000NL
THEORETICAL - TRUSSED FRAME ANALYSIS
Fig. 7. Maximum base shear and top storey deflection
0 14 28 42 56 70 84
0.0 0.5 1.0 1.5 2.0 2.5 3.0 3.5
ROOF DRIFT RATIO in %
STI
FF
N
ES
S,
k
N
/m
m
EXPERIMENTAL ANSYS (unit load @ top) STIFFNESS AT CRACKING LOAD STIFFNESS AT SERVICE LOAD
Fig. 8. Stiffness Vs roof drift ratio in %
C. Ductility Characteristics
Ductility is an essential design requirement for a structure to behave satisfactorily under severe earthquake excitation. The ductility factor is defined as the maximum deformation divided by the corresponding deformation present when yielding first occurs. Thus, for a particular load cycle ductility factor, μ y, where is the maximum top story deflection reached at the peak load of that load cycle. The first yield deflection (y) for the assumed bi-linear load-deflection behaviour of the dual frame was obtained as 6mm. The ductility was 0.017 during the first cycle of loading and it was 21.15 during the 37th cycle of loading. At ultimate load, the ductility factor was 8.067. The cumulative ductility was obtained by adding ductility of each cycle up to the cycle considered. At ultimate load, the cumulative ductility factor of the dual frame was 69.192 and at failure, it was 154.175. The variation of cumulative ductility with respect to load cycles is shown in Fig. 9. Drift ratio is calculated as the ratio of the maximum horizontal deflection of the structure to the height of the structure. Global ductility (µ) is calculated as the ratio of the roof deflection of the structure at ultimate load to first yield deflection. Drift ratio of dual frame at ultimate load was 0.013 and global ductility of dual frame is 8.07. Based on equal energy concept, response reduction factor (R) is 3.89. R factor is found to be 8.07 based on the equal maximum deflection assumption.
0 40 80 120 160
0 2 4 6 8 10 12 14 16 18 20 22 24 26 28 30 32 34 36 38 LOAD CYCLE NUMBER
C
U
M
U
LA
TI
V
E
D
U
C
TI
LI
TY
F
A
C
TO
R
Fig. 9. Cumulative ductility factor Vs load cycles
D. Energy Dissipation Characteristics
The energy dissipation during various load cycles was calculated as the sum of the area under the hysteresis loops from the base shear versus top storey deflection diagram. The cumulative energy dissipation capacity of the frame at aparticular cycle was obtained by adding the energy dissipation during each cycle up to that cycle under consideration. The energy dissipation capacity during first cycle of loading was 0.00009 kNm and during final cycle of loading, it was 3.1626 kNm. The cumulative energy dissipated at various load cycles is shown in Fig. 10. At
ultimate load, the cumulative energy dissipated by dual frame was 8.67682 kNm. The total energy dissipation capacity was 26.93375kNm.
0 3 6 9 12 15 18 21 24 27
1 3 5 7 9 11 13 15 17 19 21 23 25 27 29 31 33 35 37
LOAD CYCLE NUMBER
C
U
M
U
LA
TI
V
E
EN
ER
G
Y
D
IS
S
IP
A
TI
O
N
i
n
k
N
.m
Fig. 10. Cumulative energy dissipation capacity for dual frame
E. Rupture Characteristics
The first crack was initiated in the third storey of left beam (LB3) and right beam (RB3) near column junction and the corresponding base shear was 124.2 kN in 21st cycle. At the base shear of 125.8kN during 21st cycle cracks were formed near column junction of the fourth storey left beam and bottom of the first storey left boundary element of shear wall. During 21st cycle with the base shear of 129.3kN, cracks were formed at both the ends in second, third, fourth, fifth storey left beams and first storey left beam near column junctions. During the same cycle second, third and fourth storey right beams also showed cracks at both the ends and fifth storey right beam near column junctions. During 27th cycle at the base shear of 236.4kN flexural crack was appeared between shear wall and foundation. The cracks already formed in the floor beams expanded further. First storey left column (LC1) and first storey right column (RC1) were cracked at bottom with the base shear 277.5kN during 29th cycle. First storey right boundary element (BR1) also cracked at the same base shear. At the base shear of 252.6kN out of the four, one main reinforcement of first storey left boundary element were broken. During 37th cycle, at the base shear of 120.6kN out of the remaining three main reinforcements, one steel bar was broken. The ultimate base shear of 316.8kN was reached in the 31st cycle of loading. The frame was subjected to further cycles of loading to study the post-ultimate behaviour of the frame. The frame failed at the ultimate load stage by failure of shear wall as shown in Fig. 11. (All main rebars of first storey left boundary element of shear wall were split). Dual frame before testing and at failure stage is shown in Fig. 12.
Separation cracks between shear wall and foundation
Out of four main rebars of left boundary element of shear wall, two were
split
Fig. 12. R.C dual frame before testing and at failure.
VII. FINITE ELEMENT ANALYSIS –ANSYS
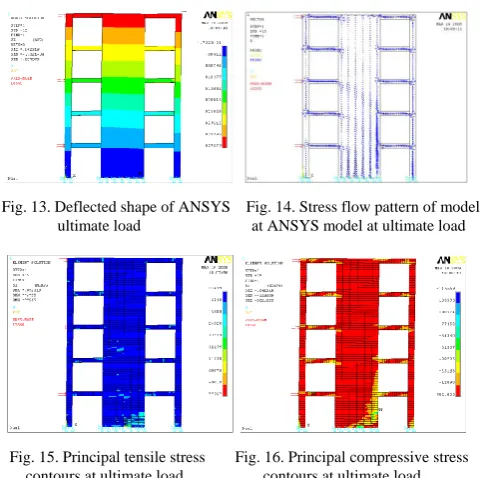
The reinforced concrete members of the frame have been modeled with SOLID65. The deflected shape of ANSYS model of dual frame at ultimate load is shown in Fig. 13. The top storey deflection was 42.32mm from the ANSYS analysis. The deflection from the experimental test was 12.56% greater than the analytical value, at the ultimate load. The stress flow pattern of the finite element model is shown in Fig. 14. All beams, first and second storey right boundary element of shear wall and first storey right column has high compressive stress. Left column and right column except first storey shows less compressive stress. Stress is relieved from left and right columns due to the presence of shear wall. The principal tensile stress and compressive stress contours for the finite element model of the dual frame are shown in Fig. 15 and Fig. 16 respectively. Maximum tensile stress of 33259kN/m2 and maximum compressive stress of 25163kN/m2 was reached in the dual frame at ultimate load. These distributions help to identify the hinging locations.
Fig. 13. Deflected shape of ANSYS Fig. 14. Stress flow pattern of model ultimate load at ANSYS model at ultimate load
Fig. 15. Principal tensile stress Fig. 16. Principal compressive stress contours at ultimate load contours at ultimate load
Beams and columns of dual frame have been modeled with frame elements available in the elements library of the SAP2000Nonlinear software. Beams were assigned M3 and V2 hinges at both ends. Columns were assigned PMM hinges
at both ends. Shear wall was modeled as strut element with possibilities of forming axial hinge. Boundary elements and wall portion of shear wall have been modeled with frame elements as push over analysis can be done using frame elements. From experiment it has been observed that hinge is formed at bottom of first storey shear wall and at other storey levels no hinge formation was observed. Therefore only first storey boundary elements are assigned P-axial hinges at bottom. The nodal loads were applied at the 1st, 3rd and 5th story of the model as applied in the experimental specimen.
Fig. 17. SAP model of dual frame at first hinge formation and at failure
SAP model of dual frame at first hinge formation and at failure is shown in Fig. 17. It has been noted that first hinge is formed in first storey left boundary element and same was observed during experimental investigation. When load was applied to dual frame, it has been noted the applied load was taken by shear wall therefore formation of first hinge. At failure, all left beams except first storey reaches maximum stage (C) whereas all right beams are in immediate occupancy (IO) stage below life safety level. First storey left boundary element has reached failure stage and first storey right boundary element has reach maximum limit (C). Yield hinge (B) was also noticed in first storey left column base, first storey and second storey right column base. The hinge conditions at failure from SAP reveal experimental failure stage exactly. Ultimate deflection obtained from SAP is 42.75mm. The deflection value from SAP is 11.67% less than the experimental deflection value.
IX. CONCLUSIONS
The following conclusions are derived after the study of experiment and analytical results carefully:
For dual frame, the estimated ultimate load by trussed frame analysis was 4.1% less than the experimental ultimate load. The theoretical initial stiffness from ANSYS was 9.8% less than the experimentally obtained stiffness. The global calculated global ductility of dual frame was 80 % higher than the assumed value. Global ductility of dual frame was 8.0.
elements available in software with axial hinges in boundary element. Push over analysis seems to match during testing.
In a dual system its displacement ductility capacity is governed by the ductility capacity of the walls, before the frame system could reach its lateral deformation capacity. Therefore the bottom storey of shear wall should be properly designed and detailed. By enhancing ductility and energy dissipation capacity in the structure, the induced seismic forces are reduced and more economical structure can be obtained or alternatively the probability of collapse reduced. These parameters are enhanced in dual frame.
REFERENCES
[1] M. Leod, “Shear wall-frame interaction–A design aid,” Advanced
Engineering Bulletin, Portland Cement Association, no. 14, 1970.
[2] N. Anwar, “Behavior, modeling and design of shear wall-frame systems,”Asian Center for Engineering Computations and Software, ACECOMS, AIT, Thailand.
[3] Y.-H. Ohet al., “Effect of boundary element details on the seismic deformation capacity of structural walls,”Earthquake Engineering and
Structural Dynamics, pp. 1583-1602, 2002.
[4] Y. L. Moet al., “Structural behaviour of RC frame-wall components,”
Materials and Structures, vol. 31, pp. 609-615, 1998.
[5] Code of Practice for Plain and Reinforced Concrete, Bureau of Indian
Standards, New Delhi, India, 2000.
[6] Ductile Detailing of RC Structures Subjected to Seismic Forces,
Bureau of Indian Standards, New Delhi, India, 1993.
[7] Indian Standard Code of Practice for Ordinary or Low Heat Portland