THE VALUE OF PUBLICLY AVAILABLE DATA SETS FOR SOCIAL SCIENCE
RESEARCH AND EVALUATION
Lincoln J. Fry
Academic Member,Sociology Research Unit, Athens Institute for Education andResearch, (ATINER) Athens Greece
A R T I C L E I N F O A B S T R A C T
This paper is concerned with large publically accessible data files and provides guidance as to how to access these available large data sets which social scientists can use for planning, research, as well as assessment of large social/governmental programs. Two types of big data are identified, one generated by the internet and the other by large scale survey research projects. The author’s experience is with the latter, and this paper will highlight work done through one of what are known as barometers, in this instance, the Afrobarometer Project. The purpose of this paper is to promote the use of large data by social scientists which have been neglected for those purposes. The objectives of this paper will be to assist social scientists to locate data sources, data warehouses or special projects like the various barometers, understand how to acquire data sets of interest, learn how to download them, and then how to transfer these data into a format that is consistent with the researcher’s available software programs, particularly those programs that can accommodate large data files. Examples of the types of study that can be produced are provided, In addition, the author gathered information about the experiences of both big data users, including those who are embedded in what can be called the big data industry, and software providers. The input of all of these professionals greatly contributed to the completion of this paper.
INTRODUCTION
It is unclear how big data should be defined. Given the emergence of internet generated data, which may contain unlimited data points, that question is somewhat moot. There are two areas of interest when we consider the impact and importance of large data sets. The one that gets the most attention is generated by networked computer systems and smart cards that record everyday activities, and everything individuals do in their daily lives. The second area is the generation of large data files, usually created through the use of survey research methods, and often designed to provide enumeration of populations, their demographics and/or to provide assessments of the dimensions of societal properties. This includes attitudes and perceptions regarding social institutions, and real social events, like crime victimization. It is this second area of interest and the focus of this chapter, the availability, use and value to various entities regarding the information contained in these files; this paper highlights the clear and obvious neglect of these large data files. Both types of data share a common objective, and that is to increase our understanding of human behavior.
Big Data: How Are Stored An Accessed
The big data sets have been around for a long time; think the US Census. The data of interest here are somewhat marginal
in terms of the general scope of large data. They are generated by what are known as barometers, and their size falls far short of volume and overall size included in the accepted definition of big data, which utilizes terms included in the three Vs,volume, velocity and variety (Avirappattu, 2016). They do not require the use of a supercomputer or the use of large computer networks in the analysis of data files. The point to be made here is that these files do represent big data to end-users, researchers, academic faculty, program evaluators, and graduate students who attempt to generate academic papers, chapters and books, or assess/evaluate large scale social programs. Practicality is a driving force in what is required to meet those data needs.
It has to be noted that therehas been a recent revolution in the availability of data, large and small, nationally and internationally. In the US, it is called the US Government’s Open Data Project (data.gov, 2016). The website contains portals to a range of areas of interest, from agriculture to science and research. At this time, there are 14 portals on the data.gov website that all contain data for specific areas of interest.There is also a major international open data movement which is based on what is known as the Open Data Charter (opendatacharter, 2016). The Preamble of the Charter begins by noting that the world is witnessing a significant global transformation fueled by technology and digital media which is facilitated by data and information. The rationale
Article History:
Received 26thOctober, 2016
Received in revised form 7thNovember,
2016Accepted 10th December, 2016 Published online 28th January, 2017
© Copy Right, Research Alert, 2017, AcademicJournals. All rights reserved.
Key words:
Big Data, Barometers, Data Archives, social Surveys, Afrobarometer Project
International Journal of Current Advanced Research
ISSN: O: 2319-6505, ISSN: P: 2319 – 6475, Impact Factor: RJIF 5.24
Available Online at www.journalijcar.org
Volume 6; Issue 1; January 2017; Page No. 1777-1783
ofthe Charter is that open data is at the center of this global shift. The ideal is to build a more robust, equitable, and just society and requires that governments are transparent and accountable.
Data resources
All one has to do to locate large data sets is to search for them on the internet. It appears that the oldest data repository in the United States is the Inter-University Consortium for Political and Social Research (ICPRS, 2016) founded in 1962, and housed at the University of Michigan. About 760 Universities, governmental agencies and other institutions are members of ICPRS, whose mission is to acquire, process, preserve and disseminate data and documents they collect, while providing education and training and resources to help users understand and analyze data. There are a number of national data archives, with the United Kingdom one example. The ability to use the files contained in these archives merely requires users to register with the site. Once you can access the site, there are search sites which will help to identify data of interest. Some, but not all allow the researcher to select the format they want to use to download data; SPSS.SAS, Excel and Stata are common choices.
Barometers
There are also two types of data barometers. The first is based on what can be defined as administrative data, usually information generated by public or governmental agencies in the course of pursuing their agency’s mission, with crime reports an example. The global movement to make government “open by default” has greatly enhanced the scope of this effort, especially because in 2013 the G8 leaders signed the Open Data Charter. What is known as the Open Barometer has put out a second edition (2016) and this project is designed to promote the availability and use of data which show how governments are spending tax payer money and how public services are performing, Other handbooks are available, which guide users on how to find and then download data files.
The second kind of barometer are those that use survey methodology to collect information about certain countries or regions of the world. These barometers tend to be named after continents or certain region of the world, The EuroBarometer, The AsiaBarometer, The ArabBarometer, and the Afrobarometerare examples of this type of project. . Established in 1973, the EuroBarometer is seen as the model for the other barometers launched throughout the world. The last Eurobarometer survey was carried out in 2015 in 36 countries. Among the topics included in the survey were the economy, the European political situation, and the way Europeans perceive their political institutions. Typically, data barometers are launched with certain counties identified as data collection targets. These core countries are routinely surveyed at staggered time periods, and new countries are periodically added to the survey schedules. Respondents are typically selected based on sampling frames designed to generate national probability samples, with adult persons, persons 18 years or older as the targeted respondent populations. If possible, interviews are conducted in the respondent’s native language by interviewers who speak that language. These surveys are standardized and administered in waves; items are added or modified from wave to wave, and specific country level questions are added from time to time.
Data are available as are questionnaires on each Barometer’s website, along with codebooks for each survey. These files may also be stored in what may be seen as data warehouses, like ICPRS described above.
The AfroBarometer
Formed in 1999 when three independent research projects merged, there were three core partners in Afrobarometer, Michigan State University, the Institute for Democracy in South Africa and the Center forDemocratic Development. In 2000 Afrobarometer joined other regional barometers to form the Global Barometer Network; the following year, Afrobarometer completed the Round 1 survey. The project started with 12 countries in Round 1, and by 2016 Round 6 was recently completed in 36 countries, and results will be available in early 2017. Like other barometer projects, Afrobarometer produces a number and range of reports. These include books dispatches, policy papers, working papers, briefing papers and summary of results (for country surveys). The Project’s website currently indicates that Afrobarometer has surveyed 37 countries, conducted 145 surveys and completed 206,813 interviews. All of the country level files are available on the projects website, as are merged files for each of the first 5 rounds. These merged files have grown in size over the course of the rounds conducted. The merged file from Round 1 had 21,531 cases and the Round 5 file contained 51,587 respondents. Data files contain about 350 variables and targeted sample sizes are usually 1,200 or 2,400 for each country level survey. Data files are released in SPSS format, and can be formatted to a range of statistical packages through the StatTransfer Program. The website has an online data analysis program, which provides univariate and cross tabs for all files. The researcher chooses the Afro Barometer Round, the country, and then selects the variables of interest from an online menu.
International Journal of Current Advanced ResearchVol 6, Issue 01, pp 1777-1783, January 2017
FINDINGS/RESULTS/DISCUSSION: EXAMPLES
AND IMPLICATIONS FOR PUBLIC POLICY
RESEARCH
This discussion willnow focus exclusively on Afrobarometer, the big data source the author has used extensively over the last few years. At this point, 15 articles based on Afrobarometer data have appeared in print, and files from the following counties have provided the basis of all of these papers: South Africa, Nigeria, Uganda, Kenya, Sierra Leone, Tanzania, Cameroon, and Sudan. Some of these papers build on previously published Afrobarometer papers, especially working papers. Among the topics included in those papers werecorruption, payment of bribes, trust of the police, Infrastructure, HIV/Aids policy and assessments of MDGs, crime victimization, violent and property crime and the fear of crime, the integration of minority populations, specifically SE Asians living in South Africa, and gender, including gender and specific dangers in field work and gender differences in corruption, measured by payment of bribes.
The Afro Barometer questionnaire contains a range of social, demographic and ecological indicators. It contains a poverty index (The Lived Poverty Index), and information about the availability of infra-structure and public services available to area residents.The surveys are designed to ferret out the perceptions, opinions, beliefs and priorities of ordinary Africans. These include their personal trust of public institutions, police, courts, political offices, local and national, and others. Respondents are requested to provide what they consider to be the most important problems facing their country and that should be addressed by the government. Respondents can provide up to three answers to this question. They are also asked about how they felt the government was handling these particular problems. Examples will be provided in this chapter about how Afrobarometer data can be used by relevant stake holders. The relevance of the questions about national priorities and how governments are handling identified problems will be the focus of some of the examples provided here.
The survey process as a research topic
Valuable data is collected in addition to the standard questionnaireinformation, and this data is vitally important information for each country included in the survey round. The Afrobarometersurvey procedures are described in detail for each survey round, and remain consistent from round to round, The Round 6 Survey Manual (Afrobarometer. 2014) serves as an example when it describes the fieldwork deployment plan, and the staffing of the survey team. Each team consists of one supervisor and four interviewers, The supervisor acts as the survey quality control person, verifies the interviewer’s interview, queries the interviewers about the context of the interview environment, issues like cooperation, respondent friendliness, intrusion by others present, and so forth. As mentioned above, this procedure documents infrastructure, from availability of sanitation facilities to paved roads.
Danger in field work
The first Afrobarometer article to be reviewed here was published in Gender and Behaviour(Fry,2013a ). It uses the field supervisorsqueries of about 2,400 face-to-face interviews
conducted by contract field-staff in South Africa in 2008, and the study looks at the way gender affects danger in fieldwork settings. Based on the data collected by Afrobarometer in 2008, the research provides an indication of the level of the interviewers' feelings of being threatened as well as their actual receipt of physical threats. Interviewers collected information about respondent attitude toward the survey process and two additional questions asked whether the interviewer felt threatened or had received actual physical threats. The analysis revealed that interviewer social and demographic characteristics were not predictive of the reported feeling threatened and/or being physically threatened. The findings regarding receipt of physical threats were as expected; female interviewers were the recipients of 25 of 26 physical threats. Contrary to what was expected, about equal numbers of interviewers who had interviewed women had received physical threats from that respondent. Two other questions asked whether respondents received help from others to answer the questions and whether the interviewer had been approached by community or party representatives. Those two questions, and a respondent attitude scale, emerged as the primary predictors of the receipt of physical threats by these interviewers. These findings pointed to the need for increased safety planning and training, especially for field supervisors. The conclusions of the study were that safety planning should be introduced into interviewer and supervisor training, and should also include planning that attempts to pave the way for interviewers to enter fieldwork sites. This would begin with prior contact with significant community gatekeepers, providing them with a clear understanding of the objectives and logistics of surveys to be conducted in their communities.
The Afrobarometer survey manual (2014) advises against seeking governmental approval to conduct surveys. Seeking official clearance often just invites some official to say “No.” If possible, therefore, we (Afrobarometer) proceed in this study on the assumption that we have the right to do so, i.e., without requesting official clearances. The Manual goes on to say that, in practice, however, Afrobarometer recognizes that legal, political and traditional protocols may have to be observed. These can usually be addressed by obtaining an official research authorization or a letter of introduction from a national authority or paying a courtesy call to the local traditional leader. The recommendation of the paper (Fry ,2013a) goes beyond that and suggests the need to identify and then work with community level gatekeepers in order to facilitate access to respondents in local communities.
Who sent interviewer to respondent’s home?
respondents thought interviewers were possible spies. Based on the responses of 27,713 respondents included in Afrobarometer Round 4, only 82 respondents
did think fieldworkers had been sent by intelligence or secret service agencies. The only striking finding that emerged from the study’s multiple regression analysis was that respondent higher levels of education was the strongest predictor of the suspicion that fieldworkers were in fact spies,
HIV studies
By way of contrast to the papers mentioned above, th fairly impressive Afrobarometer literature devoted to HIV/Aids. After all, Africa is the epicenter of the HIV/AIDS pandemic, and yet Afrobarometer respondents do not rate HIV/AIDS as one of their highest level priority issues that government needs to address. Poverty, jobs and so forth are seen as much more important, sometimes this response is referred to as the “too poor to care”(Justesen, 2011). The first study mentioned here was published in The African Journal of ofInfecttious Diseases (Fry,2013b). Conducted with Afrobarometer data collected in South African sample from during the Fourth Round of the Afrobarometer survey,The purpose of this paper was to identify the factors which predicted respondent selection of HIV/AIDS as an important issue that the government should address. The identification of HIV/AIDS as an important governmental problem was the study’s dependent variable. Other possible important factors were whether respondents had personal knowledge of HIV/AIDS, meaning they knew someone who died of AIDS, poverty, and their assessments of the way the government was handling the HIV/AIDS crisis.
Respondent background and demographic characteristics were also included in a logistic regression analysis. The results identified three factors that predicted respondent choice of HIV/AIDS as an important problem: race, especially being a Black South African, the choice of health as a governmental priority, and the rural-urban dimension. The conclusion was that HIV/AIDS, as opposed to health, should be the focus of campaigns designed to mobilize public support of comprehensive HIV/AIDS prevention strategie
Africa. One important point emphasized in this paper is that respondents may see health as an important government
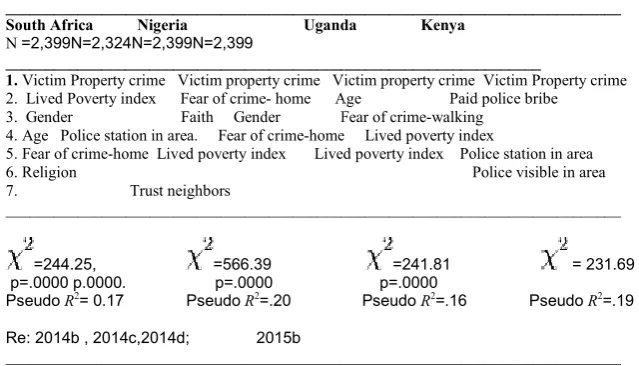
Figure 1 Significant predictors of violence victimization by country in previous studies
Significant PredictorsCountries
_____________________________________________________________________________ South Africa Nigeria Uganda Kenya
N =2,399N=2,324N=2,399N=2,399
_________________________________________________________
1. Victim Property crime Victim property crime Victim property crime Victim Property crime 2. Lived Poverty index Fear of crime- home Age Paid police bribe
3. Gender Faith Gender Fear of crime
4. Age Police station in area. Fear of crime-home Lived poverty index 5. Fear of crime-home Lived poverty index Lived poverty index Police station in area 6. Religion
7. Trust neighbors
_____________________________________________________________________________
=244.25, =566.39
p=.0000 p.0000. p=.0000 p=.0000
Pseudo R2= 0.17 Pseudo R2=.20 Pseudo
Re: 2014b , 2014c,2014d; 2015b
_____________________________________________________________________________
interviewers were possible spies. Based on the responses of 27,713 respondents included in Afrobarometer Round 4, only 82 respondents (.003) percent) sent by intelligence or secret that emerged from the study’s multiple regression analysis was that respondent higher levels of education was the strongest predictor of the suspicion that fieldworkers were in fact spies,
By way of contrast to the papers mentioned above, there is a fairly impressive Afrobarometer literature devoted to HIV/Aids. After all, Africa is the epicenter of the HIV/AIDS pandemic, and yet Afrobarometer respondents do not rate HIV/AIDS as one of their highest level priority issues that to address. Poverty, jobs and so forth are seen as much more important, sometimes this response is referred to as the “too poor to care”(Justesen, 2011). The first study mentioned here was published in The African Journal of 2013b). Conducted with Afrobarometer data collected in South African sample from during the Fourth Round of the Afrobarometer survey,The purpose of this paper was to identify the factors which predicted respondent selection of HIV/AIDS as an important e that the government should address. The identification of HIV/AIDS as an important governmental problem was the study’s dependent variable. Other possible important factors were whether respondents had personal knowledge of meone who died of AIDS, poverty, and their assessments of the way the government was
Respondent background and demographic characteristics were also included in a logistic regression analysis. The results identified three factors that predicted respondent choice of HIV/AIDS as an important problem: race, especially being a can, the choice of health as a governmental urban dimension. The conclusion was that HIV/AIDS, as opposed to health, should be the focus of campaigns designed to mobilize public support of comprehensive HIV/AIDS prevention strategies in South Africa. One important point emphasized in this paper is that respondents may see health as an important government
priority, but that does not necessarily include HIV/AIDS. In fact, Afrobarometer surveys find that people who see the epidemic as meriting governmental action tend to see it either as an AIDS issue or as a health issue, but not both. The study suggested that there was the need to sharpen the message about HIV/AIDS prevention programs and separate HIV/AIDS from the health care emphasi
level of HIV/AIDS as a priority. The study showed that Black Africans needed to be the targeted group for HIV/AIDS prevention and treatment programs.
South East Asians in South Africa
The next paper dealt with the integration of
in South Africa (Fry, 2015a). The purpose of the paper was to look in depth at the fear of crime and actual victimizations of South East Asians residing in South Africa. The data came from the Round 5 survey of South Africa. The study identified 102 persons of South East Asian descent, out of a sample which contained 2,399respondents, 4.3 percent of the sample.
The findings revealed that South East Asians displayed higher levels of fear of crime and higher levels of criminal victimization than ordinary South Africans. In terms of fear of crime, 61 percent of South East Asians as compared to 51 percent of other South Africans reported fear of crime in their homes, and 71 percent reported fear of crime when walking in their neighborhoods as compared to 57 percent of the other respondents.
South East Asians were more victimized than other So African respondents., with 38 percent reporting something had been stolen from their homes within the last year and 19 percent reporting that they, or someone in their family had been attacked in their home, This compared to 25 percent of other South Africans who reported they had been property crime victims and 10 percent who reported violent crime victimization.
Significant predictors of violence victimization by country in previous studies
_____________________________________________________________________________ South Africa Nigeria Uganda Kenya
___________________________________________________________________
Victim Property crime Victim property crime Victim property crime Victim Property crime home Age Paid police bribe
r Fear of crime-walking
home Lived poverty index home Lived poverty index Lived poverty index Police station in area
Police visible in area
_____________________________________________________________________________
=566.39 =241.81 = 231.69
p=.0000 p.0000. p=.0000 p=.0000
=.20 Pseudo R2=.16 Pseudo R2=.19
_____________________________________________________________________________
priority, but that does not necessarily include HIV/AIDS. In Afrobarometer surveys find that people who see the meriting governmental action tend to see it either as an AIDS issue or as a health issue, but not both. The study suggested that there was the need to sharpen the message about HIV/AIDS prevention programs and separate HIV/AIDS from the health care emphasis as a way to raise the level of HIV/AIDS as a priority. The study showed that Black Africans needed to be the targeted group for HIV/AIDS prevention and treatment programs.
South East Asians in South Africa
The next paper dealt with the integration of South East Asians 2015a). The purpose of the paper was to look in depth at the fear of crime and actual victimizations of South East Asians residing in South Africa. The data came from the Round 5 survey of South Africa. The study ntified 102 persons of South East Asian descent, out of a sample which contained 2,399respondents, 4.3 percent of the
The findings revealed that South East Asians displayed higher levels of fear of crime and higher levels of criminal victimization than ordinary South Africans. In terms of fear of crime, 61 percent of South East Asians as compared to 51 uth Africans reported fear of crime in their homes, and 71 percent reported fear of crime when walking in their neighborhoods as compared to 57 percent of the other
International Journal of Current Advanced ResearchVol 6, Issue 01, pp 1777-1783, January 2017
There were some striking findings related to the SE Asian paper that were not in the published paper. These began with the logistical regression equation that looked for difference between SE Asians and the rest of the sample. The most highly significant factors (Z scores 4.43 and 3.59) were found in the questions which asked whether the respondent felt their ethnic group was treated fairly by the government and whether there was a police station in their area. The Afrobarometer survey allowed for the source of the strength of these responses to be pinpointed to a single city, Durban, Of 102 SE Asian respondents, 100 were found to be urban residents, the vast majority residing in the city of Durban or its suburbs.The point is the Afrobarometer survey contains information that can be used for planning and to evaluate local community respondent perceptions, and thus be valuable at the local level.
Violence victimization:The South East Asian paper cited
above was the only publication that dealt with a single racial/ethnic group in a single country, A series of papers have been published which looked at criminal victimization at the country level, specifically violent crime victimization. The results of some of those papers already in print are displayed in Figure 1. The statistical technique used in all of these analyses was logistical regression.
Figure 1 shows that being the victim of a property crime was the number 1 predictor of violent crime victimization in these African countries. This holds true for all of the papers that looked for the predictors of violence currently in print or, in press. This finding suggests that re-victimization is a major issuesfor violence prevention programs in these African countries, Thesefindings also point to a major flaw in this research, namely the inability to identify a time priority for violence and. property crime victimization, The time period for reporting victimization was in the last year, and the majority of crime victims have also been victims of both violent and property crimes in that time period. The studies are unable to indicate whether both types of victimizations were simultaneous or if one type of crime occurred prior to the other type of victimization, This raises the old issue that correlation does not necessarily infer causation. Despite that issue, these findings suggest that target hardening should be the crime prevention technique adopted in these African Countries. The framework for the suggested approach is called CPTED (Crime Prevention ThroughEnvironmental Design(Rapoport; 1983). Elements in the built environment include homes, schools, workplaces, parks/recreation areas, business areas and roads. It encompasses all buildings, spaces and products that are created or modified by people, and target hardening falls under that rubric. Research in this tradition has focused mainly on housing, transportation and neighborhood characteristics, emphasizing improved protection of self, property and neighborhoods (Srinivasan, O’fallon and Dearry, 2003). Inadequate urban planning has been identified as a major source of problems in those areas, and some studies indicate that the impact of mediating and moderating factors within the built environment must be the focus of future research.
In all of the studies referenced in Figure 1, the magnitude of the strength being the victim of a property crime factor far outdistanced any other factor. Demographic factors like age, gender, and poverty were on the list as were fear of crime, certain police indicators, like visibility, the presence of a
police station were also significant factors. The fact that payment of a bribe to the police is the second most predictive in Kenya will be addressesed below.
Trust in institutions, corruption, bribery and extortion
Trust the Police:It is commonly accepted that the police are
generally perceived as Africa’s most corrupt institution. The example from Kenya in the previous section will help to clarify that point. In African countries the police are known to set up roadblocks and charge motorists a fee to merely able to pass. What came to light when the Afrobarometer files were studied in more depth was the fact that crime victims were overrepresented among those who paid bribes to the police, especially property crimevictims.As for violent crime victims, it is alleged that sometimes the victim and the perpetrator are interchangeable when the police are called to intervene in personal disputes between citizens.The narrative suggests that whomever is willing to pay the largest bribe becomes the victim and the other person involved becomes the perpetrator. On the other hand, property crime victims tend to believe that they need to bribe the police to get their stolen goods back, Non-payment of bribes means the police will not look to retrieve their stolen property or return stolen property to the rightful owner if the police are not paid bribes.
Early papers based on Afrobarometer data showed there were distinct differences between countries in terms of trusting the police. The first country was South Africa (Fry, 2013c) where the population was generally divided in terms of their trust in the police. About 21 percent of South Africans did not trust the police at all, and about 20 percent trusted the police a lot. This compared to Nigeria (Fry, 2013d) where only 7 percent of respondents trusted the police a lot and about 46 percent did not trust the police at all. In South Africa the factors that predicted trust of the police were basic interpersonal trust, perceptions of police corruption, poverty and race, In Nigeria the most highly significant factor was trust in elected officials, followed by perceptions of corruption, religion and respondent age.
Payment of bribes and the existence of a culture of bribery:
One question addressed in this paper concerned payment of bribes to the police. A study was conducted based on the Afrobarometer data collected in Kenya during Round 5 in order to identify the factors that predicted payment of bribes to the police (Fry, 2015c). What emerged from that analysis was the fact that payment of bribes to the police was best predicted by payment of bribes for other public services, to receive documents, medical, sanitation, and school services. These findings supported the notion that payment of bribes to the police was part of the existence of a culture of bribery in Kenya. The importance of infrastructure emerged in the culture of bribery also emerged from the analysis of the reasons for payment of bribes to non-police entities.
more bribes in that same time period The logistical regression pointed to being a property crime victim as the number one predictor of payment of bribes, and this in turn again pointed to therole of the police in corruption. This finding was consistent with the narrative provided above about reasons respondents had for not trusting the police.
CONCLUSIONS
At this point, the question can be asked “if I am interested in pursuing research possibilities with big data, what should I do to get started?” The answer to that question can be found on the internet,where a growing number of resources related to big data are to be found, As far as we know, all major big data sources offer some kind of training or instruction related to the use of big data; some sources are free, others charge fees. As an example, ICPRS at the University of Michigan, has a long history of providing summer training courses related to the use of the file available in their data warehouse. The website has a special data driven program, which includes datause learningguides (ICPRS, 2016). Also, academic books are now being produced which guide researchers in their use of survey data. Mccinnes’ (2016) recent book is an example.
A number of academic journals are now devoted to big data. There is also a website that provides information about all issues regardingbig data (kdhnuggests.com).This publication includes academic as well as training and practical issues, including employment opportunities. Recently academic institutions have begun to offer single course or special programs related to big data concerns, and a Master in Business analytics and Big Data Future Learn is one of the sites that offers big data courses. (Futurelearn, 2016) According to their website, almost 4 million people are learning from online courses offered by top international universities and specialist organizations. For instance, the website currently lists a program entitled:Big Data Analytics, which included 4 online courses, and offered by Queensland Universityof Technology.In this instance, all 4 courses are two weeks each. Registration and course enrollment are free, and certificates of completion are available for 156 pounds. A number of academic journals are now devoted to big data.
Acknowledgements
This chapter benefited from Afrobarometer Data, especially all of the countries included in Merged Rounds 4 and 5, as well as numerous Afrobarometer papers, especially those working papers available at http://www.afrobarometer.org,
This chapter also benefited from the input of Steven Dubnoff, President, Circle Systems, incorporated, who distributes StatTransfer, a software facilitythat provides data transfer among popular software packages. As far as can be determined, Circle Systems is the sole provider of this form of data transfer.
Also, the chapter benefitted from the input of Peter Ward, CEO of WeTrack, This source is available on the internet, (wetrack.com) and is interesting because it evolved from another purpose, born out of the London 2012 Olympic Games, and evolved into a program that generates big data. This is a project management project that creates data sets for organizations and then provides the software to manage their projects, especially major events, with Ryder Cup Europe an
example. From a big data perspective, this approach creates what may be defined as administrative data, creates the software to assess what has been collected, and provides real time bench marks regarding task management and completion.It should be noted that WeTrackrecenltly won the Platinium award from the International non-profit start-up accelerator mass Challenge (2017)
References
Afrobarometer (2014)Afrobarometer Round 6 Survey Manual. Available at: www.afrobarometer.org.
Avirappattu, G. (2015). On Efficient Acquisition and Recovery Methods for Certain Types of Big Data.
Managing Big Data Integration in the Public Sector,
137.
Bratton, M. (2002).Wide but shallow: Popular support for democracy inAfrica.Afrobarometer Paper 19.Available online at: www.afrobarometer.org.
(2012"Citizen perceptions of local government responsiveness in Sub-Saharan Africa." World
Development 40, no. 3 (2012): 516-527.
Data.gov (2016) available at data.gov.
Deaton, Angus, Jane Fortson, and Robert Tortora. Life (evaluation), HIV/AIDS, and death in Africa. No. w14637. National Bureau of Economic Research,2009. International non-profit start-up accelerator mass challenge
(2017) WeTrack won the Platinium award for the Mass Challenge. Available at https://eventindustrynews. Co.uk
Fry, L. (2013a) Gender and Dangers Inherent in Fieldwork. Gender &Behaviour 11:5474-5485
______ (2013b) Continuities in the HIV/AIDS Policy Debate in South Africa. African Journal of Infectious
Diseases 7 (2): 21-26.
______ (2013c) Trust of the Police in South Africa: A Research note. International Journal of Criminal
Justice Sciences. 2013. Vol. 8 (1): 36–46
______ (2013d) Public mistrust of the police in Nigeria.
African Journal for the Psychological Study of Social
Issues, 16 (2): 253-262
_______ (2014a) Spies like us? Respondent perceptions of research sponsors in 20 African countries.
International Journal of Modern Anthropology7: 85-98
______ (2014b) Factors which predict Interpersonal Violence in South Africa. South African Family Practice, 56 (5) Published online January 2015.
______ (2014c) Factors which Predict Victimization in Nigeria. Nigerian Medical Journal. 55 (1): 39-43 _______ (2014d) Factors which predict Physical violence
in Uganda. Pan African Medical Journal.19: 335-342. ________ (2015a) Assessing the HIV/AIDS MDGS: does
this look like success or even progress?Pambazuka. News 05/29/2015
_______ (2015b) Factors which predict Violence Victimization in Kenya. Sub-Saharan African Journal
of Medicine, 2(3), 117- 122.
________ (2015c) The factors that predict systematic police bribery in Kenya. Global Journal of Human Social
Sciences (2015) 15 (4): 29-36
International Journal of Current Advanced ResearchVol 6, Issue 01, pp 1777-1783, January 2017
_______ (2015e) Fear of crime and victimization of South East Asians in South Africa. International Journal of
Education and Human Developments Vol. 1 No. 2;
9-16
_______(2016a) The search for a culture of bribery in Cameroon. World Journal of Social Science Research, vol.3, No 2; 185-198
FuturelearAvailableathttp://www.futurelearn.com/programs /big-data-analysis Gyimah-Boadi, E. (2015). Africa's Waning Democratic Commitment. Journal of
Democracy, 26(1), 101-113.
International non-profit start-up accelerator mass challenge (2017) WeTrack won the Platinium award for the Mass Challenge. Available at https://eventindustrynews. Co.uk
Isaksson, A, (2015) "Corruption along ethnic lines: A study of individual corruption experiences in 17 African countries." The Journal of Development Studies 51, no. 1: 80-92.
Justesen, Mogens K. "Too poor to Isaksson, A, (2015) "Corruption along ethnic lines: A study of individual corruption experiences in 17 African countries." The
Journal of Development Studies 51, no. 1 : 80-92.care?
The salience of AIDS in Africa.” Working Paper 233
(2011).Kdnuggets available at
Http://www.kdnuggets.com/courses/index.html
Konte, M., & Klasen, S. (2016). Gender difference in support for Democracy in Sub-Saharan Africa: Do social institutions matter?. Feminist Economics, 22(2), 55-86.
Lavallée, Emmanuelle, Mireille Razafindrakoto, and François Roubaud. Corruption and trust in political institutions in sub-Saharan Africa. Afrobarometer, 2008.
Mattes, R. (2008) "The material and political bases of lived poverty in Africa: Insights from the Afrobarometer." In Barometers of Quality of Life Around the Globe, pp. 161-185. Springer Netherlands.
_______and Michael Bratton. (2007) Learning about democracy in Africa: Awareness, performance, and experience. American Journal of Political Science 51, no. 1 : 192-217.
Macinness, J. (2016) An Introduction to Secondary Data Analysis with IMB SPSS Statistics. Sage Publishing, Newbury park, California Open data Charter (2016) available at opendatacharter.net
Persson, A., Rothstein, B., & Teorell, J. (2013). Why anticorruption reforms fail—systemic corruption as a collective action problem. Governance, 26(3), 449-471. Rapoport A. (1982) The meaning of the built environment: A nonverbal communications approach. Tucson, Arizona: University of Arizona Press; 1982.
Rotberg, Robert I. "Good governance means performance and results." Governance 27, no. 3 (2014): 511-518. Srinivasan, S., O’Fallon, L., and Dearyy. A. (2003)
Creating Healthy Communities, Healthy Homes, AndHealthyPeople: Initiating a Research Agenda on the Built Environment and Public Health. American
Journal of Public Health Vol. 93, No. 9 : 1446-145