Page 1 www.ijiras.com | Email: contact@ijiras.com
Association Of Complementary Feeding Practices And Nutritional
Status Of Children 6-23 Months Of Age Among Maasai
Community In Narok South Sub-County, Kenya
Stellah Malaso Koini
Sophie Ochola
Irene Ogada
School of Applied Human Sciences, Department of Food, Nutrition and Dietetics, Kenyatta University, Nairobi, Kenya
I. BACKGROUND
Complementary feeding is the process starting when breast milk can no longer sufficiently meet the required
nutritional for infants, and therefore introduction of other foods and liquids are needed, along with breast milk (WHO, 2002). Complementary feeding generally begins at 6 months and goes up to 24 months of age, even though breastfeeding
Abstract:
Background: Successful complementary feeding practices during infancy and young childhood are known to be key in securing effective, long-term nutritional well-being. It is recommended that feeding a child on complementary starts from the age of six months with dietary diversity and minimum feeding frequency. This is in addition to breast milk. Studies show a link between feeding practices of children and their nutrition status. There is limited information on the feeding practices and nutritional status of children 6-23 months of age among the Maasai community of Kenya.
Methods: A cross-sectional analytical study design was adopted. A total sample of 400 mothers and children were selected using simple random sampling. anthropometric data was collected using mid upper arm circumference (MUAC) tapes, weighing scale and height or length measuring board. Their corresponding deviation scores (z-scores) was calculated with reference to the cut off points recommended by the World Health Organization (WHO) 2006. ENA for SMART, 2011 software was used to analyze anthropometric data. Quantitative data analyzed using statistical packages for social sciences (SPSS) version 20. Statistical significance was set at p value less than 0.05. The data collected was summarized into descriptive statistics of mode and percentages for variables such as complementary feeding practices. Inferential statistics used include: Chi- Square-test for categorical or nominal data such as associations between variables. T-test and ANOVA was used for continuous data to test for significant differences and association between independent variables such as complementary feeding practices.
Results: The prevalence of malnutrition measured by stunting, wasting and underweight among the children was 47.3%, 19.8% and 37.8% respectively. Comparison of the prevalence of malnutrition between the boys and girls revealed that stunting and underweight was significantly higher in the girls (stunting, 67.3%; underweight, 44.1%) compared to the boys (stunting, 26.8%; underweight, 31.3%), (χ2= 65.995, p = 0.000 for stunting and χ2=6.913, p = 0.009 in the case of underweight). On the other hand a bigger proportion of the boys had low weight – for- height (38.9%) compared with the girls (1.0%), χ2 =90.614, p = 0.000).
Conclusions: The findings will be useful in identifying and bridging gaps in complementary feeding practices among the Maasai community and other communities.
Keywords: Complementary feeding, Nutritional status, Minimum dietary diversity, Minimum meal frequency, Minimum acceptable, Stunting, Underweight, Wasting.
Page 2 www.ijiras.com | Email: contact@ijiras.com may continue beyond two years (Dewey, 2003). Successful
complementary feeding practices during infancy and early childhood are known to be important in securing effective, long term nutritional wellbeing. Infant and young child feeding guidelines were developed jointly by WHO and UNICEF and launched in 2012, to facelift the world‟s attention to the success of feeding practices on a child‟s nutritional status, growth, development, health, and survival (UNICEF, 2013).
Children aged 6–23 months old should be given foods from 4 or more food groups out of the 7 recommended food groups namely: legumes and nuts; vitamin-A rich fruits and vegetables; other fruits and vegetables grains, roots and tubers; dairy products; flesh foods (meat, fish, poultry and organ meats); eggs; (WHO, 2008).The cut-off of at least 4 of the above 7 food groups above was selected because it is associated with better quality diets for both breastfed and non-breastfed children (FANTA/AED, 2007). Consumption of foods from at least 4 food groups on the previous day would mean that in most populations the child has a high likelihood of consuming at least one animal-source food and at least one fruit or vegetable that day, in addition to a staple food (grain, root or tuber). Worldwide, infants less than 35% are exclusively breastfed at the first four months of their life; frequently complementary feeding begins too early or too late, and foods are often inadequate nutritionally or unsafe (UNICEF/WHO, 2014). In Kenya, according the findings of the Kenya Demographic Health Survey (Kenya National Bureau of Statistics (KDHS, 2014), only 61% of infants 0-5 months of age are exclusively breastfed, indicating that complementary feeding still starts earlier than recommended. The survey further shows that 60% of children aged 4-5 months are given complementary feeds but only (54.0%) of children are fed from the requisite number of food groups (≥4 food groups) (KNBS and ICF Macro, 2010). The KDHS survey shows that only 36% of children in Rift valley below 6 months receive complementary feeds and only 39% aged 6-23 months are fed in accordance with infant and young child feeding (IYCF) Practices (KNBS and ICF Macro, 2010).
The number of meals should be: 2 times for breastfed infants 6–8 months; 3 times for breastfed children 9–23 months and 4 times for non-breastfed children 6–23 months (WHO, 2008b). In Kenya, the national data indicates that 72.5%, 65.0%, 60.7% and 57.7% of children are fed the minimum recommended times or more for 6-8months, 9-11 months, 12-17 months and 18-23 months age sub-categories respectively (KNBS and ICF Macro, 2010).
II. METHODS
The study aimed at determining the complementary feeding practices and their association within nutrition status of children 6-23 months of age among the Maasai community in Narok South-Sub County, Narok County.
A. STUDY AREA, SURVEY DESIGN, POPULATION Narok South Sub-county was the study area. It is located in Narok County, in the Great Rift Valley. It has a population
of 850,920 residents (District Development Plan Narok, 2002-2008). The primary inhabitants are the Maasai community who are traditionally pastoralists.
The target population consisted of infants or children 6-23 months of age and their mothers or caregivers in Narok South Sub-County. The mothers of these infants should have at least been living in Narok south sub county for the last six months or married to a Maasai.
B. SAMPLE SIZE, SAMPLING TECHNIQUES
The sample size was 400. This was calculated based on Fisher et al., 1998 formula (n = z2 pq ÷ d2) where:
n = desired sample size;
z = standard normal deviation which is 1.96;
p = proportion of the target population estimated to have characteristics being measured. The 38.5% (0.385%) will be used since it is the proportion of all children 6-23 months of age in Kenya who are fed in accordance with IYCF Practices (KNBS and ICF Macro 2010).
q = population without the characteristics being measured (1-0.385)
d = degree required for accuracy which is 0.05. n=1.962 (0.385) (1-0.385) ÷ (0.052)
n=363.8
The calculated sample size was inflated by 10% to cater for non-response.
10/100363.8= 36.38 363.8+36.38=400.18
Approximate sample size =400
Multi-stage sampling technique was used for the study. First, Narok county and Narok south sub-county were purposively sampled. The reason why Narok south sub county was selected is because it is the largest in terms of Maasai population, (Christian aid 2013). Then two out of three administrative wards in the sub county were selected by simple random sampling using a table random numbers. In the third stage, five villages from each ward in the two administrative wards were selected using simple random sampling. A sample of 40 eligible households were selected from each village and was done using simple random sampling.
III. DATA COLLECTION INSTRUMENTS AND PROCEDURES
The standard WHO questionnaire for Infant and Young Children Feeding was used to collect information on complementary feeding practices. (IYCF) (WHO, 2010a)
Focus group discussion (FGD) guide (Appendix C) was administered to mothers and care givers with children or infants 6-23 months of age to solicit in-depth information on the factors influencing choice of complementary feeding practice.
Page 3 www.ijiras.com | Email: contact@ijiras.com Anthropometric instruments used included: Mid Upper
Circumference Non-elastic tapes (MUAC tapes) to determine mild and severe malnutrition. A Salter scale was used to measure the weights of the children while length or height boards were used to measure the length and height of the children. These anthropometric tools have been recommended by WHO (de Onis, Garza, Victoria, Onyango, & Martines, 2004). One time face to face interviews were conducted with the mothers/caregivers of children 6-23 months old during a one-time household visit. Mothers were asked specific questions by the interviewer to elicit information on complementary feeding practices, morbidity and socio economic characteristics. Respondents were asked to report everything that they had to eat or drink on the previous day between midnight and midnight. This recall session is not interrupted. At the end of the recall, respondents are invited to add any additional items not initially recalled. Collection of detailed information concerning the items in the quick list.
The interviewer reviews all the food eaten and drunk in chronological order, prompts for any additional eating or drinking occasions or foods/drink possibly consumed and clarifies any ambiguities regarding type of food eaten or portion size. Finally the interviewer asks the respondent to name the place where each food or drink item was consumed. All of the information gathered is recorded by the interviewer on the record sheet in the booklet called Food Consumption Record: Individual 24-hour recall.
The discussion groups comprised of 8-10 participants (mothers) at Narok South-Sub County. Respondents provided information on cultural factors influencing complementary feeding practices. The participants for the groups were selected from identified villages. Discussions lasted for 45-90 minutes, and were tape recorded. Focus group discussions were conducted by the researcher and the research assistant did the recording.
Key informants including nurses, nutritionists, community health workers, mothers and old women in the community. The guide consisted composed of structured questions which elicited information on current recommendations of IYCF.
Weight and length measurements were taken. The weight of the sampled children was measured in kilograms using Salter scale. Weight was taken twice, with minimum clothing to the nearest 0.1 kg; this was done in a warm room and measurement recorded immediately. The measurement was taken at eye level. The mean of the two weights was then computed. If any pair of the reading exceeded the maximum allowable difference (100 grams), the prior measurements was discarded and weighing was repeated (de Onis et al., 2004). The scale was calibrated with a known weight before taking the measurements.
A child meter used to measure recumbent length of young children below 24 months of age was used with the help of the mother holding the baby straight and closer to the measuring child meter. Length/height to the nearest 0.1 cm. the mother/caregiver placed the child on the length board and held the child‟s head in place as they lay down on the length board while the person taking the measurements held the legs. Before taking the reading, the child was barefoot with the heels; buttocks, shoulders and the back of the head touching
the board. The length reading was taken twice and mean of the two was computed to get the child length, which was then recorded in the questionnaire. If any pair of the readings exceeded the maximum allowable difference (0.7 centimeters), the prior measurements were discarded and the length measurement was repeated (de Onis et al., 2004). Measurements for MUAC were taken to the nearest 0.5 mm for children less than 60 months, using children MUAC tape. MUAC was taken twice between elbow and shoulder. The mean of the two was computed to get the child MUAC, which was then recorded in the questionnaire.
IV. DATA ANALYSES, CODING, CLEANING OF DATA The data was checked, cleaned and coded. The Quantitative data was entered and analyzed using statistical packages for social sciences (SPSS) version 22. Anthropometric data was entered and analyzed using ENA for SMART package, 2011, then exported to SPSS. The WHO 2006 cut offs on anthropometric measurements of infant and young children were used to interpret the nutritional status. Child growth standards and Z-score cut offs were applied; below 3SD were categorized as severe malnutrition, above -3SD and below -2SD as moderate malnutrition, above -2SD and below -SD as mild malnutrition and above -1SD as normal growth and nutrition status. Descriptive statistics (mean, standard deviation, frequencies and percentages) was used to describe the study population on maternal demographic and socioeconomic characteristics, prevalence of complementary feeding. Chi Square was used to test Association between consumption of different food groups and socio-economic status of households/mothers, and morbidity patterns in children aged 6-23 months. T-test and ANOVA was used to test the differences in mean z-scores (nutrition status) by mode of feeding (complementary feeding). Pearson product moment correlation was used to analyze continuous data to get the association between dependent and independent variables such as complementary feeding practices. P-values of < 0.05 will be considered significant. The qualitative data from the Focus Group Discussion (FGD) and Key Informant Interviews (KII), was transcribed, verbatim and translated into English by researcher assisted by the research assistant. They were then read through several times and information from the FGDs are coded and categorized into themes. They were presented through notes and tables.
Page 4 www.ijiras.com | Email: contact@ijiras.com The researcher sought thumb printed informed voluntary
consent of the respondents (Appendix A) and participants were briefed on the research procedures and assured of confidentiality of information collected, this was done by using codes instead of names. Potential benefits of the study to the community were articulated clearly and unambiguously. No risks or harmful effects were recorded during the study since no substances were ingested or administered to the participants. Research participants were considered partners, not research subjects and the community will be informed of study results. Those found malnourished were counseled and referred to the health facility nearby.
VI. RESULTS
A. SOCIO-DEMOGRAPHIC CHARACTERISTICS OF
HOUSEHOLDS
Majority of the households in the study sample (91.3%) were male headed; female headed household accounted only for 8.8%. Mothers and caregivers aged 20-29 years was 79% and majority 91% were married, 8.5% were separated and the rest were either single or married at 0.3% each. A look at the head of household‟s education showed that most had primary level education (29.1%). This was followed by secondary education at 22.8% and tertiary education at 21.3%. Almost one in every four respondents (26.8%) had no education. The table below (table 1) highlight the above findings.
N=400
Characteristics n (%)
Maternal/caregivers age in complete years
13 -19 9 2.3
20-29 316 79
30-39 41 10.3
40-49 34 8.5
Marital status
Single 1 0.3
Married 364 91
Separated 34 8.5
Widowed 1 0.3
Occupation of household head
Not employed 110 27.5
Employed (salaried) 108 27
Small scale trading 147 36.8
Casual labor 35 8.8
Education level of Household Head
No education 107 26.8
Primary 116 29
Secondary 91 22.8
Tertiary 85 21.3
Table 1: Socio-demographic characteristics of the mothers/caregivers
Slightly more than a third (36.8%) of the household heads were employed in small scale trading, 27.0% were in regular salaried employment while 8.8% were employed as casual
laborers. The unemployment rate among the household heads at the time of survey stood at 27.5%. Save for 35% and 8.8% of the caregivers who were engaged respectively in small scale trading business and casual laborers, all the other caregivers were unemployed at the time of survey. Table 1 describes some of the socio-demographic characteristics of the study population.
The mean and median household size of the sampled population was 5.87 (±2.2) and 5 respectively. The mean number of children per household was 3.52 (±1.7). All the households had one child below five years old.
B. COMPLEMENTARY FEEDING PRACTICES
WHO developed simple, valid and reliable indicators which assisted in measurements of Infant feeding practices WHO (2008b). Breastfeeding and complementary feeding indicators that focus on selected food related aspects of child feeding associated with, amenable to population level measurement. The study focused on complementary feeding, but breastfeeding practices were necessary to show the gradual change.
Figure 4: Initiation of breastfeeding
Table 4: initiation of breastfeeding
VII. BREASTFEEDING AND COMPLEMENTARY FEEDING PRACTICES FROM FOCUS GROUP
DISCUSSION
The findings from FGDs were in agreement with the quantitative findings as most participants felt that all mothers should breastfeed their infants although this was the case it was not timely as recommended. Most Mothers had this to say (M3 FGD2 2016): “milk does not come immediately and the
Page 5 www.ijiras.com | Email: contact@ijiras.com Other participants in focus groups rejected the idea of
introducing other feed immediately saying it was not the right thing, „The nurse discouraged us not to give any other thing to
the baby‟ (M5 FGD1 2016). Mothers/caregivers gave reasons
for untimely or early introduction of other feeds as; the mothers-in-law insisted that the baby should not stay hungry because the mother had no milk yet because of exhaustion. The other reasons was the mother needed rest and therefore the child was now under the care of the mother who attending her. One mother in the FGDs (M3 FGD5 2016) emphasized,
“The baby will cry if they are not given anything and since
mother has no milk yet we give little glucose to
From FGD findings, complementary feedings was introduced earlier therefore this inappropriate feeding was associated with risk of child developing infections and diarrhea. “My child diarrhea and the doctor say it is because I
gave him porridge and milk before six months (M5 FGD3
2016.)
Mothers who practiced exclusive breastfeeding and timely introduction of complementary feeding reported to have received information from healthcare practitioners during their antenatal clinic visits, those who practiced timely complementary feeding it was not complicated and they saw its benefits as their children rarely developed stomach infections or diarrhea. Some mothers who did not practiced exclusive breastfeeding and adequate, timely complementary feeding said the child become sick and eventually died from diarrhea.
Another caregiver said she fed the child because the mother had gone away for long and hence the infant was hungry. “I fed the baby with milk the mother was away for
long and the child was crying,” (M1 FGD3 2016.)
Most mothers/caregivers agreed that poor complementary was widely practiced by the community because of cultural diversity and lifestyle. “Some mothers go herding cows or sheep therefore it is difficult to exclusively breastfeed, we
introduce children to cow’s milk and this is our culture.” (M2
FGD3 2016.)
Another had this to say, “I would like to follow what doctors and nurses tell me but I have other children to feed, I
have to go to the market.” (M3FGD32016). This was
confirmed by many mothers from findings of this study. Timely complementary feeding was rarely practiced and was confirmed by the FGDs.
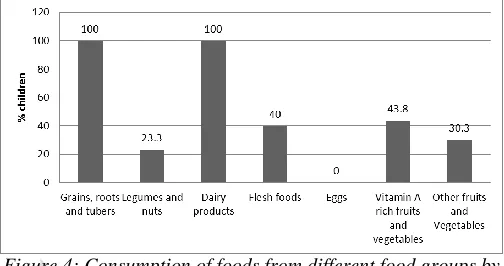
DIETARY DIVERSITY OF COMPLEMENTARY FOODS The children‟s dietary diversity was assessed based on seven food groups namely grains, roots and tubers, legumes and nuts, dairy products, flesh foods, eggs, vitamin A rich fruits and vegetables, and other fruits and vegetables. The mean dietary diversity score of the children was 3.8 (±1.3) food groups with a minimum of 2 food groups and a maximum of 5 food groups. (Table 4.3) shows the distribution of the children by their dietary diversity scores. Using the WHO categorization, well over half of the children (58.5%) of the children did not meet the minimum recommended score of 4 food groups and above and therefore were at an increased risk of nutrient inadequacy.
Dietary Diversity n N=400
<2 158 39.5
3 76 58.5
4 25 64.8
>5 141 100
Table 4: Distribution of children by number of food groups consumed
Practically all the children (100%) had eaten at least a food item form the grains, roots and tubers group and the dairy products group. Less than one-quarter of the children consumed foods items from the legumes and nuts group. In general, consumption of protein source is low among the children with no child having eaten the eggs. Similarly vegetable and fruit consumption is low. See (Figure 4.).
Figure 4: Consumption of foods from different food groups by children
Asked whether it is important to feed children a diverse diet, 90.8% responded affirmatively that it was essential while 9.2% of the respondents thought otherwise.
MINIMUM ACCEPTABLE DIET
During the FGDs mothers reported that children 6-23 months old should consume at least 3 meals in a day (figure 4.5).
Less than a quarter of the children 6-23 months old (15.4%, CI 11.9-19.8) attained a minimum acceptable diet. Children 12-17 months old category attained the highest (17.6%) followed by 18-23 months (16.5%) and lastly 6-11 months (13.3%) old categories
HYGIENE AND SAFETY PRACTICES DURING
COMPLEMENTARY FEEDING
During complementary feeding, proper hygiene is important so as to prevent diarrheal diseases that are caused by inadequate hygienic practices during handling of foods for the young child or during the actual feeding. Bottle feeding is discouraged as the bottles often expose the young child to unhygienic environment due to the challenge in cleaning the teats and the bottle itself. Bottle feeding was reported among 42% of the respondents.
Page 6 www.ijiras.com | Email: contact@ijiras.com
Figure 4.6: Practices of hand washing among the respondents
Morbidity patterns and health seeking behavior of the children of children 6-23 months
The health of the children was assessed using the morbidity pattern of the children within a 14 day recall period. 62% of the children were sick in the recall period of these 65.7% sought medical assistance by visiting traditional healer (13.7%), private clinic/pharmacy (31.5%), and public facility (54.8%) or by using local herbs (13.7%). As seen in figure 4.4.3, vomiting was the most common form of illness followed by malnutrition in the second place and diarrhea in the third place reported in 54.4%, 46.4% and 33.5% of the cases. Measles is least common form of illness reported among the children affecting only 0.4% of the cases.
Figure 4.9: Child morbidity patterns
CHILDREN‟S NUTRITION STATUS
The nutrition status of the children was assessed using the anthropometric indices namely weight-for-age z-score (WAZ), height-for-age score (HAZ) and the weight-for-height z-score (WHZ) to assess underweight, stunting and wasting respectively. The mid-upper arm circumference (MUAC) was also taken to assess the risk of malnutrition among the children. Table 4 presents the descriptive analysis of the anthropometric variables. 49.5% of the children were boys. Girls had a significantly higher mean weight and age in months compared to boys. Similarly, the girls‟ means of WHZ and WAZ were significantly higher than that of the boys. Boys on the other hand had higher means of length/height, MUAC and HAZ.
(Figure 10) describes the prevalence of malnutrition among the children in the study area. The prevalence of malnutrition measured by stunting, wasting and underweight among the children was 47.3%, 19.8% and 37.8% respectively.
Variable Sex of child Mean
Std.
Deviation
t(398)
value P-value
Weight (Kg) Male 7.50 1.14
-1.607 0.019
Female 7.80 2.29
Length/height
(cm)
Male 70.23 4.14
9.259 0.000
Female 65.86 5.22
MUAC (cm) Male 12.70 1.04
2.020 0.044
Female 12.48 1.08
Age of child
(months)
Male 9.67 2.66
-2.120 0.035
Female 10.47 4.60
WAZ Male -1.76 1.08
-5.799 0.000
Female -0.98 1.55
HAZ Male -1.08 1.42
9.814 0.000
Female -2.27 0.96
WHZ Male -1.54 0.97
-14.909 0.000
Female 0.47 1.64
Table 4.4: Descriptive analysis of the anthropometric variables
Figure 4.10
PREVALENCE OF MALNUTRITION IN CHILDREN Comparison of the prevalence of malnutrition between the boys and girls revealed that stunting and underweight was significantly higher in the girls (stunting, 67.3%; underweight, 44.1%) compared to the boys (stunting, 26.8%; underweight, 31.3%), (χ2= 65.995, p=0.000 for stunting and χ2=6.913, p = 0.009 in the case of underweight). On the other hand a bigger proportion of the boys had low weight-for-height (38.9%) compared with the girls (1.0%), χ2 =90.614, p = 0.000). A graphical presentation malnutrition levels by sex of the child is provided in figure 4.11.
Figure 4.11: Prevalence of malnutrition by sex of the child
Page 7 www.ijiras.com | Email: contact@ijiras.com feeding practices was conducted. Appropriate child feeding
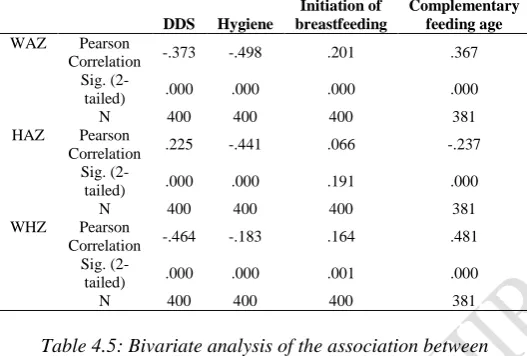
practices were assessed by breastfeeding initiation, age of introduction of complementary foods, food safety and hygiene during complementary feeding. Dietary diversity score of the children and frequency of feeding. Tables 5 shows the results of a cross tabulation between the prevalence of stunting, wasting and underweight and the child nutrition practices. The child dietary diversity score and hygiene practice had negative association with the child‟s weight-for age Z scores while the timely initiation of complementary food showed a negative association with the height for age of the children. Similarly weight – for height z – score was negatively associated with the child dietary diversity score. All the associations were significant at 0.01 confidence level apart from one, association between height – for age z – score and time of initiation of breastfeeding. Table 5 presents the results of the bivariate analysis.
DDS Hygiene
Initiation of breastfeeding
Complementary feeding age
WAZ Pearson
Correlation -.373 -.498 .201 .367
Sig.
(2-tailed) .000 .000 .000 .000
N 400 400 400 381
HAZ Pearson
Correlation .225 -.441 .066 -.237
Sig.
(2-tailed) .000 .000 .191 .000
N 400 400 400 381
WHZ Pearson
Correlation -.464 -.183 .164 .481
Sig.
(2-tailed) .000 .000 .001 .000
N 400 400 400 381
Table 4.5: Bivariate analysis of the association between nutrition indices and child feeding practices
VIII. DISCUSSION
The study reports high levels of malnutrition among children in the study area. Stunting as a form of malnutrition remains the biggest challenge in the study area; about one in every three children is too short for their age. The high stunting levels could have been due to micronutrient deficiency, which is evidenced by high consumption levels of carbohydrate based staples and the low consumption of vitamin and mineral rich fruits and vegetables. The micronutrient density of such diets is low, and is high in the phytate content which impairs micronutrient absorption, resulting in a high risk of inadequacy (Branca and Ferrari, 2002). Additionally, the inadequate childcare practices (Early introduction of complementary foods, inadequate breastfeeding practices and exposure to unsanitary conditions), combined with the interaction of infection can lead to poorly nourished children. Recurrent infectious diseases reduce appetite, increase metabolic requirements, and increase nutrient loss (Caulfield et al. 2006). Stunting levels are even higher in girls compared with the boys possibly due to the emphasis placed upon boys in the community with girls not highly valued as boys. This type of belief may mean that the boy child is favored and well taken care of than the girl
including feeding. The prevalence of wasting (44.1%) is also very high in this community. Child wasting primarily reflects severe short term deprivation of food in a child‟s immediate nutritional history, for example during episodes of disease such as diarrhea or in times of food shortage. In this study 62% of the children reportedly had suffered one or more form of illness in the two weeks preceding the survey. Acute respiratory infections and diarrheal illness were most prevalent forms of illnesses reported among the children. The presence of disease can result in reduced bioavailability, increased needs, nutrient losses or loss of appetite and can thus be an immediate cause of malnutrition. Possibly, some children suffered from more than one infectious disease thus culminating in this high rate of nutritional wasting.
Underweight or weight-for-age measure reflects both long term chronic malnutrition and recent food insecurity or illness. It can thus reflect prenatal under nutrition, infection and possibly inadequate childcare practices. A well-diversified diet is a sure way to achieve the important micronutrients of the body. In this study the diets reflects poor diversity with low consumption of the micronutrient rich animal source foods and fruits and vegetables and high consumption of the energy-dense staples.
IX. CONCLUSION
The micronutrients are known to be important for growth in the early stages of human life, where they are involved in linear growth (Nicklas, 2003; Singh, 2004). In the event that these micronutrients are deficient, the children may be experiencing metabolic shortages affecting the basic structure of their bones, which may manifest as growth failure as evidenced by high stunting levels. Similarly, it is also known that the human body utilizes dietary energy inefficiently in the presence of specific deficiencies of many vitamins and micronutrients (Prentice, 2000). Generally speaking, the body will use energy with maximal efficiency if all other necessary nutrients are present in adequate amounts. In this study, we report multiple micronutrient deficiencies. It is therefore possible that more of the children have not been able to meet their requirements for energy over the years leading to growth faltering. The children‟s food consumption and dietary patterns reflect monotonous diet that is high in carbohydrates and low in nutrient rich foods such as fruits and vegetables. Child malnutrition is widespread in the community with more than half of the children being stunted. The high malnutrition levels are associated with poor hygiene practices, inadequate breastfeeding practices and inadequate complementary feeding practices.
X. ABBREVIATIONS
Page 8 www.ijiras.com | Email: contact@ijiras.com SCN, sub-committee on nutrition, PAHO, pan- american
health organization, UNICEF, united nations children fund, WHO, world health organization, CF, complementary feeding.
ACKNOWLEDGEMENT
The authors thank Prof Mary Walingo and Dr. Lukaria of Maasai Mara University his consistent help in data analysis and funding.
FUNDING
The study was funded by authors and Prof Mary Walingo.
AVAILABILITY OF DATA MATERIALS
All the data supporting our findings is contained within the manuscript and additional files.
AUTHORS CONTRIBUTION
SMK, SO and IO, initiated conception of research idea, study design, coordination of data collection. SMK did data entry and analysis, interpretation of the data and drafting the manuscript; SO and IO Proposal revision and approval, study design, data entry and analysis, interpretation of the data and review of the manuscript. All authors have read and approved of the final version of the manuscript.
ETHICS APPROVAL AND CONSENT TO PARTICIPATE Kenyatta University Graduate School gave authority to conduct the study. Ethical and logistical clearance was sought from Kenya University Ethical Clearance Committee (KU/R/COMM/51/625). The Permit to do the research was obtained from National Commission for Science, Technology and Innovation (NACOSTI) (P/16/95660/10782). Permission was sought from County Commissioner of the location of study. Authority to conduct the research was also sought from County Director of Education (CDE/NRK/RES/VOL1/54). Voluntary informed consent of the respondents and were briefed on the research procedures and assured of confidentiality of information collected, this was done by using codes instead of names. Potential benefits of the study to the community were articulated clearly and unambiguously.
REFERENCES
[1] ACC/SCN, (1997).The Third Report on the world nutrition situation. Geneva, Switzerland.
[2] Aika, A.A., Omari, J., Chewe, L.C., Kankasa, L., Ganapati, J., Bhat& Bunn, J. (2003). Infant-Feeding practices of Mothers of known HIV Status in Lusaka. Zambia.
[3] Amanya, L. M., Khahoni, M. W., & A., L. O (2012). Psychological factors influencing breastfeeding behavior of mothers attending home-based clinics in the western, Kenya. International journal of multidisciplinary educational research, 1(I)
[4] Arimond, M., Daelmans, B., and Dewey, K.G. (2008). Indicators for feeding Practices in children. Lancet, 371:541-542.
[5] Bhan, R. (2010). Complementary feeding. Indian Journal for the practicing Doctor, 1(1), 2004-10.
[6] Berk, Laura, E. (2002).Child Development Manual (5th Ed) pg 25.
[7] Bhutta, Z. A., Hafeez, A., Risvi, A., Ali, N., Khan, A., Ahmad, F., Jafarey, S.N. (2013). Reproductive, maternal, newborn, and child health in pakistan: challenges and opportunities. The Lancet, 381 (9884), 2207-2218. Doi:10.1016/S0140-6736 (12)61999-0
[8] Bowman, B.A & Russell, R.M. (2001). Present Knowledge in Nutrition. 8th Ed, International Life Sciences Institute: Washington, Dc.
[9] Central Bureau of Statistics, Kenya Demographic and Health Survey, (2003) and (2008).
[10] Chelimo, F.L. (2008). Assessment of complementary feeding practices and nutritional status among children in Athi-river, Machakos District Kenya. Kenyatta University [11] County health office, (2014). Narok County Hospitals Statistical Report. Narok, Kenya: Narok County Health Statistics Office (unpublished).
[12] Dewey, K.G., (1998). Nutrition Growth and Complementary feeding of the Breastfed infant.
[13] Dewey, K.G., & Brown, K.H. (2003).Update on Technical Issues Concerning Complementary Feeding of Young Children in Developing Countries and Implication for Intervention Programmes. Food and Nutrition Bulletin 24 (1), 5- 28.
[14] FANTA & AED (Working group on Infant and Young Child Feeding indicators). (2007). Developing and validating simple indicators of dietary quality and energy intake of infants and young children in developing countries: Additional analysis of 10 data sets. Washington, DC, USA.
[15] Friedman N., Zeiger R., The role of breastfeeding in the development of allergies and asthma, (2008). Journal of Allergy and Clinical Immunology volume 115 pg 1238. [16] Gibson,R.S., FergusonE.L and Lehrfeld,J.(1998),
Complementary Foods for Infants Feeding in Developing Countries. Dunedin, New Zealand.
[17] GOK Narok District Development plan 2002-2008. Office of the Vice President and Ministry of planning and National Development Nairobi. (2002).
[18] Government of Kenya Central Bureau of statistics, (1982). Nairobi Infant Feeding Study. Nairobi: Government printer.
[19] Government of Kenya, (1982). 3rd, Child Nutrition Survey Nairobi: Government printer.
Page 9 www.ijiras.com | Email: contact@ijiras.com [21] Jens Finke, (2007). Traditional Music and Cultures of
Kenya. Frankfurt University Germany.
[22] Jones, G., Stekette, R.W., Black, R.E., Bhutta, Z.A., & Morris, S.S. (2003). How many child deaths can we prevent this year, Lancer Journal of Clinic Nutrition; 362: 65-71.
[23] Kabba, M.M. (2005). Breastfeeding Practices among Women. (15-49 years). A case study of Kibera Slum Nairobi; Kenya; AMREF, Kenya.
[24] Kasimba, S.N. (2013). Dietary diversity and nutritional status of children (6-23) months in Makindu division, Makueni County, Kenya. Kenyatta University library. [25] Katzenellen bogen, J.M., Joubert, G and Abdool Karim,
S.S. (2002). Epidemiology A manual for South Africa. Oxford University Press Southern Africa.
[26] Kenya National Bureau of statistics. (2003). Kenya Health and Demographic Survey. KNBS, KE 9-11. [27] Kenya National Bureau of Statistics, (KNBS & ICF
Macro (2010).Kenya Demographic and Health Survey 2008-09. Calverton, Maryland: KNBS and ICF Macro. [28] Kenya National Bureau of Statistics. (2014). Kenya
Population and Housing Census; Population distribution by administrative units. Nairobi. Kenya
[29] Khanal, V., Sauer, K., Zhao, Y., (2011) Determinants of Complementary feeding practices among Nepalese children aged 6-23 months: Findings from demographic and health survey, Western Australia. Australia.
[30] Kirsten, B., Simon, D., Regis, C., Valeria, D., Addiouma, D., and Francois, S.D. (2001). Children‟s Height, Health and Appetite Influence Mother‟s Weaning Decisions in Rural Senegal. Journal of Epidemiology Vol. 30 No. 3 pp. 476 -481.
[31] Kimani-Murage, E.W., Madise, N.J., Fotso, J., Kyobutungi, C., Mutua, K.M., Gitau, T.M, and Yatich N. (2011). Patterns and determinants of breastfeeding and complementary feeding practices in urban informal settlements, Nairobi Kenya. Biomedical Central Public Health Journal, 11:396.
[32] Korir, K.K., (2013) Determinants of complementary feeding practices and nutritional status of children 6-23 months old in Korogocho slum, Nairobi County, Kenya. Kenyatta University library.
[33] Makau, M.N. (2013). Feeding practices and nutritional status of children aged (0-59) months accompanying incarcerated mothers in selected women‟s prisons in Kenya. Kenyatta University library Kenya.
[34] Marie, A., Boyle and David, H., Holbem, (2005). Community Nutrition in Action. Thomson learning Academic Resource centre, USA.
[35] Mconald, C. M., Kupka, R., Manji, K. P., Bosch, R., Aboud, S., & Kisenge, R. (2012). Predictors of stunting, wasting and underweight among Tanzanian children born to HIV-infected women. European Journal of Clinical Nutrition,66(11),1265-1276. http://doi.org/10.3945/jn.111 .148874
[36] Ministry of Planning and Development, (2005). Achieving Millennium Development Goals in Kenya. Government printer.
[37] Ministry of Public Health and Sanitation, (2010).National Strategy on Infant and Young Child Feeding.2007-2010.Government printer.
[38] Murage E., Madise N.J. Jean- Christopher F., Catherine K., Martin M.K., Gitau T.G & Nelly Y. (2011). Patterns and determinants of breastfeeding and complementary feeding practices in urban informal settlements, Nairobi Kenya BMC Public Health Journal, 11:396 c/o: 10:118 6/1471-2458-11-396.
[39] Mugenda, O.M., and Mugenda, A.G. (2003).Research Methods; Quantitative and Qualitative Approach. Nairobi: African Centre for Technology Studies.
[40] Mugo, G. M., Influenceof maternal nutrition knowledge on infant: feeding practices among the Maasaicommunity in Narok District, Kenya. University of Nairobi.
[41] National Council for Population and development Ministry of Planning and National Development, (1998 and 2003). Nairobi, Kenya.
[42] Norris, F.J., Larkin, M.S., Williams, C.M., Homton, S.M., and Morgan, J.B., (2002). Factors affecting the Introduction of Complementary Foods in the Preterm Foods in the Preterm Infant. Journal of Clinic Nutrition Vol. 56, No. 5pp 448-454.
[43] Ochola, S. A. (2008). Evaluation of two counseling strategies promoting exclusive breastfeeding among HIV- negative mothers in Kibera slum, Nairobi, Kenya: A randomized controlled trial. PhD Thesis. Stellenbosch University, South Africa.
[44] Paget, S.B., Balldin Z.V., Community Health AMREF 1999. Government Printers, Kenya.
[45] Pan American Health Organization (PAHO) and World Health Organization (WHO) (2003).Guiding Principles for Complementary Feeding of the Breastfed Child. Washington, DC.
[46] Parada, C.M., Carvalhaes, M.A., & Milena, T.J (2007).Complementary Feeding Practices to Children during their Year of Life. Revista Latino-Americana Enfermagem, 15 (2), 282-289.
[47] Theron, M., Amissah, A., Kleynhans, I. C., Albertse, E., MacIntyre, U. E. (2007). Inadequate dietary intake is not the cause of stunting amongst young children living in an informal settlement in Gauteng and rural Limpopo province in South Africa: the NutriGro study. Journal of Public Health Nutrition; 10 (4):379-89.
[48] United Nations Administrative Committee on coordination sub-committee on Nutrition (ACC/SCN) (2004). Fifth Report on the World Nutrition situation, Geneva.
[49] UNICEF (2002). Global Strategy for Infant and Young Child Feeding. Geneva. Switzerland.
[50] UNICEF (2011). Infant and Young Child Feeding. Program guide.
[51] USAID/ UNICEF/ WHO, (2010).Indicators for Assessing Infant and Young Child feeding Practices, part 3, County Profiles, WHO Press, Geneva, 11-23.
Page 10 www.ijiras.com | Email: contact@ijiras.com [53] WHO (2010).Indicators for Assessing Infant and Young
Child Feeding Practices part2: Measurement. WHO library cataloguing-in-publication data. Dept of Child and Adolescent Health and Development. ISBN 978 92 4 159929 0 (NLM classification: WS 120).
[54] WHO Country Office (1994) 5th Nutrition Survey UNICEF Geneva. Switzerland.
[55] WHO (2002).Complementary feeding: report of the global consultation and summary of guiding principles for complementary feeding of the breastfed child. Geneva Switzerland.
[56] WHO/UNICEF (1998).Complementary feeding of young children in developing countries: a review of current
scientific knowledge. (WHO Geneva: WHO/NUT/98.1) Geneva: World Health Organization.
[57] WHO/UNICEF/USAID (2004).National guidelines on infant and young child feeding practices. WHO press. Geneva.
[58] WHO, Evidencefor the Ten Steps to Successful Breastfeeding, Pub. No. WHO/CHD 98.9 (Geneva: WHO 1998)
[59] Wood, C.H., Glanville, H.de and Vaughan, J. P. (1997). Community Health. AMREF.
[60] Wood, C.H., Glanville, H. de and Vaughan, J.P. (2008). Community Health. AMREF Nairobi, Kenya.