ISSN (Online) 2249-6084 (Print) 2250-1029 www.eijppr.com
The Effect of Insulin Resistance on Oocyte
Maturation and Embryo Quality in PCOS Patients
Undergoing ICSI
Wasan Hamad Jassim*, Manal Taha Al-Obaidi, Wasan Adnan Abdulhameed
High institute for infertility diagnosis and assisted reproductive technologies, Al-Nahrain University.
ABSTRACT
Background: Poly cystic ovarian syndrome (PCOS) is a common endocrine disorder, and it is one of the important causes of female infertility; the syndrome acquired its widely used name from the common sign on ultrasound examination of multiple (poly) ovarian cysts, and PCOS is multifactorial in origin. It is caused by the combination of genetic and environmental factors. The pathogenesis of PCOS leads to the insulin resistance and hyperinsulinemia, which are commonly observed in these patients, it has been assumed that when an insulin signal transduction changes in PCOS patients, it may result in insulin resistance, which consequently leads to the abnormal ovarian steroidogenesis. Objective: To study the effect of insulin resistance on the oocyte maturation, and the number of good quality embryos in PCOS patients undergoing ICSI. Patients and method: This prospective study was undertaken in the Higher Institute of Infertility diagnosis and Assisted Reproductive Techniques / Al-Nahrain University and in Kamal AL-Samarai Hospital (Baghdad/Iraq) during the period from July 2016 to April 2017. The participants of the study were 58 infertile women, forty of them had Polycystic ovary syndrome (twenty of them had insulin resistance (IR) and the other twenty were non-insulin resistant (NIR)), and eighteen non PCOS women were considered as the control. Controlled ovarian hyperstimulation was conducted on all of them for intracytoplasmic sperm injection cycle. Long agonist protocol was used as the ovulation induction protocol in all the cases. The assessment of oocyte maturation was done for all the cases. Results : The total numbers of oocytes, MII, fertilized MII, and embryos were significantly higher in the PCOS (NIR) group than the PCOS (IR) and the control groups; and the p-values were (0.006, 0.005, 0.001, 0.002); respectively. The duration of stimulation was significantly shorter in PCOS (NIR) group than the other two groups; and the p-value was (0.035). Conclusion: Insulin resistance can be assumed as an indicator of poor oocyte maturation, poor embryo quality, and long duration of stimulation.
Key Words: IVF, ICSI, IR, oocyte & embryo quality.
eIJPPR 2019; 9(1):36-43 HOW TO CITE THIS ARTICLE: Wasan Hamad Jassim, Manal Taha Al-Obaidi, Wasan Adnan Abdulhameed(2019). “The Effect of Insulin Resistance on Oocyte Maturation and Embryo Quality in PCOS Patients Undergoing ICSI”, International Journal of Pharmaceutical and Phytopharmacological Research, 9(1), pp.36-43.
INTRODUCTION
Infertility has been considered as a complex disorder which leads to the remarkable medical, psychosocial, and economic problems, and it has been defined as failure to achieve a successful pregnancy within 12 months or more of regular unprotected sexual intercourse, and can be classified into primary and secondary infertility [1]. Polycystic Ovary Syndrome (PCOS) has been one of the important causes of female infertility. The ultrasound
criteria for polycystic ovaries have been defined as the existence of 12 or more follicles measuring 2 to 9 mm in diameter and /or an increased ovarian volume > 10 cm3on trans vaginal ultrasound scanning; and PCOS can be diagnosed even when only one polycystic ovary is present [2]. Polycystic ovarian syndrome (PCOS) is "a heterogeneous collection of signs and symptoms that together form a spectrum of disorders with mild presentation in some patients, while in others, severe disturbances of reproductive, metabolic, and endocrine function [3], and it is multifactorial in origin [4].The
Corresponding author: Wasan Hamad Jassim
Address : High institute for infertility diagnosis and assisted reproductive technologies/ Al-Nahrain University .
E-mail:wasan.hamad@gmail.com
Relevant conflicts of interest/financial disclosures: The authors declare that the research was conducted in the absence of any commercial or financial relationships that could be construed as a potential conflict of interest .
ISSN (Online) 2249-6084 (Print) 2250-1029 www.eijppr.com
37 pathogenesis of PCOS has been linked to the
development of insulin resistance and hyperinsulinemia, which is usually observed in these patients [5]. An altered insulin signal transduction in PCOS patients has been considered to cause insulin resistance, which consequently leads to the abnormal ovarian
steroidogenesis [6]. From the time of first in vitro
fertilization (IVF), it is a procedure that involves surgical removal of the mature oocyte from the ovary and
fertilization by sperm in the laboratory [7]. IVF has been
proven to be highly effective therapy to cure infertility, and can help couples who are childless due to the etiologic reasons (female or male factor infertility, or combined). The procedure of intracytoplasmic sperm injection (ICSI) includes deposing a single spermatozoon directly into the cytoplasm of the oocyte, and bypassing the zona pellucida and the oolemm [8]. This technique has been time consuming and expensive, therefore efforts have been made to set the factors which predict successful outcomes in a given patient or couple.
PATIENTS, MATERIAL AND METHODS
Patients:
Fifty eight infertile couples underwent ICSI cycles, forty of them had Polycystic ovary syndrome (twenty of them with insulin resistance (IR) and the other twenty were non-insulin resistant (NIR)), and eighteen of them were non PCOS women who were considered as the control, were enrolled in this prospective case control study. The current investigation was confirmed by Local Medical Ethical Committee of the High Institute of Infertility Diagnosis and Assisted Reproductive Technologies, Al-Nahrain University; and patients with thyroid dysfunction, cushing's syndrome, hyperprolactinaemia, late onset congenital adrenal hyperplasia, hypogonadotropic hypogonadism, Uterine pathology and patients who took glucophage or inositol supplement drugs were excluded. All patients were subjected to full history taking, complete physical examination, measurement of BMI, plasma hormone level (FSH, LH, LH/FSH ratio, and estradiol) in cycle day 2 and estradiol at the day of hCG, ultrasound examination to detect polycystic ovaries, and the measurement of the fasting blood glucose and fasting insulin level in day of oocyte retrieval.
All patients were treated with the same long agonist protocol of GnRH analogue (Decapeptyl® 0.1 mg, Ferring Co., Germany) administered from the day 21 of the preceding mid – luteal phase, and continued until the day of HCG injection in a daily dose of 0.1 mg s.c. The ovarian stimulation started from the day 2 of menstrual cycle - after pituitary desensitization with a daily dose of 150–450 IU rFSH (follitropin alfa, Gonal F®, Merck
Serono). The patients were monitored by trans-vaginal sonography (TVS). HCG (Ovitrelle® 250 microgram, Merck Serono) was given when 3 or more follicles reached a diameter of 18 mm.
IVF procedures
Oocyte retrieval was done 34-36 hours after HCG injection with the guidance of transvaginal ultrasound, once the oocyte-cumulus complexes were all collected, they were washed with flushing media to expel any blood remaining from the follicular aspirate, then transferred into drops of Ferticult Flushing media and washed by Gain medium, and overlaid by paraffin/ mineral oil in an incubator at 37°C with 5-6% CO2, and at 95% humidity. The ICSI procedure was performed (4–6) hours after oocyte retrieval to all patients. In preparation for intracytoplasmic sperm injection, combined enzymatic and mechanical treatments were used to remove the cumulus corona cells, and to denude the oocytes from the cumulus cells. The assessment of each oocyte was carefully done, observing the presence or absence of a germinal vesicle or the first polar body.
Only those ova that have been extruding the first polar body considered as (metaphase II) and morphologically intact were suitable for microinjection. So, the oocyte were graded into three stages including: GV stage: intracytoplasmic nucleus called the ‘germinal vesicle’ (GV), characteristic of prophase I of the first meiotic division; MI stage: has neither a visible germinal vesicle (GV) nor first polar body (PBI); and MII stage: displays the first polar body (PBI).
Around 12-17 hours after ICSI procedure, the fertilization was assessed for the evidence of normal fertilization which was defined as the existence of two pronuclei (2PN).
Prior to embryo transfer, the developed embryos were graded in accordance with embryo grading system [9]. According to this system, the embryo was graded as grade1, 2 and 3. Grade 1: embryo with less than 10%
fragmentation, stage-specific cell size, no
multinucleation. Grade 2: embryo with 10–25% fragmentation, stage-specific cell size for the majority of cells, no evidence of multinucleation. Grade 3: embryo with severe fragmentation (>25%), cell size not stage specific, evidence of multinucleation.
Measurement of fasting blood glucose and fasting insulin level
ISSN (Online) 2249-6084 (Print) 2250-1029 www.eijppr.com
38 Measuring the blood sugar using a spectrophotometer by
doing the test after 8-12 hours fasting: This test is usually done as the first thing in the morning, before breakfast using diagnostic kit (fasting blood sugar kit, spin react, spin).
Determination of fasting serum insulin levels by (ELISA) technique using diagnostic kit (Human Insulin ELISA Kit, Accu Bind, USA): Insulin resistance was identified using the homeostatic model assessment (HOMA) which is a method used to quantify insulin resistance and beta-cell function. HOMA was measured by using the following equation [10]:
HOMA-IR= fasting insulin (microU/L) x fasting glucose (nmol/L)/22.5.
Normal value: < 2 in adults [11].
Statistical analyses
The analysis of the data was carried out using the SPSS-24 (Statistical Packages for Social Sciences- version SPSS-24); the data were presented in simple measures of frequency,
percentage, mean, standard deviation, and range. The significance of the differences between different means (quantitative data) was tested using Students-t-test for the differences between two independent means, or ANOVA test was used for the differences among more than two independent means.
RESULTS
Demographic information and Hormonal profile for the subjects
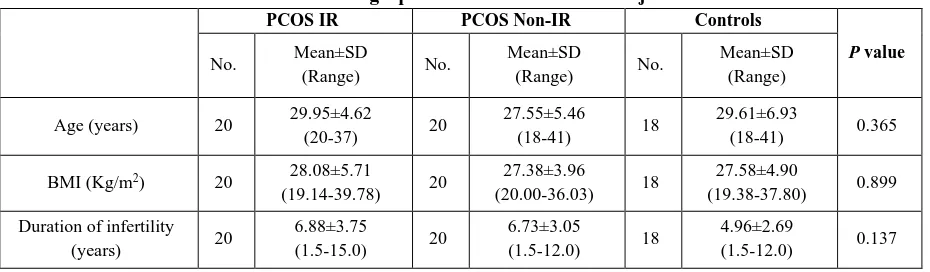
A total number of 58 patients enrolled in ICSI cycles in this prospective study, the demographic data of the PCOS patients with insulin resistance (PCOS IR), PCOS patients with insulin resistance (PCOS NIR) group, and non-PCOS patients (control) group have been shown in (Table1). The statistical analysis showed no significant differences among the three groups concerning the age, BMI, and duration of infertility, and the p values were (0.365, 0.899, 0.137); respectively.
Table 1: Demographic information for the subjects
PCOS IR PCOS Non-IR Controls
P value
No. Mean±SD
(Range) No.
Mean±SD
(Range) No.
Mean±SD (Range)
Age (years) 20 29.95±4.62
(20-37) 20
27.55±5.46
(18-41) 18
29.61±6.93
(18-41) 0.365
BMI (Kg/m2) 20 28.08±5.71
(19.14-39.78) 20
27.38±3.96
(20.00-36.03) 18
27.58±4.90
(19.38-37.80) 0.899
Duration of infertility
(years) 20
6.88±3.75
(1.5-15.0) 20
6.73±3.05
(1.5-12.0) 18
4.96±2.69
(1.5-12.0) 0.137
In the present study, it was found that forty two of the patients (72.40%) had primary infertility, and sixteen patients (27.60%) had secondary infertility, from the twenty PCOS (IR) patients it was found that thirteen of them had primary infertility, and seven of them had secondary infertility. Also, eighteen from the twenty PCOS (NIR) patients had primary infertility, and two had secondary infertility, while in the control group, eleven from eighteen had primary infertility, and seven had secondary infertility; and it was found that there was no
significant difference among the three groups, and the p
-value was (0.091).
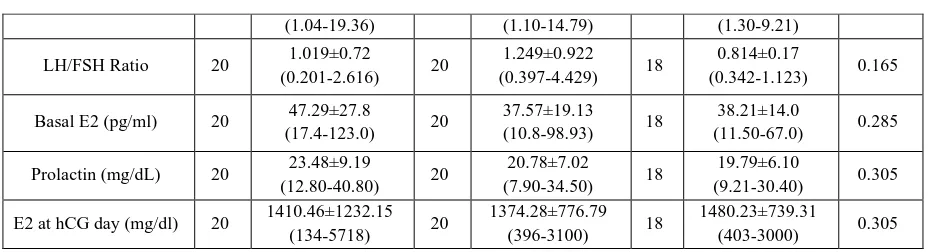
Hormonal profile done for all patients has been shown in table (2); the mean of basal FSH and LH and LH/FSH ratio, prolactin, basal estradiol (E2) and estradiol (E2) at the day of hCG showed that there were no significant differences among the three groups (PCOS (IR), PCOS (NIR), and control); and the p values were (0.466, 0.407, 0.165, 0.305, 0.285, 0.305); respectively.
The differences were not significant, but it was noticed that the basal LH hormone level was higher in PCOS (IR) and (NIR) groups than in the control group.
Table 2: Hormonal profile of the subjects
PCOS IR PCOS Non-IR Controls
P value
No. Mean±SD
(Range) No.
Mean±SD
(Range) No.
Mean±SD (Range)
FSH (mg/dL) 20 6.48±2.03
(2.50-10.40) 20
5.73±1.96
(1.90-9.50) 18
6.08±1.70
(3.10-9.43) 0.466
ISSN (Online) 2249-6084 (Print) 2250-1029 www.eijppr.com
39
(1.04-19.36) (1.10-14.79) (1.30-9.21)
LH/FSH Ratio 20 1.019±0.72
(0.201-2.616) 20
1.249±0.922
(0.397-4.429) 18
0.814±0.17
(0.342-1.123) 0.165
Basal E2 (pg/ml) 20 47.29±27.8
(17.4-123.0) 20
37.57±19.13
(10.8-98.93) 18
38.21±14.0
(11.50-67.0) 0.285
Prolactin (mg/dL) 20 23.48±9.19
(12.80-40.80) 20
20.78±7.02
(7.90-34.50) 18
19.79±6.10
(9.21-30.40) 0.305
E2 at hCG day (mg/dl) 20 1410.46±1232.15
(134-5718) 20
1374.28±776.79
(396-3100) 18
1480.23±739.31
(403-3000) 0.305
Number of Gonadotropin hormone ampules used in ICSI cycle
The mean number of ampoules of Gonadotropin hormone(GnH) used for the controlled ovarian hyperstimulation in PCOS patients with insulin resistance, PCOS Non- insulin resistance and in control groups that enrolled in ICSI cycle in this study which has been expressed as (mean ± standard deviation) were (22.50±6.42; 20.45±5.24 and 21.44±5.59; respectively) with ranges of (9-33), (11-33) and (10-33); respectively, even the statistical analysis showed that there were no
significant differences among the three groups, and the p
-value was (0.536), but it was noticed that there was a lesser number of ampoules used in PCOS (NIR) group than the other two groups as shown in table (3).
Duration of stimulation
In the current study, the mean duration of stimulation(days) established among the PCOS (IR),PCOS (NIR) and control groups, expressed as (mean
± standard deviation) were (12.10±1.68;10.80±1.44;11.39±1.50) with the ranges of
(9-15), (9-14), and (9-14); respectively, it was shorter in PCOS (NIR),and the statistical analysis showed that there was a significant difference among the three groups,
and the p-value was (0.035) as seen in table (3).
Comparison among PCOS patients with (IR), PCOS patients with (NIR) and control groups in ICSI Parameters
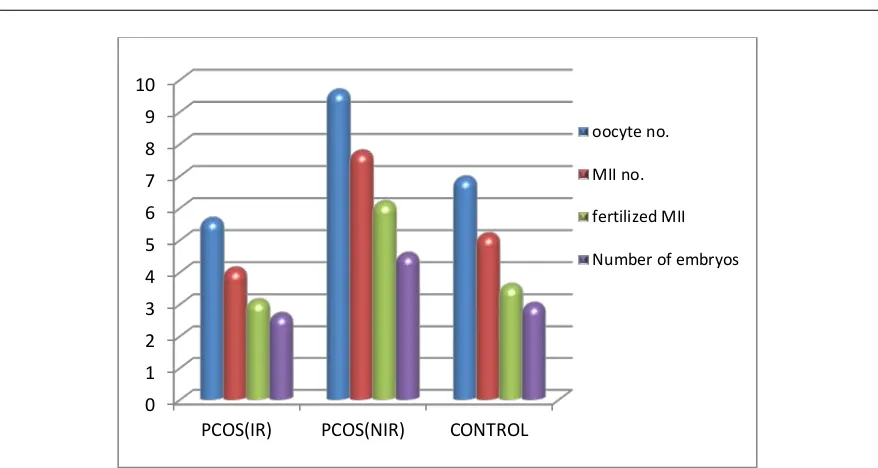
• Total number of retrieved oocytes:
With reference to the mean of the total oocytes number ± SD in PCOS (IR), PCOS (NIR) and control group were (5.65±3.57,9.65±4.50and6.94±3.39); respectively. The total number of the retrieved oocytes was significantly
higher in PCOS (NIR) than the other groups, and the p
-value was (0.006) as noticed in table (3) and figure (1). A highly significant difference was found between (PCOS
(IR) and PCOS (NIR), and the p value was (0.004), also a
highly significant difference was found between (control
and PCOS (NIR) groups), and the p value was (0.045) as
shown in table (4).
• Number of metaphase ІІ (M ІІ) oocytes:
In this study, concerning the mean numbers of mature oocytes [metaphase II (MII)] ± SD found in PCOS patients with (IR), PCOS patients (NIR) and control
group were (4.10±2.92, 7.75±4.35and5.17±2.83); respectively; it was noticed that the PCOS (NIR) group had the largest number of mature MII oocytes, The statistical analysis showed a high significant difference
among the three groups, and the p-value was (0.005) as in
table (3) and figure (1). A highly significant difference was found between (PCOS (IR) and PCOS (NIR)groups),
and the p value was (0.003), also a highly significant
difference was found between (control and PCOS
(NIR)groups), and the p value was(0.039) as shown in
table (4).
• Fertilized MII:
In the current study, the mean number of fertilized metaphase II (MII) ± SD. In PCOS (IR), PCOS (NIR) and control group were (3.11±2.16, 6.17±3.17 and3.59±2.21); respectively; it was noticed that the PCOS (NIR) group had the largest number of fertilized MII. The statistical analysis showed a high significant difference among the
three groups and the p-value was (0.001) as seen in table
(3) and figure (1). A highly significant difference was found between (PCOS (IR) and PCOS (NIR) groups), and
the p value was (0.001); also a highly significant
difference was found between (control and PCOS (NIR)
groups), and the p value was (0.009), as shown in table
(4).
• Number of Embryos:
With regard to the number of embryos, this study found that the mean numbers of embryos± SD in PCOS (IR), PCOS (NIR) and control group were (2.68±1.57, 4.56±1.72and 3.00±1.32 ); respectively; it was noticed that the PCOS (NIR) group had the largest number of embryos. The statistical analysis showed that there was a highly significant difference among the three groups, and
the p-value was (0.002) as shown in table (3) and figure
(1). A highly significant difference was found between
(PCOS (IR) and PCOS (NIR) groups), and the p value
was (0.001), also there was a highly significant difference found between (control and PCOS (NIR) groups), and the
p value was (0.005), as shown in table (4).
ISSN (Online) 2249-6084 (Print) 2250-1029 www.eijppr.com
40 Table (3) exemplifies that no significant difference was
declared among the three groups concerning abnormal oocytes, ruptured and immature oocytes (germinal vesicle
and metaphase I) that were found in the PCOS (IR),
PCOS (NIR) and control groups; and the p-values were
(0.552, 0.187, 0.601, 0.683); respectively.
Table 3: ICSI Parameters of PCOS (IR), PCOS (NIR), and Control Groups.
ICSI parameters
PCOS IR PCOS Non-IR Controls
P value
No Mean±SD
(Range) No
Mean±SD
(Range) No
Mean±SD (Range)
Oocytes number 20 5.65±3.57
(1-12) 20
9.65±4.50
(3-21) 18
6.94±3.39
(1-12) 0.006**
MII 20 4.10±2.92
(1-10) 20
7.75±4.35
(1-17) 18
5.17±2.83
(1-10) 0.005**
Fertilized MII 19 3.11±2.16
(1-7) 18
6.17±3.17
(1-14) 17
3.59±2.21
(1-9) 0.001**
Number of embryos 18 2.77±1.55
(1-7) 18
4.56±1.72
(1-7) 17
3.00±1.32
(1-5) 0.002**
Abnormal Oocytes
20 0.5±0.76
(0-2) 20
0.75±1.16
(0-4) 18
0.44±0.78
(0-3) 0.552
Ruptured Oocytes 20 0.5±0.76
(0-2) 20
0.15± 0.36
(0-1) 18
0.33±0.59
(0-2) 0.187
GV 20 0.2±0.52
(0-2) 20
0.25±0.55
(0-2) 18
0.38±0.69
(0-2) 0.601
MI 20 0.55±0.88
(0-3) 20
0.8±1.005
(0-3) 18
0.61±0.91
(0-3) 0.683
duration of stimulation/day 20 12.10±1.68
(9-15) 20
10.80±1.44
(9-14) 18
11.39±1.50
(9-14) 0.035*
No of GnH ampules 20 22.50±6.42
(9-33) 20
20.45±5.24
(11-33) 18
21.44±5.59
(10-33) 0.536
Table (4): The comparison in ICSI parameters between each two groups.
ICSI parameters PCOS IR x PCOS Non-IR
(p-value)
PCOS IR x Control (p-value)
PCOS Non-IR x Control (p-value)
Oocyte number 0.004* 0.261 0.045*
MII (Best one) 0.003* 0.262 0.039*
Fertilized MII 0.001* 0.512 0.009*
Number of embryos 0.001* 0.520 0.005*
PCOS = polycystic ovary syndrome, IR= insulin resistance, NIR= non- insulin resistance, MII=metaphase II, *significant difference at 0.05
Fig. 1: Comparison among PCOS patients with (IR), PCOS patients with (NIR) and control groups in ICSI Parameters.
0 1 2 3 4 5 6 7 8 9 10
PCOS(IR) PCOS(NIR) CONTROL
oocyte no.
MII no.
fertilized MII
ISSN (Online) 2249-6084 (Print) 2250-1029 www.eijppr.com
41 DISCUSSION
The follicles maturation is usually evaluated by serum estradiol (E2) concentration. Serum E2 measurement is important to foretell the timing of ovulation when treating infertility patients. Approaching the date of ovulation, there will be dynamic changes in the E2 level, particularly in ICSI program. In pre-menopausal women, E2 is majorly secreted by granulosa cells in the follicles. Because of the divisions and proliferations of the cells inside a follicle, their number increases as the follicle becomes bigger, and consequently the E2 level also enhances. Hence, the E2 concentration can be considered
as a good indicator of follicular maturation[12].
In the current study, there was no significant difference in the E2 level at the day of hCG in the PCOS (IR), PCOS (NIR) and control groups as shown in table (2) .These results agreed with the results obtained by Tony T.Y.Chiu
et al. [6], who revealed that there was no significant
difference in the serum concentrations of estradiol level at the day of hCG administration between group (A) follicles containing mature and fertilized oocytes, and group (B) follicles containing immature and unfertilized oocytes.
While Zhong et al. [13] found that comparing between
control and PCOS groups, the PCOS patients showed increase in the serum and follicular E2 and the number of collected oocyte.
In this study, it was found that there was no significant difference in the number of gonadotropin hormone among PCOS (IR), PCOS (NIR) and control groups, but it was noticed that less number of ampules was used in PCOS (NIR) group, and the largest was in PCOS (IR), compared with the other two groups as shown in table (3). This result was in agreement with the results obtained by
Pe´ter Fedorcsa´k et al. [14], who found that insulin
resistance alters ovarian response to stimulation. Indeed, Insulin-resistant women required higher FSH doses for ovarian stimulation than women with normal insulin sensitivity, although, these variations were not remarkable after accounting for BMI, meaning that they were majorly because of obesity, and hyperinsulinaemia did not have a big effect on FSH dose.
While Dale et al. [15], demonstrated that
hyperinsulinaemia which does not depend on body weight was related to the enhanced FSH requirement, higher estradiol level, risk of multifollicular development and high cancellation rate.
In the current study, with regard to the mean duration of stimulation established among the PCOS (IR), PCOS (NIR) and control groups, the statistical analysis displayed that there was a significant difference among the three groups, as seen in table (3). This result was in
agreement with the results obtained by Yi-ping Zhong et
al. [13], who reported that there was the shortest period of
ovarian stimulation and lowest dose of gonadotropin in the PCOS patients, followed by the ovulatory PCO and normal ovaries patients. Some studies done formerly have claimed that in comparison with the other infertility patients, PCOS patients showed a higher degree of ovarian vascularization during the process of ovarian stimulation, which paralleled with vascular endothelial growth factor [VEGF] levels in the serum and follicular fluid. There was a positive correlation between ovary vascularization and VEGF levels and the E2 levels and
numbers of oocytes obtained[16].
While Per O. Dale et al. [15] revealed that the insulin
resistant women required more gonadotrophin and a longer time to achieve follicular maturation. And
Homburg et al.[17], confirmed that obese PCOS women
required more time and gonadotrophin to achieve follicular maturation than lean PCOS women. On the
other hand, Esmailzadeh et al. [18], found no difference
in the total FSH dose used or days of controlled ovarian hyperstimulation (COH) between the PCOS group and normal ovaries group, but there was a significantly higher number of eggs collected in the PCOS group.
Ovarian response to ART includes outcomes such as the number of retrieved oocytes, number of mature oocytes (MII), fertilized MII, and formation of embryos, in this study, there was a significant difference found among the three groups regarding the total oocytes number, number of oocytes (MII), fertilized MII and number of embryos, they were the highest in the PCOS (NIR) group than the other two groups (See table (3) and table (4) and figure
(1)). This result was in agreement with Qiao, J. et al. [19],
who said that in PCOS patients, various factors including endocrine and local paracrine/autocrine actions, directly and indirectly interfered with oocyte maturation. The
influence of extra ovarian factors (i.e., LH hypersecretion,
hyperandrogenemia, and hyperinsulinemia) and
intraovarian factors (i.e., epidermal, fibroblast,
insulin-like, and neurotrophin growth factors) were possible factors that could interfere with oocyte maturation, while
Pe´ter Fedorcsa´k et al. [14], demonstrated that the
number of collected oocytes, the number of normal fertilized oocytes, implantation and pregnancy rates, the incidence of ovarian hyperstimulation syndrome, and pregnancy outcome were not affected by the existence of insulin resistance.
Conversely with insulin resistance, there was a remarkable impact of obesity on infertility treatment in PCOS women. In fact, it was also reported that obesity led to higher gonadotrophin requirement during stimulation, and fewer collected oocytes. These effects did not have any associations the insulin resistance index, meaning that factors except hyperinsulinaemia affect
ISSN (Online) 2249-6084 (Print) 2250-1029 www.eijppr.com
42
In contrast, Esmailzadeh et al. [18], found no difference
in the total FSH dose used or days of controlled ovarian hyperstimulation between the PCOS group and normal ovaries group, but there was a remarkably higher number of eggs collected in the PCO group, there was no difference in the fertilization rate, clinical pregnancy rate or OHSS rate between the two groups.
CONCLUSION
Insulin resistance can be assumed as an indicator of poor oocyte maturation and poor oocyte quality and a long duration of stimulation.
REFERENCES
1. Practice Committee of the American Society for
Reproductive Medicine. Definitions of infertility and recurrent pregnancy loss: a committee opinion.
Fertil Steril 2013; 99(1):63.
2. Hart R, Hickey M and Franks S. Definitions,
prevalence and symptoms of polycystic ovaries and
polycystic ovary syndrome. Best Pract Res Clin
Obstet Gynaecol 2004; 18(5): 671-83.
3. Balen AH. Polycystic Ovary Syndrome and
Secondary Amenorrhea. In: Edmonds DK, editor.
Dewhurstʼs Textbook of Obstetrics &
Gynaecology.8th ed. London: Wiley-
Blackwell.2012.pp 513-33.
4. Norman RJ, Dewailly D, Legro RS et al. Polycystic
ovary syndrome. Lancet 2007; 370(9588): 685-697.
5. Begum GS, Shariff A, Ayman G, Mohammad B,
Housam R, Khaled N. Assessment of Risk Factors for development of Polycystic Ovarian Syndrome.
International Journal of Contemporary Medical Research 2017; 4(1): 164-167.
6. Tony T.Y.Chiu, Michael S.Rogers, Eric L.K.Law,
Christine M.Briton-Jone1, L.P.Cheung and Christopher J.Haines. Follicular fluid and serum concentrations of myo-inositol in patients undergoing IVF: relationship with oocyte quality.
Human Reproduction 2002; 17(6). 1591–1596.
7. Trew G, Lavery S. Assisted Reproduction. In:
Edmonds DK, editor. Dewhurst's Textbook of
Obstetrics&Gynaecology.8th ed. London: Wiley-
Blackwell. 2012 .pp.567-79.
8. Neri QV, Monahan D, Rosenwaks Z, et al.
Intracytoplasmic sperm injection: technical aspects. In: Gradner DK, Weissman A, HowlesCM,References 92,Shoham Z, editors.
Textbook of Assisted Reproductive
Technologies,Volume One: Laboratory Perspectives,
4th ed. London: Informa Health care. 2012. pp.172-185.
9. Scott L, Finn A, O’Leary T, McLellan S, Hill J.
Morphologic parameters of early cleavage-stage embryos that correlate with fetal development and delivery: prospective and applied data for increased pregnancy rates. Hum Reprod 2007; 22:230–240.
10. Matthews DR, Hosker JP, Rudenski AS, Naylor BA,
Treacher DF, Turner RC. Homeostasis model assessment: insulin resistance and beta-cell function from fasting plasma glucose and insulin concentrations in man. Diabetologia 1985; 28 (7): 412–9.
11. Ray S, Bairagi AK, Guha S, Ganguly S, Ray D,
Basu AK, Sinha A. A simple way to identify insulin resistance in non-diabetic acute coronary syndrome patients with impaired fasting glucose. Indian J Endocrinol Metab 2012; 16(2): 460-4.
12. Segawa T, TeramotoSh, Omi K. et al. Changes in
estrone and estradiol levels during follicle development: a retrospective large-scale study.
Reprod Biol Endocrin 2015; 13:54.
13. Zhong Y-P, Ying Y, Wu H-T, et al. Comparison of
Endocrine Profile and In VitroFertilization Outcome in Patients with PCOS, Ovulatory PCO, or Normal
Ovaries. International Journal of Endocrinology
2012; 2012:492803.
14. Pe´terFedorcsa´k, Per Olav Dale, RitsaStoreng, Tom
Tanbo and Thomas Åbyholm. The impact of obesity and insulin resistance on the outcome of IVF or ICSI in women with polycystic ovarian syndrome,
Human Reproduction2001; 16 (6):1086–1091.
15. Dale P.O., Tanbo T., Haug E. et al. The impact of
insulin resistance on the outcome of ovulation induction with low-dose follicle stimulating hormone in women with polycystic ovary syndrome.
Hum. Reprod 1998; 13: 567–570.
16. M. S. Coffler,K. Patel, M. H. Dahan et al. Evidence
for abnormal granulosa cell responsiveness to follicle-stimulating hormone in women with
polycystic ovary syndrome. Journal of Clinical
Endocrinology and metabolism 2003;
88(4):1742-1747.
17. Homburg, R., Orvieto, R., Bar-Hava, I. et al. Serum
levels of insulinlike growth factor-1, IGF binding protein-1 and insulin and the response to human menopausal gonadotrophins in women with
polycystic ovary syndrome. Hum. Reprod 1996; 11:
716–719.
18. S. Esmailzadeh, M. Faramarzi, G. Jorsarai
.Comparison of in vitro fertilization outcome in women with and without sonographic evidence of
polycystic ovarian morphology
.EurJGynaecolReprod Med 2005;121 (1): 67-70.
19. Qiao J. and Feng, H.L. Extra- and Intra-Ovarian
ISSN (Online) 2249-6084 (Print) 2250-1029 www.eijppr.com
43 Oocyte Maturation and Embryo Developmental
Competence. Human Reproduction Update 2011;
17: 17-33.
20. Fridstrom, M., Sjoblom, P., Pousette, A. et al. Serum
FSH levels in women with polycystic ovary syndrome during ovulation induction using
down-regulation and urofollitropin. Eur. J. Endocrinol