IJIRT 148588
INTERNATIONAL JOURNAL OF INNOVATIVE RESEARCH IN TECHNOLOGY167
Stock Market Prediction Using Machine Learning In
Python
Dinesh A. Kulkarni
1, Nikhil Patil
2, Sanket Kulkarni
3, Piyush Nankar
4, Mahesh Kulkarni
5, Dinesh
Kulkarni
61,2,3,4,5,6
Department of Computer Engineering, Vishwakarma Institute of Technology, Pune-37
Abstract- Expectations on securities exchange costs are an extraordinary test because of the way that it is a tremendously mind-boggling, tumultuous and dynamic condition. There are many studies from various areas aiming to take on that challenge and Machine Learning approaches have been the focus of many of them. There are many examples of Machine Learning algorithms been able to reach satisfactory results when doing that type of prediction. This article considers the use of LSTM arranges on that situation, to foresee future patterns of stock costs dependent on the value history, nearby with specialized examination pointers. For that goal, a prediction model was built, and a series of experiments were executed and their results analyzed against a number of metrics to assess in the event that this kind of calculation presents and enhancements when contrasted with other Machine Learning techniques and venture methodologies. The results that were obtained are promising, getting up to an average of 55.9% of accuracy when predicting if the price of a particular stock is going to go up or not in the near future.
Index terms- LSTM, Linear Regression, Supervised
Learning, Unsupervised Learning, Stock
I. INTRODUCTION
Stock prices are a widely studied topic in many fields including trading, finance, statistics and computer science. The motivation for which is naturally to predict the direction of future prices such that stocks can be bought and sold at profitable positions. Stock Market is a local public market for the trading of the company’s stocks and sub-companies at an agreed price. It is generally a dynamic market where the prices vary, and it becomes difficult for an investor for predicting the prices considering external factors like factors like political situations, the public image on the company according to the efficient market hypothesis. Stock Market became one of the integral
parts of the global economy to the extent that any fluctuation in the market influences personal and corporate financial lives and economic health. For the past decades, predicting stock prices has been a trendy topic in financial applications. If the accuracy of prediction is more, decisions can be taken easily for the future. The risk of falling of stock prices is very rare due to market fluctuations, but there is a risk again. Successful prediction of stock prices can yield significant profits.
In this project we use linear regression, which is statistical learning technique where we predict the value depending on the criterion variable. The main motivation behind this work is that it is very crucial for stock market investors to estimate the behavior or trend of stock market prices in order to invest in a company/category which is ongoing to trend in profits in coming future. The difficult to predict volatile market index makes it a highly difficult task to correctly forecast its path of movement. In this context we are comparing two predictive techniques to know the technique with best efficiency in terms of predicted values vs. the actual market values.
IJIRT 148588
INTERNATIONAL JOURNAL OF INNOVATIVE RESEARCH IN TECHNOLOGY168
a superior choice. In this situation, the choice iswhether the stock will increment or abatement (Stock Analysis)
II. MACHINE LEARNING ALGORITHMS
A. Unsupervised learning
When the dataset is not well defined or very hard for interpretation, it is called unsupervised learning. The labels for the data are not defined. There is no correct method to partition informational collection with the exception of performing emphasizes. Along these lines, in directed learning, the info is utilized to create a structure by taking a gander at the connection of the information itself. For example, Classification of animals. [4] According to this research, unsupervised learning is not advisable for prediction.
B. Supervised learning
Supervised learning can be said as capacity estimation, preparing precedents lead to work age. In the event that the learning is finished with right preparing set, a respectful capacity can be normal. Supervised learning grows consistently with the data. It is a type of induction learning, and it causes biased supervised learning sometimes. E.g.: The function generated with supervised learning will be 𝑋 2, if X is the input value and the output is self-multiplied. Since, there is well defined data available from BSE itself and which is in well-defined numeric form it would be beneficial to use supervised learning algorithms. Supervised learning algorithms are of two variants:
1. Regression. 2. Classification
III. DATA PREPROCESSING
Data Collection: For data collection we used Kaggle dataset. It contain stock prices for various companies. Most of the companies chosen were in the sector of technology. Ex. Apple, Google, Yahoo, Microsoft etc. We collected data from January 2000 to December 2016. This time around, organizations went in misfortune and stock information of organizations totally eccentric. Preparing our model utilizing this information would make our model be less precise in light of an absence of pattern amid the emergency time frame:
• Apple INC.
Pre-Processing: Data pre-processing is a collective name for all methods that aim to ensure the quality of the data. In this stage we basically perform pre-processing on the data by selecting the best features which are extracted from the data collected. The data collected is then modified for just selecting only the required type of the data and removing the unwanted data. The various pre-processing stages include Feature generation which is used for selecting only the required type of the data. The data is then trained, and a model is built based on this for later prediction process. The data model built is then scaled and only the required data is selected. This is the preprocessing technique. Prediction Process: In this process, Linear Regression algorithm is applied on trained data where we predict the prices of Open, Close, High, Low values. This is the stage where the actual algorithm/technique is applied, and the prediction process takes place. Linear Regression Mathematical Calculation: Linear regression model tries to produce the best possible straight line for the dataset. For determining the best fit we attempt to minimize the distance between all points and their distance to our line. In this regression technique we predict the value of one variable of Y from the other values of X, where Y is the Criterion Variable and X is called the Predictor Variable that we are basing our Prediction.
IV. ALGORITHM
A. Linear Regression
The most commonly known modelling technique is linear regression. In this technique, the first (dependent variable) is continuous, the second variables (independent variable) can be continuous or discrete and this leads to a linear line which is the nature of this regression. Linear Regression algorithm is applied on trained data where we predict the prices of Open, Close, High, Low values.
This is the stage where the actual algorithm/technique is applied, and the prediction process takes place. It establishes a relationship between the first variable (dependent variable (Y)) and one second variables (independent variables (X)) and making a straight line which is best fit after computation (which is the regression line).
IJIRT 148588
INTERNATIONAL JOURNAL OF INNOVATIVE RESEARCH IN TECHNOLOGY169
“e” is the error term. From the given equation it isalso used to analyze and predict the value of target variable in the program, on given predictor variable or variables.
The major difference between the simple linear regression and multiple regression is that, multiple regression supports more than one independent variables, but simple linear regression has only one independent variable which it can handle. In order to gain best fit line, below methods are to be done. This can be accomplished by the least square method. It is the most easy and common way for making a regression line. It computes the best-fitting line for the taken data by reducing to the minimum the addition of the squares of the vertical deviations, from each point to the produced line. Since, the deviations are first squared, when summed; positive and negative values do not cancel out. The following equation is used for calculating the line plotting: min 𝑤𝑋𝑤 − 𝑦 2
Points to consider before considering linear regression:
A linear relationship between the given independent and the taken dependent variables is essential.
It can suffer from multicollinearity, heteroscedasticity, etc.
Outliers can impact linear regression in a gigantic manner, which can even prompt wrong expectations.
Step savvy approach likewise utilizes the choice of most critical autonomous factors
Linear regression model tries to produce the best possible straight line for the dataset.
For determining the best fit we attempt to minimize the distance between all points and their distance to our line.
Figure 1: A Model of Regression
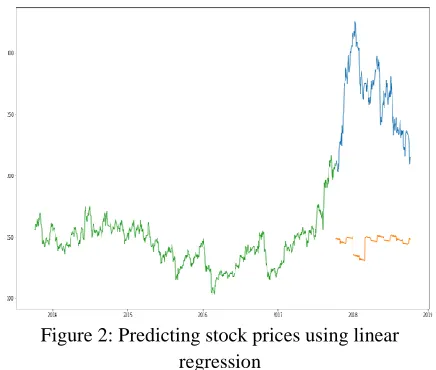
Figure 2: Predicting stock prices using linear regression
B. LSTM (Long Short Term Memory)
LSTMs are widely used for sequence prediction problems and have proven to be extremely effective. The reason they work so well is because LSTM is able to store past information that is important, and forget the information that is not. LSTM has three gates:
The input gate: The input gate adds information to the cell state
The forget gate: It removes the information that is no longer required by the model
The output gate: Output Gate at LSTM selects the information to be shown as output
The LSTM model can be tuned for various parameters such as changing the number of LSTM layers, adding dropout value or increasing the number of epochs.
IJIRT 148588
INTERNATIONAL JOURNAL OF INNOVATIVE RESEARCH IN TECHNOLOGY170
other words, neurons can pass data to a previous orthe same layer. In which case, the information doesn't flow on a solitary way, and the viable impacts for that is the presence of transient memory, notwithstanding long term memory that neural networks as of now have in the outcome of preparing. LSTM were introduced by and it aimed for a better performance by tackling the vanishing gradient issue that recurrent networks would suffer when dealing with long data sequences. It does so by keeping the error flow constant through special units called ”gates” which allows for weights adjustments as well as truncation of the gradient when its information is not necessary.
V. METHODOLOGY
We first implemented the data which was not raw for training of the algorithm which we had used. The linear regression model was given a refined data set and from which we got certain results. Then we trained the refined dataset on the LSTM model which came out with prosperous results.
As per the industry norms we went in for some raw dataset then after, We again trained it on both the models. The results were quite convincing. Below graphs shows certain trends for the datasets.
Figure 4 : Stock Price vs Days
Figure 5 : Normalized Price vs Days
VI. CONCLUSION
This paper summarizes important techniques in machine learning which are relevant to stock prediction. The paper recommends use of linear regression and classification template for stock prediction and stock analysis. An imperative to this end is the need of the dataset used in expectation to be classification neighborly. The paper summarizes the tools which can be used for the implementation of machine learning algorithms. Every one of the tools supports regression and classification algorithms, clients can pick any apparatus dependent on their nature and accommodation. The paper proposes a system to extract knowledge from data and performing a prediction to advise the consumer for investments. Input data plays an important role in prediction along with machine learning. The future work can be expanded further by improvising feature list and with different classifier.
REFERENCES
[1] Olivier C., Blaise Pascal University: “Neural network modeling for stock movement prediction, state of art”. 2007
[2] Leng, X. and Miller, H.-G. : “Input dimension reduction for load forecasting based on support vector machines”, IEEE International Conference on Electric Utility Deregulation, Restructuring and Power Technologies (DRPT2004), 2004.
[3] Vapnik, V., “The nature of statistical learning”, second edition, ©Springer, 1999.
IJIRT 148588
INTERNATIONAL JOURNAL OF INNOVATIVE RESEARCH IN TECHNOLOGY171
[5] Suykens, J. A. K., Gestel, V. T., Brabanter, J. D.,Moor, B.D and Vandewalle, J. “Least squares support vector machines”, World Scientific, 2002.
[6] ANDRÉS M., GENARO DAZA, S., CARLOS D., GERMÁN C.: “Parameter Selection In Least Squares-Support Vector Machines Regression Oriented, Using Generalized Cross Validation”, Dyna, year 79, Nro. 171, pp. 23-30. Medellin, February, 2012.