Gan Siew Lee
1, Maman A. Djauhari
21,2Department of Mathematical Sciences, Faculty of Science, University Teknologi Malaysia, 81310 UTM Skudai, Johor,
Malaysia 1
[email protected] m, [email protected]
Abstract-- In social network analysis, there have various traditional centrality measures that commonly used to determine the relative significance of a node in the network. They determined the centrality of nodes with different definitions. In this paper we propose an overall centrality measure which is an optimal linear combination of the traditional measures where the optimality criterion is similar to that in principal component analysis. This measure can be used to summarize the characterization of traditional measures determined on a node in the network. A study on the NYS E 100 stocks will illustrate its advantages.
Index Term– centrality measure; econophysics; minimum spanning tree; stock market
I. INTRODUCTION
The activities of stock market can reflect the economical situation of a country. It has been received very much attention not merely from the government, industries, investors, economists but also the researchers in diverse disciplines including mathematics and theoretical physics. They are interested in investigating the behaviour of the stocks. The behaviour of a stock is usually determined by its stock price fluctuations.
The existence of the interactions between stocks to each other is a well known fact. The behaviour of a stock might be influenced by the behaviour of the other stocks traded in the stock market. Mathematically, the interrelationships among stocks are customarily represented by the correlations among the logarithm of stock returns. The correlation structure, together with the corresponding stocks, constitutes a complex system in the form of a network or, equivalently, an undirected weighted complete graph with finite number of nodes.
Since it was first introduced by Mantegna in 1999 [1], the use of minimal spanning tree (MST) has became a principal tool to filter the important information contained in the complex system. MST has been widely applied in financial industries [2-7], in volatility [5], portfolio analysis [7, 8], risk assessment [8], politics [9], complex system [10], organizational management [11]and manufacturing industry [12]. In stock networks analysis, the MST is used to obtain the filtered topological structure of stocks [1]. To determine the relative significance of each stock in the network, there are four traditional centrality measures: degree, betweenness, closeness and eigenvector centralities [13-16] are widely used. They have different characteristic in determining the centrality of each stock. To best our knowledge, there have no a centrality measure can give an overall summarization for each stock.
The objective of this paper is to introduce an overall centrality measure. This measure is defined as an optimal
linear combination of degree, betweenness, closeness and eigenvector centralities. The optimality criterion is similar to that used in principal component analysis (PCA). To illustrate the advantages of this measure, we analyze the network of 100 most important stocks traded at New York Stock Exchange (NYSE) that have been listed in
http://www.nyse.com/about/listed/nyid_components.shtml. The NYSE 100 stocks selected for the study is with the time range from November 18, 2010 to March 28, 2012.
The rest of the paper is organized as follows. In the next section we discuss the methodology of stocks network analysis, centrality measures and the construction of overall centrality measure. Later on, in Section III we present and discuss the empirical results. In the section IV, we will summarize this study and highlight some conclu sions for further consideration. Finally, in the last section some suggestions will close the presentation.
II. METHODOLOGY
With referred to the work of Mantegna [1], the following steps are the standard procedures to construct the stocks network.
(i) Calculate the logarithm of price return of stock i at time t in a given period; i = 1, 2, …, N, i.e.,
( ) ln ( ) ln ( 1)
i t p ti p ti
r
(1) wherep ti( )be the stock closure price.(ii) Construct the correlation matrix C of size N×N where the correlation coefficient between stocks i and j is,
2 2
2 2
i j i j
ij
i i j j
c
r r r r
r r r r
, (2)
where ri is the statistical average of ri( )t for all t. (iii) Construct distance matrix D from C by transforming
the correlation coefficient cij into distance dij as
follows,
2(1 )
ij ij
d c . (3)
(iv) Construct MST from D by using Kruskal’s algorithm [17].
(v) Apply centrality measures to determine the relative significance of each stock contained in MST. It is worth to mention that the distance is the Euclidean distance since it satisfies the following three axioms of metric; (i) dij
0 and dij 0 i j, (ii) dij dji, and (iii)dij dik dkj.Centrality measures are used to determine the relative significance of each particular stock in the network. There are four measures, namely, degree, betweenness, closeness, and eigenvector centralities [13-16] that usually used in stock networks analysis. First, the degree centrality of stock i is defined as
11
N
ij j D
A
C i
N
, (4)
where Aij is the adjacent link between stocks i and j and N is
the total number of stocks. Second, the betweenness centrality of stock i is
,
( )
jk B
j k V jk
j k i
i
C i
, (5)where,
(i) jk( )i denotes the total number of pairs (j, k) with j ≠ k ≠ i and between stocks j and k there exists a path passing through stock i, and
(ii) jk is the total number of paths between stocks j and
k.
The closeness centrality of stock i is
,1
G C
d i k
C i
N
, (6)where dG(i, k) is the shortest path (geodesic distance) from
stock i to stock k. The summation on the numerator is for all other stocks reachable from stock i. Therefore, CC(i) is the
average number of shortest paths between i and all other stocks reachable from it. The last measure is the eigenvector centrality of stock i [16],
1
1 N
i ij j
max j
e A x
, for i = 1, 2, …, N, (7)where (x1, x2 …xN)t is the eigenvector associated with the
largest eigenvalue max of the adjacency matrix. It is the
weighted average of the scores xi of all stocks connected to
stock i. For more details in degree, betweenness, closeness and eigenvector centralities, readers may refer to [13-16, 18-23].
Based on traditional measures, the centrality scores of each stock are between 0 and 1 while they have different definition. Therefore, it is necessary to define an overall centrality measure if one needs to indicate the overall role of each stock. In this paper, it will be defined by using PCA on the data matrix of size N × 4 where the first until the fourth columns of row i represent the score of degree, betweenness, closeness and eigenvector centralities of stock i, respectively. Let S be the covariance matrix issued from the said data matrix of size N × 4 and v = (v1, v2, v3, v4) t be the
eigenvector of S associated with the largest eigenvalue θmax.
Thus, Sv = θmax v. The score of stock i in terms of overall
centrality measure is defined by
Oi = v1 CD(i) + v2 CB(i) + v3 CC(i) + v4 ei. (8)
III. RESULTS AND DISCUSSION A. Minimum spanning tree
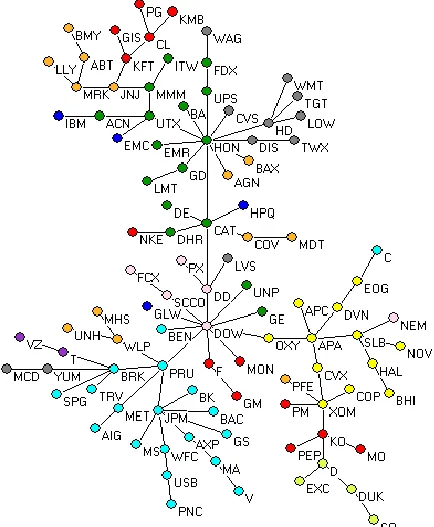
By using Matlab 7.8.0 (R2009a) with the coding of Kruskal’s algorithm downloaded from Matlab central, we obtain an MST of NYSE100 stocks. The corresponding MST is shown in Fig. 1. In that fig., the stocks are represented by the nodes and they are colored according to their business sectors such as: basic materials (pink), consumer goods (red), consumer services (grey), finance (cyan), health care (orange), industrials (green), oil and gas (yellow), technology (blue), telecommunication (purple), and utilities (light green). There are nine classifications of sectors. The edge connected two nodes is represented the correlation (or similarity) between two stocks. In that fig., each node is labeled by the tick symbol of stock. MST is a graph to illustrate the relationships among stocks that are highly correlated (i.e., have the shortest distance).
From that fig., we note that there is no single dominant stock. There have at least two clusters which are clearly dominated by HON (Honeywell International Inc.) in the top cluster and DOW (Dow Chemical Co.) in the bottom one. They have higher number of connections to other stocks. From Fig.1, we notice that most stocks in a given sector are connected to each other except stocks from technology sector. Those connections might be caused by sharing the same economic information within stocks in given sectors .
To interpret the structural position of the stocks in Fig.1, we report the traditional centrality scores of each stock in the following sub-sections. In order to get an overall centrality score of each stock, in this paper we combine those measures by using PCA.
Fig. 1. MST of NYSE100 Stocks
B. Centrality measures
the overall centrality measure on each stock. Those measures are computed based on the findings of MST as shown in Fig. 1.
TABLE I Centrality Scores
i Stock CD(i) CB(i) CC(i) ei Oi
1 DD 0.0404 0.5102 0.2380 0.1840 0.5686 2 FCX 0.0101 0.0000 0.1661 0.0202 0.0335 3 DOW 0.1010 0.7044 0.2463 0.2391 0.7715 4 PX 0.0101 0.0000 0.1926 0.0513 0.0508 5 NEM 0.0101 0.0000 0.1414 0.0033 0.0226 6 SCCO 0.0202 0.0202 0.1988 0.0723 0.0797 7 PG 0.0101 0.0000 0.1014 0.0008 0.0158 8 PM 0.0101 0.0000 0.1296 0.0012 0.0200 9 KO 0.0404 0.1169 0.1316 0.0016 0.1269 10 PEP 0.0101 0.0000 0.1165 0.0004 0.0178
: : : : : : :
96 VZ 0.0101 0.0000 0.1349 0.0042 0.0221 97 SO 0.0101 0.0000 0.0954 0.0000 0.0147 98 D 0.0303 0.0598 0.1173 0.0005 0.0729 99 DUK 0.0202 0.0202 0.1053 0.0002 0.0350 100 EXC 0.0101 0.0000 0.1051 0.0001 0.0161
From the above table, in term of each centrality measure, eight stocks with higher-scoring are determined and the roles of those stocks are discussed in the following subsections.
(i) Degree centrality
Degree centrality is the simplest centrality measure. It defined the relative significance of a stock in terms of the number of edges incident upon it. The stocks with the higher scores will directly influence the behavior of more other stocks which are directly connected to it. Based on this measure, HON has the highest number of edges with other stocks with score of 0.1111 (11 adjacent edges). It will influence more of stocks in NYSE. After HON, DOW is second stock with higher scoring, i.e. 0.1010. The six other most higher-scoring stocks are JPM (0.0707), CAT (0.0606), BRK (0.0505), PRU (0.0505), XOM (0.0505) and APA (0.0505). The stocks at the periphery of MST with only one degree (or called leaves) have less significance to the network and they are being always influenced by other stocks that have high score than them.
(ii) Betweeness centrality
Betweenness centrality is the sum of fraction of all possible shortest path between any stocks that pass through a stock. It used to quantify the control of a stock on information flow in the network. So, the stock with highest score is considered as significant stock in terms of its role in coordinating the information among stocks. Based on this measure, DOW has the highest score (0.7044). It is then has the best position in NYSE in the following sense. More stocks will be influenced by DOW when they received the information that has been passing through DOW. Therefore, DOW plays an important role in NYSE as a liaison that could control information flows among stocks. The other seven highest-scoring stocks are CAT (0.5259), HON (0.5172), DD (0.5102), PRU (0.3960), APA (0.3647), OXY (0.3492), and UTX (0.2676). The leaves of MST have betweenness scores of 0.
(iii) Closeness centrality
Closeness centrality is also involves the shortest path between all possible pairs of stocks on a network. It is defined as the average number of shortest paths between a stock and all other stocks reachable from it. Basically, closeness centrality is a measure of how close a stock to all other stocks. The higher the score of a particular stock the faster the stock spread the information from it to all others. DOW is the highest-scoring stock in terms of closeness centrality. Its score is 0.2463 followed by DD (0.2380), CAT (0.2271), PRU (0.2181), OXY (0.2171), HON (0.2106), SCCO (0.1988), and F (0.1988).
(iv) Eigenvector centrality
Eigenvector centrality is a measure of the strength of a stock with its connections to each major subgroup of the stocks. Hence, the stocks with higher scoring they are connected to the high-scoring stocks. Comparatively, the stocks have equal connections to low-scoring stocks contribute less to the scores of the stocks. In this measure, HON has the highest score 0.5860. Then, it is followed by CAT (0.3178), DOW (0.2391), UTX (0.2198), HD (0.2132), DD (0.1840), UPS (0.1785), and DIS (0.1772).
According to those traditional centrality measures, the following stocks appeared as top eight higher-scoring stocks in all four or three measures. CAT, DOW, HON appeared four times while DD, and PRU three times. Therefore, they are the strongest stocks in NYSE in terms of their appearance as part of the higher-scoring stocks in all measures.
(v) Overall centrality
Each centrality measure determined the different characteristics of stocks in network. W e propose an overall centrality measure that will guide us to determine the most important stocks with overall characteristics in general sense. Here, we define the overall centrality measure as an optimal linear combination of the four measures mentioned previously. For that purpose, we use the optimality criterion based on PCA on data matrix of size 100×4 representing 100 stocks and their scores in the four measures which are presented in the third to sixth column of Table I.
In PCA, the first principal component explains 82.2% of the total variations which can be sufficiently adequate to determine the overall centrality measure [24]. The components of the first principal component of eigenvector
v
are v1 = 0.1050, v2 = 0.8828, v3 = 0.1423, and v4 =TABLE II
T he Most Eight Overall Significant Stocks No. Stock C ompany Name O ve rall Score
1 DOW Dow Chemical Co. 0.7715
2 HON Honeywell International Inc. 0.7532
3 CAT Caterpillar Inc. 0.6413
4 DD E.I. DuPont de Nemours & Co. 0.5686 5 PRU Prudential Financial Inc. 0.4379 6 OXY Occidental Petroleum Corp. 0.3743
7 APA Apache Corp. 0.3690
8 UT X United T echnologies Corp. 0.3623
From that table, we notice that the top three higher-scoring stocks: DOW, HON, and CAT are appeared as higher-scoring stocks in all four traditional measures while the fourth and fifth higher-scoring stocks: DD and PRU are appeared as higher-scoring stocks in three times. DD and PRU are not quite strong in degree and eigenvector centrality, respectively. From those most overall significant stocks, the four overall most significant sectors are determined and shown in Table III.
TABLE III
T he Most Overall Significant Sectors Se ctor Stock C ompany Name Basic Materials DD
DOW
E.I. DuPont de Nemours & Co. Dow Chemical Co. Finance PRU Inc.Honeywell International Inc. Industrials CAT Caterpillar Inc.
HON Prudential Financial UT X United T echnologies Corp.
Oil and Gas APA Apache Corp.
OXY Occidental Petroleum Corp.
IV.
CONCLUSION
In this paper the behaviour of NYSE100 stocks traded are analyzed using network analysis approach. The stocks together with the correlations among the logarithm of stock price returns are considered as a complex system in the form of correlation based network. That network is simplified into a form of an MST and the relative significance of each stock is determined by using the four traditional centrality measures, namely, degree, betweenness, closeness, and eigenvector centralities. Since each measure has different definition in describing the roles of stocks, we proposed an overall centrality measure to get overall information about the most significant or influential stocks in NYSE. It can be regards as an optimal linear combination of the traditional centrality measures . The optimality criterion is similar to that in PCA.
From the eight most overall significant stocks, top five stocks are appeared as the highest-scoring stocks in at least three measures. They are DOW, HON, CAT, DD and PRU. These stocks are the strongest stocks in NYSE in terms of the traditional measures. They are connected to each other through a path which is located in central of MST. They have significant relationship between each other. As summary, these stocks have more connections with the others except DD; are able to control the distribution of information in the network; are able to spread information quickly to the others ; and have connections to the stronger stocks except PRU. Based on the first principal component values, degree centrality has less relative importance to reflect the significance of stocks. This agrees with the findings of Sharif and Djauhari [25].
V.
FUTURE WORK
To best our knowledge, the use of single MST to filter the important information contained in the complex system might be misleading. This is because the MST is not robust if the system contained more than one MST. In Ref. [26], a robust filter, called forest of all MSTs is introduced. In the future work, it is suggested to apply overall centrality measure to summarize all the characteristic of each stock in forest of all MSTs. Since according to that robust filter, the centrality measures are also robust.
ACKNOWLEDGM ENT
The authors are grateful to Government of Malaysia for those sponsorships, and Universiti Teknologi Malaysia for the facilities. Special thanks go to the anonymous referees for their constructive comments and suggestions.
REFERENCES
[1] R. N. Mantegna, “Hierarchical structure in financial markets,” The European Physical Journal B, vol. 11, pp. 193-197, 1999. [2] G. Bonanno, N. Vandewalle and R. N. Mantegna, “T axonomy of stock market indices,” Physical Review E , vol. 62, pp. R7615-R7618, 2000.
[3] G. Bonanno, F. Lillo and R. N. Mantegna, “Levels of complexity in financial markets,” Physica A , vol. 299, pp. 16-27, 2001.
[4] G. Bonanno, G. Caldarelli, F. Lillo and R. N. Mantegna, “T opology of correlation-based minimal spanning trees in real and model markets,” Physical Review E, vol. 68, pp. 046130-046133, 2003.
[5] S. Micciche, G. Bonanno, F. Lillo and R. N. Mantegna, “Degree stability of a minimum spanning tree of price return and volatility,” Physica A, vol. 324, pp. 66-73, 2003.
[6] B. M. T abak, T . R. Serra and D. O. Cajueiro, “ T opological properties of stock market networks: T he case of Brazil,” Physica A, vol. 389, pp. 3240-3249, 2010.
[7] J. –P. Onnela, A. Chakraborti, K. Kaski, J. Kert’esz and A. Kanto, “Dynamics of market correlations: T axonomy and portfolio analysis,” Physical Review E, vol. 68, pp. 056110(1)-056110(12), 2003.
[8] V. T ola, F. Lillo, M. Gallegati and R. N. Mantegna, “ Cluster analysis for portfolio optimization,” Journal of Econom ic Dynam ic and Control, vol. 32, pp. 235-258, 2008. [9] H. Situngkir and Y. Surya, (May 2004). Hierarchical taxonomy
in multi-party system. Cornell University Library. [Online]. Working Paper WPM 2004 Bandung Fe Institute. Available: http://arxiv.org/abs/nlin/0405005.
[10] M. T umminello, T. Aste, T. D. Matteo and R. N. Mantegna, “ A tool for filtering information in complex systems,” Proceedings of the National Academy of Sciences, vol. 102, pp. 10421-10426, 2005.
[11] N. S. Yusoff, M. A. Djauhari, S. Sharif and E. S. Suleiman, “Organizational commitment in Malaysian public university: an evidence via social network analysis,” International Journal of Basic & Applied Sciences, vol. 12, no. 5, pp. 17-21, 2012. [12] S. Sharif, M. A. Djauhari and H. Djauhari, “Correlation network
analysis on worker’s behavior and safety calture: an experience in manufacturing industry,” International Journal of Basic & Applied Sciences, vol. 12, no. 5, pp. 1-6, 2012.
[13] L. C. Freeman, “ A set of measures of centrality based on betweenness,” Sociom etry, vol. 40, pp. 35-41, 1977. [14] L. C. Freeman, “Centrality in networks: I. Conceptual
clarification,” Social Networks, vol. 1, pp. 251-239, 1979. [15] P. Bonacich, “ Power and centrality: A family of measures,”
Am erican Journal of Sociology, vol. 92, pp. 1170-1182, 1987. [16] S. P. Borgatti, “ Centrality and network flow,” Social Networks,
vol. 27, pp. 55-71, 2005.
centrality,” Social Networks, vol. 29, pp. 555-564, 2007. [19] M. E. J. Newman, “A measure of betweenness centrality based
on random walks”, Social Networks, vol. 27, pp. 39-54, 2005. [20] M. G. Everett and S. P. Borgatti, “The centrality of groups and classes”, Journal of Mathematical Sociology, vol. 23, no. 3, pp. 181-201, 1999.
[21] A. Landher, B. Friedl, and J. Heidemann, “A critical review of centrality measures in social networks”, Business & Information System Engineering, vol. 2, no. 6, pp. 371-385, 2010. [22] S. P. Borgatti and M. G. Everett, “A graph-theoretic perspective
on centrality”, Social Networks, vol. 28, pp. 466-484, 2006. [23] K. E. Joyce, P. J. Laurienti, J. H. Burdette and S. Hayasaka, “A new measure of centrality for brain networks”, PLoS ONE, 5 (8: e12200), 2010.
[24] I. T . Jolliffe, Principal Com ponent Analysis, 2nd ed. Springer,
New York, 2002.
[25] S. Sharif and M. A. Djauhari (2011) “ A centrality measure in currency exchange rate”, Proceedings of Simposium Kebangsaan Sains Matematik 19. Available: client.rs.com.my/sqs/media/.../SKSM19%20Shamshuritawati.pd f.
[26] M. A. Djauhari, “A robust filter in stock network analysis”, Physica A: Statistical mechanics and its application, vol. 391, no. 20, pp. 5049-5057, 2012.
Gan Siew Lee was born in Johor, Malaysia, in 1987. She is currently a PhD student at Universiti Teknologi Malaysia (UT M), Malaysia. Her bachelor’s degree in Industrial Mathematics and master’s degree in Mathematics were obtained from UT M in 2010 and 2012, respectively. She is major in statistics and research area is econophysics.