Development and Validation of a Framework for
Assessing the Performance and Trust in
e-Government Services
Syed Faizan H. Zaidi
London Metropolitan University Holloway Road, London, UK
Sahithi Siva, Ph.D
London Metropolitan University Holloway Road, London, UK
Farhi Marir
Zayed University Dubai,UAE
ABSTRACT
Technological intensification has expended the involvement of information and communication technology in public sectors which facilitate governments across the globe to offer a range of services to their citizens. Enhanced governmental dependence on information systems constrains the management attention towards improving the information systems’ services and the quality. One necessary element of offering quality online services is to understand citizens’ perceptions towards using such services in contrast with the conventional service methods that they are accustomed to. Therefore, periodical performance assessment of offered government services becomes an essential and critical for e-government. In this paper, the authors attempt to investigate the underlying factors and various dimensions of e-government services, and propose a performance assessment framework that will assess the quality and trust dimensions of the e-services from citizens’ perspective. A systematic study of the existing performance assessment models has been carried out in establishing the basis for conceptualizing a framework called e-government service performance and trust assessment framework (E-GSPTA). The proposed framework is designed and validated by using Indian e-tax service.
General Terms
E-government, performance, assessment.
Keywords
E-government, performance, assessment, e-services, quality, trust.
1. INTRODUCTION
E-government is employed as a means for offering enhanced public services. The success of e-government depends upon its quality and usage. Trust is the basis of relationship between citizens and government. Greater the e-government service quality better the trust in offered services citizens may accomplish. Motivation from this fact encourages the governments worldwide to improve e-services for their respective citizens. Despite of the developments in offered e-services, many avenues in this area are unexplored. Government of some of the developed countries have achieved desired level of satisfaction in offering e-services to their citizens; but some of the countries are still lagging behind in offering the quality of e-services. In order to provide efficient e-services and to retain citizens’ confidence, governments should have better understanding of how its citizens perceive, use and evaluate the quality of the e-services offered to them. Widespread use of information and communication technology in public sector demands the periodical performance assessment in terms of assessment of
2.1 Frameworks for evaluating the
performance of e-government
Previous work indicates various conceptual models or frameworks which were used by the researchers to evaluate the performance of e-government. Literature embraces the various studies by (DeLone & McLean, 1992; Pitt et al., 1995; Myers et al., 1997; DeLone & McLean, 2003; Bakry S. H., 2004; Van D. et al., 2005; Victor et. al., 2007; Wang and Liao, 2008; Esteves and Joseph, 2008; Ibrahim H. et al. 2011). DeLone and McLean [7] systematically combined individual measures from information system success categories to create a comprehensive model which then updated by DeLone & McLean [10] to measure success of any e-commerce information system. It consists of six dimensions which include system quality, information quality, service quality, system use, user satisfaction and net benefits.
Pitt et al. [8] proposed a model of information system success similar to the DeLone & McLean’s model, except service quality was included as one of the dimensions that affects both use and user satisfaction. The model shows the importance of an emerging dimension of ‘information service quality’ in information systems assessment.
Myers et al. [9] proposed an Information Systems Assessment (ISA) framework with the inclusion of an additional dimension ‘Work group impact’ within IS success model. The dimension is considered an important intermediate stage between the individual and the organization. The ISA proposed by Myers et al. (1997) is the most comprehensive IS assessment framework but still fails to adequately relate IS to organizational structure.
Bakry [11] presented a framework called STOPE framework. It has been developed and used for the evaluation of different ICT problems including e-business and e-government planning, and information security management. Framework focuses on the strategy, technology, organization, process and environment. This model was found to be adequate for the development of e-government, but did not address e-service assessment issues.
Westhuizen et al. [12] provided an alternative approach, which was based on DeLone and McLean evaluation model [10]. They included project and product dimensions for assessing e-Government projects. Time, quality of project management process, stakeholder satisfaction and budget were the additional variables included in the D & M success model and assessed the project success. Conducted study doesn’t include e-service quality assessment criteria and trust issues from the citizens’ perspective.
Victor et al. [13] focused on post-completion project evaluation in e-government. The authors consider that conclusions and information extracted from post-completion evaluation can provide useful information for the improvement of forthcoming projects.
Wang and Liao [14] proposed a model for Assessing e-Government systems success, this model is a validation of the DeLone and McLean model of information systems success. Wang and Liao framework is useful and provides a sound evaluation tool. His proposed model is a comprehensive multidimensional model measuring e-government system’s success which is validation of DeLone & McLean [10] and replaced net benefit by perceived net benefit.
Esteves et al. [15] presented a comprehensive e-government performance assessment framework for e-government projects (EAM). The assessment identifies the value of the e-government project post implementation. E-e-government maturity level, stakeholders, and assessment levels are the three dimensions included in his comprehensive assessment. This framework is based on STOPE model proposed by Bakry [11]. As discussed above, the STOPE model identifies strategy, technology, organizations, people, and environment as the core components for the development of e-Government in the digital age. EAM uses the constructs of the STOPE model to provide the basis for assessment of e-Government projects. EAM included two additional assessment dimensions outside of the STOPE framework: operational and services. The assessment dimension of EAM contains six components: strategic, technological, organizational, services operational, and economic.
Ibrahim et al. [16] in his study categorized e-government evaluation frameworks in three parts which are e-government success evaluation models, e-government value evaluation models and e-government service quality evaluation models. Above mentioned evaluation frameworks are evident that most of e-government evaluation studies embraced strategies, technology, organization and effectiveness as key indicators for evaluation. However the key factor e-service quality which citizens experience while interacting with online services become important to assess as main key performance indicator.
2.2 Frameworks for evaluating e-service
quality of e-government
Studies show that the classification of services in e-government is related to the citizens. Government-to-Citizen (G2C) services provide full support to citizens, Business (G2B) services to firms, and Government-to-Government (G2G) services to the same or different administration and Government-to-Employee (G2E) are the major classifications. Researchers define e-services in various ways. E-service is a collection of web services which are delivered through the Internet. In e-service customer’s interaction with service providers is through technology using their web sites [17].
(e-GovQual) for measuring e-government service quality for public administration sites where citizens seek either information or services. E-GovQual considers the indicators e.g. reliability, efficiency, citizen support and trust. That’s why this model is a four dimensional model. This model is good for assessing the web quality and citizen perception but doesn't focus on other e-government service quality items such as service quality, and information quality. Chutimaskul et al. [28] highlighted the importance of information quality, process quality and service quality in sustainable Government system development and mentioned that the e-government quality is composed of these three quality variables. His model doesn’t talk about the remaining criteria like usefulness, citizen’s satisfaction and trust. Papadomichelaki et al. [20] proposed e-GovQual model, where they proposes six factors: ease of use; trust; functionality of the interaction environment; reliability; content and appearance of information; and citizen support (interactivity). Magoutas and Mentzas [22] conceptualize a semantic adaptive framework for monitoring citizen satisfaction from government services that is an e-government service quality model. It is a good model which covers factors like interaction, ease of use and trust kind of factors but these factors alone may not determine the overall performance.
Bhattacharya et al. [23] proposed e-service quality model for Indian government portals which is a good model incorporating the information quality and system quality dimensions for consolidating the e-service quality. As technological aspect is excluded in this study, it does not provide a comprehensive performance assessment of e-government services. Zaidi et al. [24] conceptualized a framework e-GSQA which includes system quality, process quality, and information quality as key dimensions for consolidating the overall e-service quality of e-government system. Zaidi et al. [25] extended e-GSQA to e-GSQTA by adding trust element in his framework. This framework includes key performance assessment indicators for assessing the e-government service. Both the frameworks were conceptualized and their dimensions derived from the existing researches. The present study is an extension of e-GSQTA with few more amendments. E-GSPTA framework is proposed and validated in this study.
3. THEORITICAL DEVELOPMENT OF
THE FRAMEWORK
Present study proposes a comprehensive framework for assessing the performance of e-government services (E-GSPTA), hence the identified constructs were adopted only after careful assessment of each dimensions. E-GSQA and GSQTA were presented in [24][25] for assessing e-government service and trust which embraces few dimensions from DeLone and McLean model [10] and E-S-QUAL scale developed by Parasuraman et al. [21]. Proposed study suggests that system quality, information quality, service quality, usefulness, citizens’ satisfaction, citizens’ trust and perceived e-government service quality are the essential constructs for assessing the performance of e-government services.
System quality is measured by the attributes such functionality, reliability, data quality, flexibility, and integration [10]. System quality represents the quality of the information system processing itself, which includes software and data components, and it is a measure of the extent to
which the system is technically sound [26]. From the literature it is found that the functionality, navigation, and accessibility are the main characteristics of system quality. Several other authors have measured system quality in a direct manner without including these dimensions [14][27]. Some authors kept ease of use separate from the system quality treating it as an independent attribute. DeLone and McLean [7] mentioned that the information quality is the quality of output, which information system produces. In the context of e-government, the information quality refers to the quality of information related to government activities. Information quality basically contains the accuracy, timeliness, relevance, precision, and completeness [10][36]. Narasimhaiah et al. [26] categorized information quality in information content and information format. Information content measures the relevance of the information presented to the user in screens and the accuracy and completeness of the information, whereas the information format measures the way of presentation of information and whether information is provided in an easy-to-understand format. With the above discussion it is found that all five items used by DeLone and McLean [10] to measure information quality including accuracy, timeliness, completeness, relevance, and consistency are relevant for assessing the information quality of e-government service. Service quality is an important measure in public sectors which comprises of three aspects: user-focus, user satisfaction, and outcomes [29]. The service quality refers to the quality of e-government communication that is effectively used by the citizens. DeLone and McLean [10] proposed an updated model of IS success by adding a “service quality” measure as a new dimension of the IS success model. Narasimhaiah et al. [26] used reliability, assurance, responsive ness, and empathy for measuring the service quality. Quality of e-government services can be evaluated by user satisfaction and intention of future use [23]. Hence the service quality of e-government is an important factor to measure the citizen’s satisfaction.
positively associated with usefulness and citizens’ satisfaction in e-government services. Citizens’ satisfaction can be defined as the degree to which, a citizen is satisfied with overall use of the e-service provided by the government. Once citizens are satisfied with e-services it will build the trust in e-government services.
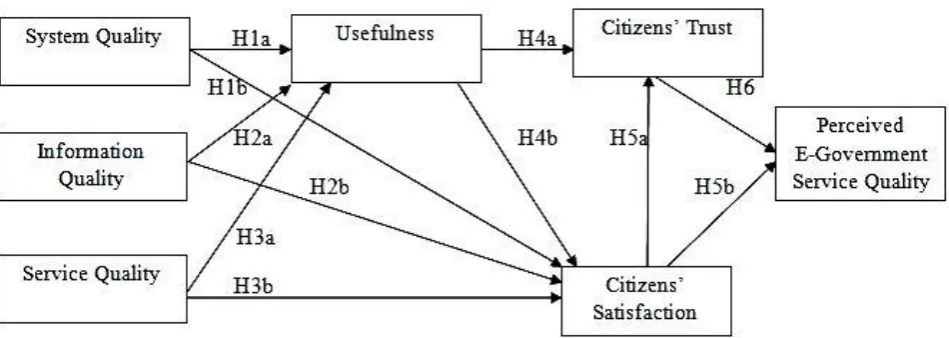
Fig 1: Proposed framework (E-GSPTA) for assessing the performance of e-government service and trust
DeLone and McLean [10] identified the hypothesized relationship between use, user satisfaction, and the three quality variables which together constitute the net benefits. Chutimaskul et al. [28] stated that the e-Government quality is composed of process quality, information quality, and service quality. Wangpipatwong et al. [36] in a study of e-government portals of Thailand, find that improved system quality, service quality and information quality can ensure continued use of e-government applications by citizens. With the above discussion and from the existing literature it is concluded that for assessing performance of e-government services “system quality, information quality and service quality” constructs are needed. Along with these constructs usefulness, citizens’ satisfaction and citizens’ trust are equally important.
Following hypotheses are drawn from above discussion on the literature. Figure 1 shows the relationships among various constructs and hypotheses.
H1a System quality is positively related to usefulness of the e-government service hence it affects e-e-government service. H1b System quality in the e-government has positive effect on citizen’s satisfaction.
H2a Information quality is positively related to usefulness of the e-government service; hence it affects e-government service.
H2b Information quality in the e-government has positive effect on citizen’s satisfaction.
H3a Service quality is positively related to usefulness of offered government service hence it affects perceived e-government service quality.
H3b Service quality has positive effect on citizen’s satisfaction in e-government service.
H4a Usefulness positively affects the trust in e-government service.
H4b Usefulness positively affects citizen’s satisfaction in e-government service.
H5a Citizen’s satisfaction positively affects and forms trust in e-government service.
H5b Citizen’s satisfaction has positive effect on perceived e-government system quality.
H6 Trust has positive effect on perceived e-government service quality.
4. RESEARCH METHODOLOGY
The present empirical research followed quantitative analysis technique emphasizing on achieving reliability and validity of the measures used. The research is divided into three steps which include conceptualization of framework, development and finally validation of proposed framework. Quantitative research usually involves building up hypotheses based on theoretical statements, and variables measured for effects. Hair et al. [37] suggested most widely used methods which are exploratory, descriptive and, causal. Research on e-government service quality is mostly descriptive and discusses most of the aspects inherent in service quality [38]. India e-Tax service is considered for the verification and validation of proposed model. Indian government offers variety of e-services to their citizens but e-Tax service is among one of them which vast majority of citizens including public and private sector’s employees avail also business personals use it frequently.
4.1 Measurement of constructs
through several iterations before finalizing on one. The second step is about design, which included refining the items. Construct validity and reliability analysis was also done in this step.
4.2 Sampling and data collection
There is a high level of variation in the Indian society, including variation in education, culture, age, and relation with technology. Empirical data for instrument validation and hypothesis testing was collected through questionnaires based survey from e-Tax payers. As e-Tax service is a new technology which was introduced few years back to the citizens, it is not expected that the whole population will adopt it and start using it frequently. Filing income tax online in India is a facility provided to the individuals but a mandatory process for employees and firms. Business /corporate houses file their taxes through income tax practitioners or by their in-house experienced professionals. However public and private sector’s employees file their taxes by tax practitioners or by themselves. As they file taxes by themselves, their experience of using online e-Tax services is different from that of the corporate sector. Different rules are applied for filing income tax for different sections, hence random sampling method was found suitable for such situation. The instrument used in this research is the questionnaire. We distributed 300 questionnaires to the individuals which took approximately three months. A total of 260 responses were received. A five-point scale from 1 (strongly disagree) to 5 (strongly agree) was used to collect responses. Sample was satisfactory for the analysis. From the responses received, it was found that 30% respondents were between age 28 and 40; 40% were between 41 and 55 years; and remaining were up to 65 years. Male e-tax payers attributed up to 78%, female e-e-tax payers were found 22% percent.
5. DATA ANALYSIS
Data analysis followed two stages. First, the measurement model was estimated using confirmatory factor analysis to test whether the constructs possessed reasonable validation and reliability [37]. To ensure data validity and reliability, internal consistency, convergent validity, and discriminant validity were conducted. Second was the structural model that best fitted the data was identified, and the hypotheses were tested between constructs in the proposed model [37].
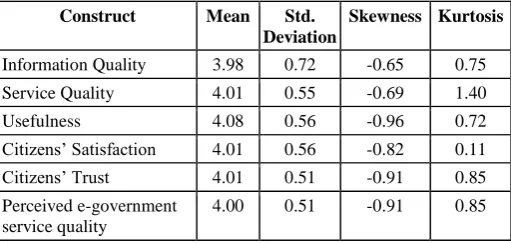
5.1 Descriptive Statistics
Descriptive statistics have been conducted to determine whether the data follows the normal distribution. According to Hair et al. [37] normality is the assumption about the degree to which the distributions of the sample data correspond to a normal distribution.
Table 1. Descriptive statistics of the gathered data
Construct Mean Std.
Deviation
Skewness Kurtosis
Information Quality 3.98 0.72 -0.65 0.75 Service Quality 4.01 0.55 -0.69 1.40 Usefulness 4.08 0.56 -0.96 0.72 Citizens’ Satisfaction 4.01 0.56 -0.82 0.11 Citizens’ Trust 4.01 0.51 -0.91 0.85 Perceived e-government
service quality
4.00 0.51 -0.91 0.85
Normality of the variable's data could be read from the standard deviation. When the standard deviation (S.D. <1) then, it indicates normality. Measuring the value of skewness, and kurtosis also confirm the normality of data. According to Hair et al. [41], the range of acceptable limits for skewness is -1 to -1, and the range of acceptable limits for Kurtosis is --1.5 to 1.5.
5.2 Reliability Test
In order to establish the internal consistency of the measurement instruments, reliability analysis was conducted. It was established by calculating coefficient alpha, also known as Cronbach’s alpha, to measure the internal consistency of the measurement scale. Hair et al. [41] suggests that the acceptable values for Cronbach’s alpha > = 0.6 but if the value is > =0.9 then strenght of association will be excellent.
Table 2. Cronbach’s α value for reliability test
Items for each Constructs Cronbach’s α
System Quality (7) 0.85 Information Quality (7) 0.87 Service Quality (6) 0.85
Usefulness (5) 0.82
Citizens’ satisfaction (5) 0.84 Citizens’ Trust (5) 0.86 Perceived e-Government Service
Quality (3)
0.85
The results of the reliability test are shown in Table 2 in which the Cronbach’s α -values are greater than 0.6 for all items in each constructs in fact values obtained are close to 0.9 which shows near excellent association of items with their constructs.
5.3 Measurement Model
assess the overall goodness of fit model. All of the criteria that determine the overall fit of the model particularly GFI (.979), AGFI (.958), RMSR (.015), RMSEA (.043), NFI (.976), CFI (.992), IFI (.992), TLI (.988), and CMIN/DF (1.432) were found to be within acceptable range, which indicates that model fit was good. The table 3 shows the obtained values of model fit indices which are within the acceptable range given by Hooper et al. [40].
Table 3. Model Fit Indices for Measurement Model Model Fit Measurement
Fit Indices Recommended Range Obtained Value
Absolute Fit Measurement (AFM)
χ2/df <= 3.00 1.432
GFI >0.9 .979
AGFI >0.9 .958
RMSR <0.10 .015 RMSEA <0.08 .043 Incremental Fit Measures (IFM)
NFI >0.9 .976
CFI >0.9 .992
IFI >0.9 .992
TLI >0.9 .988
5.4 Instrument’s Validity Analysis
For the validation of instrument, validity analysis was performed which includes the analysis of convergent validity and discriminant validity.
5.4.1
Convergent Validity
The following criteria are suggested by various researchers for convergent validity.
Table 4. Criteria for convergent validity
Convergent validity criteria
Guideline Source
Item/factor loading >=0.60 Bradley et al. [43] Composite reliability >=0.70 Hair et al. [41] Average Variance Extracted >=0.50 Hair et al. [41] Cronbach Alpha Coefficient >=0.70 Gefen et al. [42] Critical Ratio (t-value)
for outer loading
>=1.96 Gefen et al. [42]
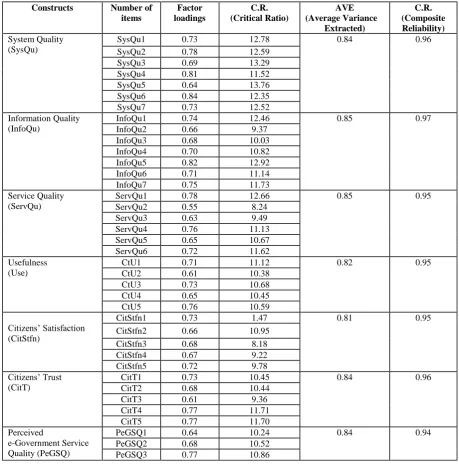
The given table 6 in appendix shows that for factor loading, critical ratio, average variance extracted, and composite reliability which obtained values were found well within the range.
Convergent validity indicates the degree to which two different indicators of a latent variable confirm one another [45]. Hair et al. [37] suggests different ways to determine convergent validity. Critical ratio >1.96 is the first condition to confirm convergent validity in factor loading. Second important condition which confirms convergent validity is all standardized regression coefficients should be more than 0.50 [45]. Table 4 shows that all the factor loadings are higher than specified criteria 0.50, in fact some loadings are more than 0.70. All obtained critical ratios are > 1.96. The range of the critical ratio is 8.00 to 14.00. Obtained critical ratios and standardized regression weights are well within the range and indicate good convergent validity.
Fornell et al. [44] recommended the three criteria for establishing convergent validity. First one is all indicator factor loadings should be significant and exceed 0.707 Second
is construct/composite reliabilities should exceed by 0.60, and third is average variance extracted (AVE) by each construct should exceed by 0.50. Factor loading of all the items were found to be greater than 0.60. Critical ratios’ were found to be greater than 1.96 which is a first condition of convergent validity. In fact, most values are significantly high, over 0.70. Both the factor loadings and critical ratios indicate good convergent validity. Average variance extracted (AVE) can be calculated as {sum of (standardized loadings squared)} / {[sum of (standardized loadings squared)] + (sum of indicator measurement errors). Below table shows the AVE >0.50 and composite reliability > 0.70 satisfied the standard criteria. Based on factor loadings, the critical ratio, and AVE calculation, convergent validity is confirmed.
5.4.2
Dicriminanat Validity
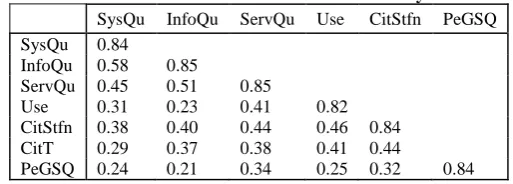
Discriminant validity is the extent to which a construct is truly distinct from other constructs [37]. Fornell et al. [44] suggested that the square of the correlation between two constructs should be less than their corresponding average variance extracted (AVE). Discriminant validity was examined by comparing the squared correlation (also shared variance) between constructs with the average variance extracted of the individual construct [44]. Analysis showed the squared correlation between constructs were lower than the average variance extracted of the individual construct, which confirmed the discriminant validity. Table 5 shows the discriminant validity.
Table 5. Measurement of discriminant validity
SysQu InfoQu ServQu Use CitStfn PeGSQ SysQu 0.84
InfoQu 0.58 0.85
ServQu 0.45 0.51 0.85
Use 0.31 0.23 0.41 0.82 CitStfn 0.38 0.40 0.44 0.46 0.84 CitT 0.29 0.37 0.38 0.41 0.44
PeGSQ 0.24 0.21 0.34 0.25 0.32 0.84
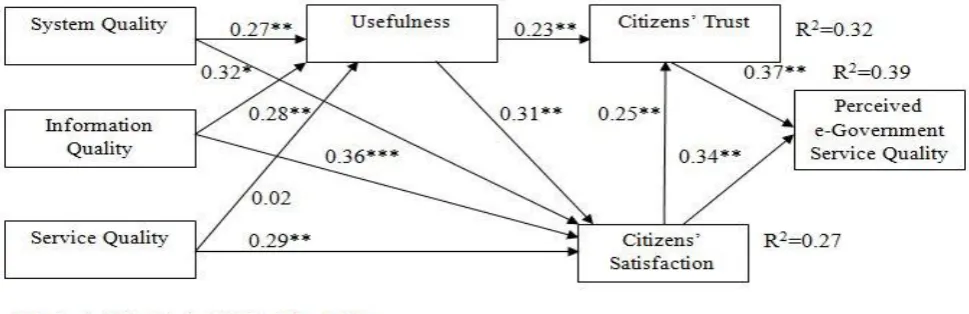
5.5 Structural model for hypotheses
Analysis
(β=0.27, β=0.32 and β=0.28, β=0.36) on the usefulness and citizens’ trust. This shows that the hypotheses H1a, H1b, H2a, H2b, H3a were supported, however service quality had significant effect on citizens’ trust (β =0.29, H3b was supported) but its effect on usefulness shows marginal value. Hence hypothesis H3a was rejected. Usefulness shows significant effect on citizens’ trust and citizens’ satisfaction means hypotheses H4a and H4b were found acceptable. Finally citizens’ trust and citizens’ satisfaction greatly influenced the whole e-government service quality; hence hypotheses H5a, H5b and H6 were supported. Results obtained from the structural equation analysis, we found that
most of the hypothesized relationships are supported. The total effects on e-government service quality are 0.39. 39% of the variance of e-government service quality impact is determined by system quality, information quality, service quality, usefulness (indirect effect), citizens’ trust and citizens’ satisfaction (direct effect) together. In addition, 32% of the variance of citizen’s trust is explained by usefulness and 27% citizens’ satisfaction. Citizens’ trust shows stronger effect on e-government service quality rather than citizens’ satisfaction. However it was evident that the citizens’ trust was built due to the citizens’ satisfaction.
6. DISCUSSION
The purpose of the study is to develop and validate the framework which can assess the e-government service performance in the form of perceived e-service quality. The DeLone and McLean [10] IS success model was adopted as a base model in the proposed framework. In the study focus was given on G2C e-government interaction. Due to the nature and context of the research it was necessary to add some additional construct particularly “Usefulness and Citizens’ Trust” in the base model. The results after analysis show that the system quality, information quality, service quality, usefulness, citizens’ trust, citizens’ satisfaction and perceived e-government service quality are valid and appropriate assessment constructs which reflect overall e-government service performance. The set of hypotheses were tested empirically by collecting the data from the e-tax service users of India. Our research indicates some important implications. According to the proposed framework, perceived net government service quality is considered to reflect e-government performance along with other six constituting performance assessment measures.
System quality, information quality and service quality are most preferred performance measurement constructs of a government which measure the functionality and performance of e-government services. Based on the previous studies, a set of items for each construct were considered to measure system quality, information quality and service quality in this study. Hypotheses testing results reveal that quality assessment constructs including system quality, information quality and service quality show direct effect on usefulness of e-government system which also affect citizens’ satisfaction while citizens interact with the online system. Thus, set of hypotheses H1a, H1b, H2a, H2b, H3a and H3b in depicted in figure 2 are well supported. System quality, information
quality and service quality influence the perceived e-government service quality and significantly play important role in assessing e-government service performance. It is clearly evident from the findings that the total effects of information quality on usefulness, citizens’ satisfaction, and trust are significantly greater than those of system and service quality. In the context of G2C, information quality has more prevailing influence on perceived e-government service quality through usefulness, citizens’ and trust. However system quality and service quality simultaneously show relative impact on perceived net e-government service quality. Citizens’ satisfaction and citizens’ trust show direct relationship with perceived e-government service quality hence hypotheses H5b and H6 are well supported. Usefulness and citizen’s satisfaction also show direct relationship with citizens’ trust which means citizens’ trust is formed due to the usefulness of e-government services and the satisfaction of citizens in using offered online e-government system. In order to improve the performance of e-government services, perceived net e-government service quality should be fairly improved. Improvement in perceived net e-government service quality depends upon offering the high-quality in the constructs like system quality, information quality and service quality to the citizens in G2C environment. Improved system quality, information quality, service quality and usefulness all together influence the citizens’ satisfaction and citizens’ trust. In the proposed framework, usefulness, trust and satisfaction were found to have the strongest direct effect on perceived net e-government service quality, indicating the importance of overall assessment of e-government services. Present study suggests that perceived net e-government service quality can be considered as the construct which gives overall assessment
of the performance of e-government services. This research also confirms that citizens’ satisfaction and citizens’ trust are corresponding yet individual constructs. Citizens’ satisfaction in offered e-services builds the trust among citizens.
To comprehend the level of offered e-government services, study provides reasonable numbers of valid measures which can be administered periodically to a group of citizens. E-GSPTA framework was found an appropriate instrument which can be employed for assessing the e-government service performance. Drastic enhancement in the today’s technological environment requires periodical e-government service performance assessment. Regular assessment is a firm need which will assist the government to improve their existing system and government will be in the position to gain the confidence of citizens in their offered e-government services. Citizens’ participation and motivation in using the e-government services would be enhanced. Government can take essential curative measures to improve existing e-government system and also e-government can maintain the transparency in the system.
7. CONCLUSION
An effective e-government requires a coherent set of policies and strategies to provide robust quality of e-services to their citizens in cost effective and transparent manner. E-government services offered are utilized by the people of different levels residing in the society. Business professionals, public and private sector employees use e-government services (e.g. e-tax services) frequently. Some of them are IT savvy and some of them are reluctant in using online services. Hence the government responsibility is to build the confidence in their citizens so that every citizen can participate in using online services. An empirical study was conducted to identify determinants of performance assessment of e-government services. The critical factors included system quality, information quality, service quality, usefulness, citizens’ satisfaction, citizens’ trust and perceived e-government service quality.
The development and validation of E-GSPTA framework is mainly an exercise for assessing the performance of e-government services. The research reported in this paper suggests the various facets of e-government services and such a framework can become a useful instrument for any government that plans to assess the performance of their offered e-government services and also it will help the government to measure the trust in their offered e-government services.
8. REFERENCES
[1] Carbo, T., & Williams, J. G., (2004), “Models and metrics for evaluating local electronic government systems and services”, in Electronic Journal of E-Government, 2(2), pp. 95−104.
[2] De Jong, M., & Lentz, L. (2006), “Scenario evaluation of municipal Web sites: Development and use of an expert focused evaluation tool”, Government Information Quarterly, 23(2), 191−206.
[3] Shareef, M. A., Kumar, U., Kumar, V., & Dwivedi, Y. K. (2009), “Identifying critical factors for adoption of e-government”, Electronic Government: An International J ournal, Vol. 6 No. 1, pp. 70-96.
[4] Shareef, M. A., Kumar, U. ,& Kumar, V. (2011), “E-government adoption model (GAM): differing service
maturity levels”, Government Information Quarterly, Vol. 28 No. 1, pp. 17-35.
[5] Barclay, C. (2008), “Towards an integrated measurement of IS project performance: The project performance scorecard” Information Systems Frontiers, Vol. 10, Number 3, July 2008, pp. 331-345, Springer.
[6] Kunstelj, M., & Vintar, M. (2004), “Evaluating the progress of e-Government development: A critical analysis”, Information Polity, 9(3–4), 131−148.
[7] DeLone, W. H., & McLean, E. R., (1992), “Information systems success: the quest for the dependent variable”, Information Systems Research, Vol. 3 No. 1, pp. 60-95. [8] Pitt, L. F., Watson, R. T., & Kavan, C. B. (1995),
“Service quality: A measure of information systems effectiveness”, MIS Quarterly, 19(2), 173-187.
[9] Myers, B. L., Kappelman, L. A., & Prybutok, V. R. (1997), “A comprehensive model for assessing the quality and productivity of the information systems function: toward a 163 theory for information systems assessment”, Information Resources Management Journal, 10 (2).
[10]DeLone, W. H., & McLean, E. R. (2003), “The DeLone and McLean model of information system success”, Journal of Management Information System 19, 9–30. [11] Bakry, S. H. (2004), “Development of e-government: A
STOPE view”, International Journal of Network Management, vol.14 No.5 pp. 339-350.
[12]Westhuizen, V. D., & Fitzgerald, E. P. (2005), “Defining and measuring project success”, In the Proceedings of the European Conference on IS Management, Leadership and Governance, 07-08 Jul 2005, Reading, U. K.
[13]Victor, G. J., Panikar, A. & Kanhere, V. K. (2007), “E-government Projects–Importance of Post Completion Audits”, In the foundations of e-Government book, of the 5th International Conference of e-Government, (ICEG). [14]Wang, Y. S., & Liao, Y. W. (2008), “Assessing
e-Government systems success: A validation of the DeLone and McLean model of information systems success”, Government Information Quarterly, vol. 25, pp. 717-733, Elsevier.
[15]Esteves, O. J., & Joseph, R. C. (2008), “A comprehensive framework for the assessment of e- Government projects”, Government Information Quarterly, Vol. 2008, pp. 118- 132, Elsevier.
[16]Ibrahim, H., Abdul, L., & Zahir, I. (2011), “A new COBRAS framework to evaluate e-government services: a citizen centric perspective”, tGov orkshop’11GOV11, March 17-18, 2011, Brunel University, West London, UB83PH.
[17]Halaris, C., Magoutas, B., Papadomichelaki, X., & Mentazas, G. (2007), “Classification and synthesis of quality approaches in e-government srvcies”, Internet Research, vol 17 Iss: 4, ppf 378-401.
[19]Welch, E. W., & Pandey, S. (2005), “Intranet adoption, use and information quality in public organizations: interactive effects of red tape and innovativeness”, Proceedings of HICSS-37 IEEE Conference, Hawaii International Conference on Systems Science, Big Islnad, JI, January 5-8.
[20]Papadomichelaki, X., & Mentzas, G. (2009), “A multiple-item scale for assessing e-government service quality”, in Wimmer, M.A., Codagnone, C. and Ma, X. (Eds), Proceedings of EGOV 2009, Lecture Notes in Computer Science No. 5693, Springer, Berlin, pp. 163, / e-GovQual: A Multiple scale for assessing e-government service quality, Government Information Quality 29 (2012) 98-109.
[21] Parasuraman, A., Zeithmal, V. A., & Malhotra, A. (2005), “E-S-QUAL: a multiple-item scale for assessing electronic service quality”, Journal of Service Research, Vol. 7 No. 10, pp. 1-21.
[22]Magoutas, B., & Mentzas, G. (2010), “SALT: A semantic adaptive framework for monitoring citizen satisfaction from e-government services”, Expert Systems with Applications, 37(6): 4292–4300.
[23]Bhattacharya, D., Gulla, U., & Gupta, M. P. (2012),"E-service quality model for Indian government portals: citizens' perspective", Journal of Enterprise Information Management, Vol. 25 Iss: 3 pp. 246 – 271.
[24]Zaidi, S. F. H. (2012), “Assessing E-Government Service Delivery (Government to Citizen)”: International journal of e-business and e-government, Vol 4 No 1 January 2012.
[25]Zaidi, S. F. H., Marrir, F., & Siva, S. (2013), “Assessing e-Government Service & Trust: Government to Citizen”, ICDS 2013, The Seventh International Conference on Digital Society, France, February 24th – 1st March. [26]Narasimhaiah G., Toni, M., & Betty, W. (2010),
“Organizational impact of system quality, information quality, and service quality”, The Journal of Strategic Information Systems, Volume 19 Issue 3, September, 2010 Pages 207-228.
[27]Roca, C. J., Chiu, C. M., & Martinez, F. J. (2006), “Understanding e-learning continuance intention: An extension of the Technology Acceptance Model”, International Journal of Human-Computer Studies 64 (2006) 683–696.
[28]Chutimaskul, W., Funilkul, S., & Chongsuphajaisiddhi, V. (2008), “The quality framework of e-government development”, ICEGOV’08 proceedings of the 2nd international conference on theory and practice of electronic governance, page 105-109.
[29]Buckley, J. (2003), “E-service quality and the public sector”, Managing Service Quality Volume 13 · Number 6 · 2003 · pp. 453-462.
[30]Seddon, P. B. (1997), “A Respecification and Extension of the DeLone and Mclean Model of IS Information System Research”, Vol.8, No.3.
[31] Rai, A., Lang, S. S., & Welker, R. B. (2002), “Assessing the Validity of IS Success Models: An Empirical Test and
Theoretical Analysis”, Information Systems Research, 13(1), pp 50- 69.
[32] Chang, I. C., Li, Chang, Y., Hung, Fu, W & Ginn, H. H. (2005), “An empirical study on the impact of quality antecedents on tax payers acceptance of internet tax-filing systems”. Government Information Quarterly, vol.22, pp. 389-410.
[33]Welch, E. & Hinnant, C. C. (2002), “Internet Use, Transparency, and Interactivity Effects on Trust in Government”, Proceedings of the 36th Hawaii International Conference on System Sciences (HICSS’03) IEEE.
[34]Welch, E.W., Hinnant, C.C. & Moon, J. M. (2004), “Linking Citizen Satisfaction with E-Government and Trust in Government”, Journal of Public Administration Research and Theory, 15(3).
[35]Gefen, D., Karahanna, E. & Straub, D. W. (2003), “Trust and tam in online shopping: an integrated model”, MIS Quarterly Vol. 27 No. 1, pp. 51-90.
[36]Wangpipatwong, S., & Chutimaskul, W. (2005), “e-Government Web Quality Assessment: A Citizen-Centric Approach”, Proceedings of the 9th IASTED International Conference on Internet and Multimedia Systems and Applications, p. 65-68, USA, 2005.
[37]Hair, J. F., Anderson, R. E., Tatham, R. L., & Black, W. C. (2006), Multivariate Data Analysis, Sixth edition, Prentice-Hall International, Inc.
[38]Barnes, S.J., Vidgen, R. (2006), Data Triangulation and Web Quality Metrics: A Case Study in E-Government. Information & Management 43(6), 767–777.
[39]Byrne, B. M. (2010), Structural equation modeling with AMOS: Basic concepts, applications, and programming, New York, Taylor and Francis Group, LLC.
[40] Hooper, D., Coughlan, J., & Mullen, M. R. (2008), “Structural Equation Modeling: Guidelines for Determining Model Fit.” The Electronic Journal of Business Research Methods Volume 6 Issue 1 (2008), pp. 53 – 60.
[41]Hair, J. F., Babin, B., Money, A. H., & Samouel, P., (2007), Essentials of Business Research Methods, John Wiley & Sons, Inc.
[42]Gefen, D., & Strub, D. (2005), A practical guide for factorial validity using PLS-graph: Tutorial and annotated examples, communications of the association for information systems 16(5), 91-109.
[43]Bradley, R.V., Pridmore, J. L., Byrd, T. A. (2006),” Information systems success in the context of different corporate cultural types: an empirical investigation”, Journal of Management Information Systems 23, 267– 294.
[44]Fornell, C., & Larcker, D. F. (1981), “Evaluating structural equation models with unobservable variables and measurement Error”, Journal of Marketing Research, 48, 39–50
9. APPENDIX:
Table 6. Obtained values of Factor loading, Critical Ratio, Average Variance Extracted and Composite Reliability
Constructs Number of
items
Factor loadings
C.R. (Critical Ratio)
AVE (Average Variance
Extracted)
C.R. (Composite Reliability)
System Quality (SysQu)
SysQu1 0.73 12.78 0.84 0.96
SysQu2 0.78 12.59 SysQu3 0.69 13.29 SysQu4 0.81 11.52 SysQu5 0.64 13.76 SysQu6 0.84 12.35 SysQu7 0.73 12.52 Information Quality
(InfoQu)
InfoQu1 0.74 12.46 0.85 0.97
InfoQu2 0.66 9.37 InfoQu3 0.68 10.03 InfoQu4 0.70 10.82 InfoQu5 0.82 12.92 InfoQu6 0.71 11.14 InfoQu7 0.75 11.73 Service Quality
(ServQu)
ServQu1 0.78 12.66 0.85 0.95
ServQu2 0.55 8.24 ServQu3 0.63 9.49 ServQu4 0.76 11.13 ServQu5 0.65 10.67 ServQu6 0.72 11.62 Usefulness
(Use)
CtU1 0.71 11.12 0.82 0.95
CtU2 0.61 10.38 CtU3 0.73 10.68 CtU4 0.65 10.45 CtU5 0.76 10.59 Citizens’ Satisfaction
(CitStfn)
CitStfn1 0.73 1.47 0.81 0.95
CitStfn2 0.66 10.95 CitStfn3 0.68 8.18 CitStfn4 0.67 9.22 CitStfn5 0.72 9.78 Citizens’ Trust
(CitT)
CitT1 0.73 10.45 0.84 0.96
CitT2 0.68 10.44 CitT3 0.61 9.36 CitT4 0.77 11.71 CitT5 0.77 11.70 Perceived
e-Government Service Quality (PeGSQ)
PeGSQ1 0.64 10.24 0.84 0.94