Book circulation in Saldanha Bay Municipality libraries,
South Africa, during the 2008/2009 economic recession
Lara Skelly
1[email protected]
Received: 7 November 2013
Accepted: 31 December 2013
There is an axiom that public library usage increases during times of economic recessions. This claim relies on anecdotal evidence, but the literature is lacking in statistical support. This paper attempts to add to the statistical literature by looking at library use of the ten libraries in the Saldanha Bay Municipal (Western Cape, South Africa) area during the 2008/2009 economic recession. Using the coincident index (a composite indicator including measures of employment and inflation) as the economic indicator and circulation data as the indicator of library use, a fixed effects dummy variable panel data model was created. Creating panel datasets allows greater statistical confidence in the results. It also allows temporal differences and differences between libraries to emerge. Multiple regressions were run, but the findings do not support the hypothesis that public library usage increases during economic recessions. The axiom was tested for total circulation, adult fiction, juvenile books and adult non-fiction.
Keywords: Public libraries, economic recession, panel data, Saldanha Bay Municipality.
1 Introduction
There is a significant body of literature that claims that library use is affected by the economic cycle. The idea that economic recessions induce an increase in the use of libraries is taken for granted by the library community and has been termed “the Librarians’ Axiom” (James 1985: 255). If the Librarians’ Axiom (henceforth referred to as the Axiom) holds, then during an economic recession, libraries can be faced with an increased demand on resources as well as a decrease in the capacity with which to respond to the increased demand. If librarians have strong evidence that demand increases during recessionary periods, they would have a strong argument against budgetary (and other resource) cuts. Even if such an argument were not successful, librarians could, at the very least, mentally prepare for an increased demand.
This paper reports the results of testing whether the assumption that library usage increases during economic downturns holds true for the ten libraries in the Saldanha Bay Municipality. Testing was done by running a series of statistical regressions using circulation data. By restricting the study to only one area, a reliable panel dataset could be created over a relatively small time period, namely the 2008/2009 recession.
An important concept in this paper is recessions. Recessions are defined as periods of two consecutive quarters of negative GDP growth (Economist 2010). GDP is the abbreviation given to Gross Domestic Product, which is a measure of the economic activity in a country calculated by looking at how much a country has produced in a certain period (Economist 2010). It is measured four times a year in all countries. Therefore, where an economy does not show increased economic activity for two consecutive quarters, the country is said to be in recession. A depression is nothing more than a prolonged recession (Economist 2010). There is, as yet, no consensus among economists on the quantification of “prolonged”. For some, it is three quarters of negative growth; for others, it is longer. The worst depression in history is referred to as the Great Depression, which hit the economies of the world in the late 1920s.
Deep economic recessions have an impact on many aspects of society. Employment is usually negatively affected as spending slows. Some industries are countercyclical – they improve as the economy worsens. The effect that an economic recession might have on libraries is of great interest. If usage goes up, then the question becomes: does funding go up too? In many countries, libraries are funded directly or indirectly by taxes. If personal incomes go down, tax revenue goes down too. If the country decides to counter the recession by increasing government spending, libraries are a potential benefactor, provided it can be shown that libraries are worthy recipients. However, if it is shown that libraries are not used more in an economic recession, then it could provide the necessary motivation for government and other funding agencies to withdraw funds in order to channel them to services that are more essential. Whatever the case, this study gives librarians a platform from which they can plan library services during an economic recession.
2 Literature review
Rather than attempt to review all the literature on libraries in recessionary periods, which is abundant, this review will focus on those studies that examine quantitative circulation data within public libraries, as well as provide some anecdotal evidence of why libraries might be used more during recessionary periods. There are few studies with a quantitative focus when compared with the number of studies that include only anecdotal evidence. This review will show that the
quantitative evidence is mixed: it cannot be conclusively said that all libraries see an increase in use during recessionary periods.
The literature on libraries during recessionary periods is largely anecdotal. The evidence, as summarised by Child and Goulding (2012: 642), is that recessions have two effects on public libraries: budgets decrease while usage increases. Usage could increase due to a number of factors, such as:
Libraries provide free entertainment: “Now they're borrowing books instead of buying them, checking out movies instead of renting them, and using free internet when money problems force them to go truly wireless” (Hicks 2009).
Libraries are a destination: “The library can be a place to escape into fiction or confront the economic downturn by reading up on the news or scanning local job listings. For some, it’s a place to catch a few moments of peace or catch up with friends” (Barry 2009).
Libraries assist in search for employment: “As the bankruptcies mount and layoffs increase… a lot of people [are] using the library’s job searching resources” (Roller 2008).
Libraries provide do-it-yourself resources: “People who are looking to fix something in their homes will come here and get fix-it books instead of paying someone” (McCandless quoted by Godbey 2009).
The quantitative evidence does not support the anecdotal tales. Lyons (2013) shows in detail that the assumption of decreased budgets does not hold for all libraries. He touches on usage too, showing that not all libraries experience an increase.
James (1985 and 1986), who looked at library usage over a period of twenty years from 1960 to 1979, found little evidence to support the Librarians’ Axiom. He examined the library use from twenty cities in the United States of America. The fact that he studied libraries in big cities could have been why he found a lack of evidence to support the Axiom: libraries in bigger cities do not show the same recessionary effects that libraries in smaller cities do (Herdman 1943: 312). Herdman’s evidence is for the Axiom; however, the effect has a much shorter time span in cities that have a population of over 500 000. James had lagged his library variables, which would have obscured the effect even further, if Herdman’s argument is true. However, a study done by the Library Research Center (2002) does not show that the size of the cities has any effect on the correlation between public library use and economic conditions. It shows an increase in usage during the 2001 recession using aggregated data from eighteen libraries. While Herdman and James used statistical tools in their analysis, Library Research Center based its conclusions on a graphical representation. Other studies which have not included a statistical treatment, such as those by Grindlay and Morris (2004), Lance, Hofschire, and Daisey (2011) and Rooney-Browne (2009), have come to the same conclusion that library usage increases during an economic recession. It would seem, then, that the quantitative evidence does not wholly support the anecdotal evidence. There could be a number of reasons for this lack of support: inherent differences in the units of observations such as the size of the cities that the libraries serve; differences in the statistical treatment of the data; or another reason that has not yet been explored. This study offers another piece of quantitative evidence to the body of literature that explores the relationship between libraries and economic conditions.
The literature does not limit itself to public libraries, nor is it limited to only libraries in developed countries. For examples, it is suggested that one consult Aguolu (1996) and Balarabe (1995), both writing about Nigerian university libraries.
3 Method
The method of this study was multiple regression using a panel dataset. Multiple regression includes defining the study space by explaining how libraries have been selected for the inclusion in the study, the variables used and the time period of interest. Data sources are given and, finally, the statistical procedure is explained.
3.1 Variables
Unfortunately, there are no nationally coordinatedand published figures for public library use in South Africa (Fourie 2007: 32). The Western Cape Provincial Library Service did at one stage publish their figures, but the most recent publication was in 2002 (Western Cape Provincial Library Service 2002). Given time and financial limitations, this study focused only on one municipal system of public libraries, that is, the ten libraries in the Saldanha Bay Municipality. The libraries were named after the areas where they are located. They are Vredenburg, Louwville2, Saldanha, Diazville, Langebaan, Harold Krumm, St Helena Bay, Laingville, Hopefield and Paternoster. Table 1 shows the grouping of the libraries of interest according to the town in which each resides as the socio-economic levels of the population they serve. Note that there is only one library in Hopefield and Paternoster respectively.
2
Table 1 Groupings of libraries according to socio-economic levels within their towns
Name of town Name of library in the
more affluent part of town
Name of library in the less affluent part of town
Hopefield Hopefield
Langebaan Langebaan Harold Krumm
Paternoster Paternoster
Saldanha Saldanha Diazville
St Helena Bay St Helena Bay Laingville
Vredenburg Vredenburg Louwville
3.2 Library variables
Many variables could be used to evaluate the effect that an economic recession could have on public library use. Circulation figures are the one measure that most libraries use to evaluate use. Other measures include in-library use of library material, door counts, and “bums-on-seats”. Unfortunately, the variables used are limited to the variables that are collected by the libraries. In the Saldanha Bay Municipality, the statistics were gathered at the request of the Provincial Library Service, and it was not considered possible to ask the staff of the libraries concerned to undertake additional collection of statistics not already covered by normal operations. The circulation figures are used by the Provincial Library Service for collection management, and are thus collected. The library collections mirror the proportion of issues.
Focusing on one municipal area ensures that the figures gathered are comparable. This municipal area includes a large demographic variation between smaller areas within it. For example, Hopefield is considered to be a poor area, Louwville is predominantly coloured, and Paternoster primarily a fishing village.
The following measures were used in this study:
Total circulation of books was used as the primary measure of library use.
Adult non-fiction: The use of these books, which include do-it-yourself books and books on careers and job finding, should increase during a recession, although perhaps not as much as with adult fiction.
Juvenile material: The circulation of both juvenile fiction and non-fiction is expected to rise during economic hard times. As libraries are used for free entertainment, parents bring their children to the library to find books for them to page through, or to read together at home.
Adult fiction: Once again, this is a measure of how library use changes for entertainment purposes during a recession. The use of adult fiction should increase more than adult non-fiction or junior books.
The Axiom states that library use should increase during an economic recession, so circulation figures should be inversely correlated with economic activity.
3.3 Time period
For the sake of convenience, this study was restricted to a three-year period, from January 2007 to December 2009. The recession of 2008/2009 affected South Africa in the fourth quarter of 2008; by June the following year South Africa was in recovery (South African Reserve Bank 2013). The three-year period from 2007 to 2009 included twenty-one months of economic prosperity, nine months of economic recession, and six months of recovery. As with all studies, a longer time period would reveal more detail, but, for this study, only three years were necessary to capture the desired effect.
3.4 Economic variable
Business cycle indicators are separated into three broad groups, namely leading, lagged and coincident. Leading indicators are the most elusive as they refer to a future economic climate. Lagged indicators are the easiest to measure as they refer to ahistorical economic climate. Coincident indicators show the climate of a current time (Mohr 2000: 71).
Although economic recessions are measured by GDP growth, GDP figures are only issued quarterly. GDP is also a lagged indicator as the figure refers to the three months prior and is no indication of current or future situations. Rather than using GDP in this study, the coincident index, which is calculated by the South African Reserve Bank, is used. The coincident index is a monthly figure which shows business activity at that current moment. It includes inflation and unemployment, which is why those two indicators are not included separately in the model. A historical record of this index was found on the South African Reserve Bank website (South African Reserve Bank 2013).
Ideally, an economic indicator specific for the geographical area should be used. However, there is no such variable available.
3.5 Analytical procedure
Four models were created, each using a different measure of circulation as the dependent variable, namely total circulation, circulation of adult non-fiction, circulation of adult fiction, and circulation of juvenile material. When running the four models, the data from the ten libraries can be pooled to create what the economists call panel data. Creating a panel with the data has several advantages. It allows one to have greater confidence in the results than one would have if several statistical tests were run independently rather than together. It also allows temporal differences and differences between sets (in this case, libraries) to emerge (Hsiao 1989: 1). In the four models, it is assumed that both the coefficients and the intercepts vary across libraries. This is a reasonable assumption as the intercepts, which measure library circulation, even when there is nothing influencing it, will vary among the libraries. Bigger libraries will circulate more books, smaller ones fewer.
The coefficients, which measure the degree to which the economy is affecting circulation, were assumed to be varying so as to tease out the possible effects that the economy could be having on libraries. This assumption would also reveal if the circulation of the different libraries is influenced uniformly across the libraries, that is to say, that the coefficients do not change between libraries. As the economy is not the only factor that influences circulation, the error variable in these models will not be random. The error variable will include the effects of anything else which might influence circulation. These three factors – the varying coefficient and intercepts, and the non-random error – determine that the panel data models are what is known as afixed effects or least squares dummy variable model.
Nine dummy variables representing the nine different libraries are introduced. Dummy variables are always one fewer in number than the variables they represent. In this case, there are ten libraries and so nine dummy variables. The tenth library will be reflected in the intercept of the model. The dummy variables capture the varying intercepts of the nine other libraries. The dummy variables are then allowed to interact with the measure of the economy, the coincident index. In order to provide a result that can easily be understood, both the logarithm of the values of the coincident index and the dependent variables are used. This, then, shows how a percentage change in the one is reflected as a percentage change in the other. A percentage change facilitates an easy comparison of figures.
Written mathematically:
Yit = α1 + α2D2i + α3D3i + α4D4i + α5D5i + α6D6i + α7D7i + α8D8i + α9D9i + α10D10i + β2(D2iCit) + β3(D3iCit) + β4(D4iCit) + β5(D5iCit) + β6(D6iCit) + β7(D7iCit) + β8(D8iCit) + β9(D9iCit) + β10(D10iCit) +λ Cit
Where:
Yit is the logarithm of the circulation data of 1) all the books, 2) adult fiction, 3) adult non-fiction, 4) juvenile material α are the intercepts of the ten libraries
Di is the dummy variable relating to the ith library β are the coefficients of interest
λ is the coefficient of the omitted library Ci is the logarithm of the coincident index
i is the ith cross-sectional unit (or in this case the ith library) t is the time period
This model was largely based on the example used by Gujarati (2003: 645).
It is unlikely that economic conditions would have an immediate effect on library usage. More likely is that there is a delayed effect, or a lag period between the two variables. To examine this, circulation data was lagged up to six time periods, the panel regression run each time.
4 Results
The results of the statistical analyses show that the Librarians’ Axiom does not hold true across all the libraries studied. In fact, the libraries where it does hold true are in the minority. When looking across the different sections of circulation, namely adult fiction, adult non-fiction and juvenile books, there is also no evidence of the Axiom being true.
This, in turn, implies that the reasons it is thought libraries are used more during an economic recession might not be valid. The evidence is not sufficient to support the assertion that libraries are used more to provide children’s entertainment or adult entertainment. Nor does it support the assumption that libraries are used more as job-finding resources or for do-it-yourself books. Where there was a relationship between circulation data and the index, the relationship was almost too small to be noticeable.
In multiple regression analysis, there are two measures that one should look at in order to determine whether or not the model created provides a good explanation of the variation observed in the dependent variable. These two measures are the R-squared and the F-statistic. In all regressions that were run, the R-squared was sufficiently high, as one would expect given how the model had been constructed, which means that the model is a good predictor of actual circulation figures.
4.1 Total circulation
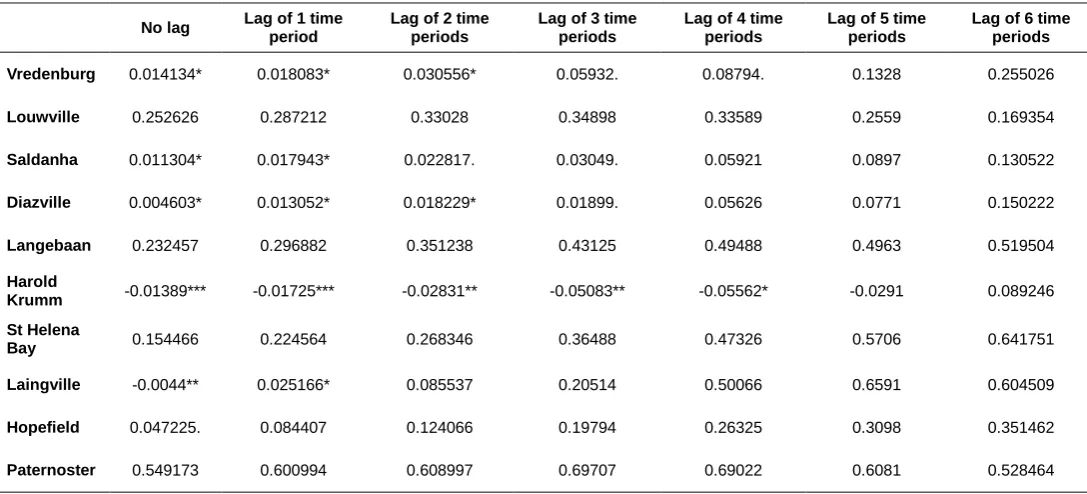
Table 2 shows the summary of the adjusted coefficients of the coincident index, with the exception of Vredenburg which is not adjusted. The adjustment is due to the way the model is constructed. The coefficients that come out of the regression are the difference between the coefficients shown by the omitted library (in this case, Vredenburg). The figures for the other nine libraries are adjusted to take this into account, and so Table 2 shows the actual relationships. Vredenburg was randomly chosen as the omitted library; any other could have been used instead. This adjustment has also been applied to create the figures shown in Tables 3, 4 and 5.
The figures in Table 2 are percentage changes, reflecting that if the economy were to change by one per cent, circulation would reflect an adjustment equal to the figure shown in Table 2. The adjustment would be in the same direction in the case of positive coefficients, and in the opposite direction in the case of negative coefficients. For example, if the library showed a coefficient of 1, then one could say that it was perfectly correlated with the economy: if the economy strengthened by one per cent then this would relate to the circulation figures going up by one per cent. A negative coefficient shows that the circulation moves in an opposite direction to the economy. So a coefficient of -1 would show that circulation would go down by one per cent and the economy would strengthen by one per cent. These coefficients do not reveal a causal relationship between the economy and circulation, however, just a simple correlation. If the Axiom holds true, then one would expect all the coefficients to be negative.
Table 2 Coefficients from regressions run on total circulation for lag periods of zero until six
No lag Lag of 1 time period Lag of 2 time periods Lag of 3 time periods Lag of 4 time periods Lag of 5 time periods Lag of 6 time periods
Vredenburg 0.014134* 0.018083* 0.030556* 0.05932. 0.08794. 0.1328 0.255026
Louwville 0.252626 0.287212 0.33028 0.34898 0.33589 0.2559 0.169354
Saldanha 0.011304* 0.017943* 0.022817. 0.03049. 0.05921 0.0897 0.130522
Diazville 0.004603* 0.013052* 0.018229* 0.01899. 0.05626 0.0771 0.150222
Langebaan 0.232457 0.296882 0.351238 0.43125 0.49488 0.4963 0.519504
Harold
Krumm -0.01389*** -0.01725*** -0.02831** -0.05083** -0.05562* -0.0291 0.089246
St Helena
Bay 0.154466 0.224564 0.268346 0.36488 0.47326 0.5706 0.641751
Laingville -0.0044** 0.025166* 0.085537 0.20514 0.50066 0.6591 0.604509
Hopefield 0.047225. 0.084407 0.124066 0.19794 0.26325 0.3098 0.351462
Paternoster 0.549173 0.600994 0.608997 0.69707 0.69022 0.6081 0.528464
*significant at the 0.1 level, **significant at the 0.05 level, ***significant at the 0.01 level
Only statistically significant figures will be taken into account in the discussion that follows. No reliable conclusions can be drawn from figures that are not statistically significant and these figures will thus not feature in the discussion.
Table 2 shows that the Axiom does not hold for the Saldanha Bay Municipality libraries during the 2008/2009 recession. Vredenburg, Diazville, Hopefield and Saldanha show a positive relationship between circulation and the economy: when the economy strengthens, it is associated with an increase in circulation. This is the antithesis of the Axiom. Harold Krumm shows a negative relationship, and Laingville a mixed relationship that depends on the lag periods.
4.2 Adult fiction
Table 3 Coefficients from regressions run on adult fiction for lag periods of zero until six
No lag Lag of 1 time period Lag of 2 time periods Lag of 3 time periods Lag of 4 time periods Lag of 5 time periods Lag of 6 time periods
Vredenburg -0.47048 -0.5308 -0.55974 -0.6368 -0.7118 -0.70036 -0.43769
Louwville 0.66719** 0.6659** 0.684455** 0.6872** 0.7189** 0.71792** 0.59954*
Saldanha 0.67044** 0.6517** 0.658649** 0.5824** 0.5173* 0.41647* 0.6831**
Diazville 0.45886 0.4099 0.423864* 0.3766* 0.3654 0.24923 0.4369
Langebaan -0.37565 -0.4293 -0.43451 -0.4662 -0.432 -0.40794 -0.36164
Harold
Krumm 1.49748*** 1.452*** 1.479556*** 1.3146*** 1.1988*** 0.97547** 1.4845***
St Helena
Bay -0.12253 -0.1947 -0.17603 -0.2239 -0.2478 -0.22913 -0.14754
Laingville 0.07511 -0.1694 -0.34476 -0.7976 -0.9149 -1.05798 0.20261
Hopefield 0.14121 0.1146 0.180434 0.1999 0.2008 0.18145 0.08283
Paternoster -1.20998 -1.194 -1.10323 -0.9911 -0.8138 -0.58824 -1.35835*
*significant at the 0.1 level, **significant at the 0.05 level, ***significant at the 0.01 level
There is no evidence that the economic recession would have a future effect on whether the library is used to provide more adult entertainment. It could still be the case that use by children is a delayed reaction to the economic climate. This will be discussed in the next section.
4.3 Juvenile material
It is not always the case that more juvenile books are taken out in response to a past recession. It is only the case in some libraries, as Table 4 shows. Some libraries do not have a significant relationship, and others have a positive one. Looking at which lags come up statistically significant, it would appear that past economic conditions have a weaker relationship with juvenile circulation of a particular month. There is not much evidence to support the claim that libraries are used more for children’s entertainment in the months following the onset of an economic recession.
Table 4 Coefficients from regressions run on juvenile fiction for lag periods of zero until six
No lag Lag of 1 time period
Lag of 2 time periods
Lag of 3 time periods
Lag of 4 time periods
Lag of 5 time periods
Lag of 6 time periods
Vredenburg -3.2857*** -3.0398*** -2.6831*** -2.2103** -1.8154* -1.3647 -0.66822
Louwville -1.6464 -1.6953 -1.7065 -1.5595 -1.4409 -1.1286 -0.76391
Saldanha -0.2793** -0.3965** -0.4198* -0.4315 -0.5362 -0.559 -0.53916
Diazville 0.4409*** 0.2941** 0.2262** 0.1786* -0.0183 -0.1016 -0.28689
Langebaan -0.6131** -0.7859* -0.8031 -0.8362 -0.9053 -0.882 -0.82331
Harold
Krumm 1.1542*** 0.8268*** 0.6295** 0.3802* -0.0352 -0.4998 -1.02645
St Helena
Bay -0.6803** -0.9645 -1.0071 -1.1399 -1.375 -1.5997 -1.72181
Laingville 1.1093*** 0.6277*** 0.357** 0.1446* -0.3185 -0.4336 -0.63427
Hopefield 0.1124*** -0.1642** -0.3571* -0.5533 -0.7281 -0.7968 -0.79009
Paternoster -0.3153** -0.4426** -0.4472* -0.5118 -0.4835 -0.4415 -0.3617
4.4 Adult non-fiction
The final part of total circulation examined is adult non-fiction. This section of a library’s collection houses the resources for job seeking as well as do-it-yourself books. Both resources were hypothesised to be used more during an economic recession. Table 5 shows the results of the regressions run on the lagged index to see if it is possible that the effect that the economy has on the circulation of adult non-fiction might be a delayed effect. This does not seem to be the case. Only Vredenburg shows a consistently negative relationship. The statistical significance seems to decrease as the index is lagged over longer time periods. Thus, adult non-fiction is not used more in a delayed response to an economic recession.
Table 5 Coefficients from regressions run on adult non-fiction for lag periods of zero until six
No lag Lag of 1 time period
Lag of 2 time periods
Lag of 3 time periods
Lag of 4 time periods
Lag of 5 time periods
Lag of 6 time periods
Vredenburg -2.724*** -1.2691** -1.1957** -1.0813* -1.0247* -0.9556 -0.7566
Louwville -1.392 -0.4934 -0.4833 -0.4122 -0.3466 -0.1815 -0.006
Saldanha -0.475 0.3213* 0.3136* 0.2936* 0.2057 0.1405 0.0587
Diazville 0.514** 0.3661** 0.3439** 0.3459* 0.2147 0.1713 0.0254
Langebaan -0.439 -0.5088 -0.5139 -0.5235 -0.5591 -0.522 -0.4876
Harold
Krumm 2.937*** 1.2788*** 1.2015*** 1.0581*** 0.7953** 0.5078 0.1322
St Helena
Bay 2.159 -0.3848 -0.3857 -0.4347 -0.5322 -0.6138 -0.6348
Laingville 1.036*** 0.2638** 0.0308 -0.178 -0.5663 -0.7188 -0.9228
Hopefield 0.123** -0.032 -0.085 -0.1642 -0.2342 -0.2661 -0.2728
Paternoster -1.261 -0.8931 -0.8308 -0.8304 -0.786 -0.6587 -0.4985
*significant at the 0.1 level, **significant at the 0.05 level, ***significant at the 0.01 level
4.5 Summary of results
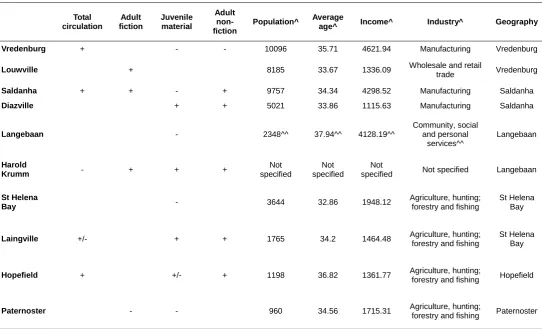
Table 6 gives a summary of the results. Only significant results are considered. Where a cell shows a positive, it indicates that the statistically significant relationship between the circulation and the economy was a positive relationship. A negative sign shows the converse. Where a cell is both positive and negative, it reflects that, depending on the lag period used, the relationship could be negative or positive. Where the cell is empty, there was no statistically significant result on which to report.
Table 6 Summary of the results
Total circulation Adult fiction Juvenile material Adult non-fiction
Vredenburg + - -
Louwville +
Saldanha + + - +
Diazville + +
Langebaan -
Harold Krumm - + + +
St Helena Bay -
Laingville +/- + +
Hopefield + +/- +
Paternoster - -
5 Discussion and conclusion
industry and geographical groupings. Table 7 shows these lenses, along with the data introduced in Table 6. None of the demographic factors chosen explain the observed variance in the results.
Table 7 Summary of the results along with some demographic detail
Total circulation
Adult fiction
Juvenile material
Adult non-fiction
Population^ Average
age^ Income^ Industry^ Geography
Vredenburg + - - 10096 35.71 4621.94 Manufacturing Vredenburg
Louwville + 8185 33.67 1336.09 Wholesale and retail
trade Vredenburg
Saldanha + + - + 9757 34.34 4298.52 Manufacturing Saldanha
Diazville + + 5021 33.86 1115.63 Manufacturing Saldanha
Langebaan - 2348^^ 37.94^^ 4128.19^^
Community, social and personal
services^^
Langebaan
Harold
Krumm - + + +
Not specified
Not specified
Not
specified Not specified Langebaan St Helena
Bay - 3644 32.86 1948.12
Agriculture, hunting; forestry and fishing
St Helena Bay
Laingville +/- + + 1765 34.2 1464.48 Agriculture, hunting;
forestry and fishing
St Helena Bay
Hopefield + +/- + 1198 36.82 1361.77 Agriculture, hunting; forestry and fishing Hopefield
Paternoster - - 960 34.56 1715.31 Agriculture, hunting;
forestry and fishing Paternoster ^data calculated from Statistics South Africa, 2001, ^^includes area served by Harold Krumm Library
There could be many other factors that influence the use of libraries. These factors could be obscuring the expected recessionary effect completely, or be causing it to show up only slightly. Some obvious factors are alternatives to the library such as the internet or television. Other less obvious factors include local shopping malls and the possible interaction between libraries and the changing school curriculum. Lack of empirical evidence prevents a conclusion from being drawn, and a more thorough discussion could be the scope of a subsequent study.
This study examined the effects of the 2008/2009 recession on a system of ten municipal libraries in the Saldanha Bay area. It did so by using the coincident index as a measure of economic activity and circulation as a measure of library use to create a panel dataset. With this dataset, an ordinary least squares fixed effects model was created and multiple regressions were run. The results were varying. Some libraries showed a statistically significant positive relationship, others a negative. Some were not statistically significant. Running these regressions on total circulation, adult fiction, adult non-fiction and juvenile books showed a similar varying result. By looking at the different sections of total circulation it was hoped that different reasons for increased library use could be examined.
Even when examining the possible delayed reaction that library circulation might have in response to economic fluctuations, the Axiom does not hold. The statistical results are contrary to what the anecdotal literature would lead one to believe. This makes the Axiom something of a “flat earth theory”, a theory that only appears true but does not stand up to closer scrutiny. Possibly, the anecdotal evidence provided in the literature is an example of confirmation bias, or improved marketing during recessionary periods. Exploring the disagreement between the anecdotal evidence and the statistical proof is outside the scope of this study.
Another possible explanation for the lack of consistency in the results is that the variables used were not true indicators of the measures they were meant to represent. The coincident index is a nation-wide figure; circulation might have shown a better relationship with an economic indicator more specific to the area. Unfortunately, no such indicator exists. Circulation as an indication of public library use only tells part of the tale. It does not capture in-library use, the use of the library as a place, or the social interactions which public libraries facilitate. Quantitative measures are limited in that they do not explain why certain books are checked out. A qualitative study would explore this question better.
References
Aguolu, I. 1996. Nigerian university libraries: what future? The international information & library review, 28(3): 261-274. Barry, L. 2009. Recession refuge. The news and advance. 13 April. [Online].
http://www2.newsadvance.com/lifestyles/2009/apr/13/recession_refuge-ar-208088/ (31 August 2011).
Balarabe, A. 1995. Contemporary issues in collection development programmes of Nigerian university libraries. The international information & library review, 27(4): 333-343.
Child, R. & Goulding, A. 2012. Public libraries in the recession: the Librarian’s Axiom. Library review, 61(8/9): 641-663. Economist. 2010. Economics A-Z. [Online]. http://www.economist.com/research/economics/ (13 September 2010). Fourie, I. 2007. Library and information structure in South Africa. In Libraries for the future: progress and development of
South African libraries. T. Bothma, P. Underwood & P. Ngulube, Eds.Pretoria: LIASA. 25-42. Available:
http://www.dissanet.com/ifla/pdf/LIASA%2003%20Fourie.pdf (1 August 2011).
Godbey, C. 2009. Library use booming amid economy’s bust. Decatur daily. 13 December. [Online].
http://www.decaturdaily.com/stories/Library-use-booming-amid-economys-bust,49410 (24 July 2011). Grindlay, D. & Morris, M. 2004. The decline in adult book lending in UK public libraries and its possible causes: II.
Statistical analysis. Journal of documentation, 60(6): 632-657. Gujarati, D. 2003. Basic econometrics. Boston: McGraw-Hill.
Herdman, M. 1943. The public library in depression. The library quarterly, 13(4): 310-334. Hicks, B. 2009. Check it out: library’s hip, economical. The post and courier. 5 February. [Online].
http://www.postandcourier.com/news/2009/feb/05/check_out_librarys_hip70729/ (31 August 2011). Hsiao, C. 1989. Analysis of panel data. Cambridge: Cambridge University Press.
James, S. 1985. The relationship between local economic conditions and the use of public libraries. The library quarterly, 55(3): 255-272.
James, S. 1986. Economic hard times and public library use: a close look at the Librarians’ Axiom. Public library quarterly,
7(3-4): 61-70.
Keller, G. & Warrack, B. 2003. Statistics for management and economics. 6th ed. Pacific Grove, CA: Thomson Learning. Koop, G. 2009. Analysis of economic data. 3rd ed. Chichester: Wiley.
Lance, K., Hofschire, L. and Daisey, J. 2011. The Impact of the recession on public library use in Colorado: a closer look report. Denver, CO: Colorado State Library, Library Research Service. Available:
http://www.lrs.org/documents/closer_look/Recession_2011_Closer_Look_Report.pdf (15 October 2013). Library Research Center. 2002. Public library use and economic hard times: analysis of recent data. [Online].
http://www.ala.org/research/sites/ala.org.research/files/content/librarystats/public/economichardtimestechnicalreport.p df (15 October 2013).
Lyons, R. 2013. Rainy day statistics: U.S. public libraries and the Great Recession. Public library quarterly, 32(2): 97-118. Mohr, P. 2000. Economic indicators. Rev. ed. Pretoria: Unisa Press.
Roller, W. 2008. Recession boosts use of library. Yuma sun. 24 December. [Online].
http://www.yumasun.com/news/boosts-46708-library-recession.html (31 August 2011).
Rooney-Browne, C. 2009. Rising to the challenge: a look at the role of public libraries in times of recession. Library review, 58(5): 341-352.
South African Reserve Bank. 2013. Release of selected monthly data economic indicators (seasonally adjusted). [Online].
http://www.resbank.co.za/Research/Statistics/Pages/Statistics-Home.aspx (12 December 2013). Statistics South Africa. 2001. Census 2001 [electronic resource]. Pretoria: Statistics South Africa. Western Cape Provincial Library Service. 2002. Annual report. [Online].
http://www.capegateway.gov.za/eng/publications/annual_reports/2002/10844 (1 August 2011).