REVIEW ARTICLE
Usage of Machine Learning for Intrusion Detection
in a Network
Prachi
Department of CSE & IT, The NorthCap University, India.
[email protected]
Published Online: 30 December 2016
Abstract – Increase in volume and intensity of network attacks, forcing the business systems to revamp their network security solutions in order to avoid huge financial losses. Intrusion Detection Systems are one of the most essential security solutions in order to ensure the security of any network. Considering huge volumes of network data and complex nature of intrusions, the performance optimization of Network Intrusion Detection System became an open problem that is gaining more and more attention from the researchers nowadays. The objective of this paper is to identify a machine learning algorithm that provides high accuracy and real-time system application. This paper evaluates the performance of 15 different machine learning algorithms using NSL-KDD dataset on the basis of false discovery rate, average accuracy, root mean squared error and model building time. Firstly, 5 machine learning algorithms out of 15 are chosen on the basis of maximum accuracy and minimum error in WEKA. Simulation of these machine learning algorithms is performed using 10-fold cross validation. Thereafter, the best machine learning algorithm is selected on the basis of maximum accuracy and minimum model building time so that it can be readily implemented in real-time Intrusion Detection Systems.
Index Terms – Intrusion, Detection, Classification, Network, WEKA.
1. INTRODUCTION
This section should introduce the article. Authors should introduce the problem that is going to be discussed in the entire article. In the era of digital information, growth in the network and its potential allows people to carry out their most mundane of tasks to most complex activities from remote locations in a time efficient manner with great ease. Although network brings lots of new ways to reach the end users for business models, but it also brings the risk associated with it [1]. According to Kessel and Allan survey [2] “Every organization is at the risk of a cyber-attack”. In order to safeguard themselves from these attacks, users and organizations want to protect themselves against intrusions. In technical terms, intrusion is the ability to break into a system and compromise its confidentiality, integrity and availability [3-4].
Therefore, a computer or network system is considered as secure if it possesses confidentiality, integrity and availability against various types of threats [5-6]. To protect networks and sensitive data against intrusions or attacks, different defense
mechanisms are employed by most organizations. Although firewall [7] is used as first line defense to protect against external attacks/intrusions in the majority of organizations, but if an intrusion/attack bypass firewall or attack is internal then firewall is of no use [8].
Attack avoidance methods such as cryptography fail if an attacker uses the weakness of an application such as a buffer overflow in order to cause serious security threats.
Intrusion Detection System (IDS) comes into picture when above mentioned methods fails [9]. They are like the second line of defense in your network or system. An IDS is a hardware or software that monitors the digital traffic to identify malicious activities [10-12]. Basically, IDS is a collection of tools and methods that identifies, analyze and report intrusions [13].
According to the behavior of detection, IDS can be categorized as: Signature and Anomaly based [14]. Signature based IDS detects an attack using a signature database where signatures represent the patterns formed by previous intrusion attacks. However, this type of detection system is not able to discover zero-day attacks. Also, the database should be updated constantly to guarantee that it contains signatures about the newest type of intrusions. Anomaly based IDS constructs the profile of normal network traffic and discovers any deviance in behavior of the normal traffic to recognize attacks using machine learning algorithms and data mining techniques. This profile needs to be updated regularly. Anomaly based IDS can identify zero-day attacks, but with a high probability of producing fake alarms [15].
REVIEW ARTICLE
Literature indicates that researchers have randomly selected one algorithm from each classification category and compared them to find the best one for a particular dataset or they have compared different algorithms from a single category of machine learning algorithms. Moreover, the best algorithm is decided on the basis of predictive accuracy of the algorithm. However, implementation of IDS in a real time environment is only possible if a detection system offers high prediction accuracy in minimum possible time so that remedial actions can take immediately.
Therefore, the motivation behind writing this paper is to determine the performance of 15 most popular machine learning algorithms from different categories and select the best one on the basis of maximum accuracy and minimum prediction time simultaneously for an anomaly based IDS. This paper evaluates the performance of different machine learning algorithms on NSL-KDD dataset.
The rest of the paper is structured as follows:
Section 2 presents the literature survey on IDS. Evaluation environment, machine learning algorithms and their parameters are discussed in Section 3. Section 4 evaluates the different algorithms using NSL-KDD dataset and discusses the results. Lastly, Section 5 concludes the paper and discusses the future work.
2. RELATED WORK
Initially, the concept of intrusion detection was detected by James in 1980 [18]. Author developed a security surveillance model that detects abnormality in the behavior of the user. A systematic framework [19] that uses data mining methods was proposed by Lee et al. to detect intrusions in 1998. In 2000, Lippmann et al. presented a relative study [20] of various classification algorithms for intrusion detection in 2000. A framework [21] that uses different classification algorithms in order to train classifiers on the dataset of benign and malicious executable so that they can detect the category of new executable was developed by Schultz et al. in 2001.
In 2007, Hwang et al. presented a 3-tier architecture IDS [22] that comprises of three different lists: black list, while list and multi-class. White list comprises of normal traffic, black list comprises of known attacks from the traffic and multi-class comprises of anomalies that are identified in the normal traffic. Srinivasulu et al. [23] in 2009 presented various classification algorithms named as CART, Naïve Bayes and Artificial Neural Networks and compared their performance using confusion matrix.
In 2009, Tavallaee et al. [24] studied each feature of KDDCUP’99 dataset in detail. Reddy et al. [25] presented a survey of several IDS techniques in 2011. The effectiveness of all rule based classifiers was evaluated on the basis of accuracy, time, specificity, sensitivity and error by Nadiammai et al. [26].
A comparison study of J48, OneR, Naïve Bayes, PART and RBF network classifier was presented by Kalyani et al. [27] in 2012 on NSL-KDD dataset. The authors also presented the benefits of using NSL-KDD dataset over KDDCUP’99 dataset. Subramanian et al. in 2012 [28] classified the NSL-KDD dataset and studied its performance with the help of Random Tree classifier w.r.t metric data.
In 2012, Neetu proposed an IDS framework [29] as a blend of Naïve bayes and Principal Component Analysis. Results demonstrated that this framework is able to enhance speed of performance. Revathi et al. [30] compared the different classifiers on the basis of performance and accuracy in 2013. The algorithm with highest accuracy is considered as the best classifier.
Dhanabal et al. [31] in 2015 determines the performance accuracy of classification algorithms, J48, SVM and Naïve Bayes on NSL-KDD dataset. In 2016, the performance of Naïve Bayes, J48, OneR and RandomTree was compared using False Positive, True Positive, Correctly and Incorrectly Classified Instances by Chindananda et al [32]. Results demonstrated that RandomTree performed better in comparison to other three algorithms on the above stated parameters.
It is clear from the above discussion that authors in literature selected the best classifier on the basis of prediction accuracy in classifying instances. However, the time required to construct a model is very crucial for implementation of a developed intrusion detection model. Consequently, the motive of this paper is to design a model that possesses maximum accuracy and take minimum time in building the model.
3. EMPIRICAL STUDY
In this paper, author use NSL-KDD dataset to determine the effectiveness of various machine learning algorithms for intrusion detection and perform experiments in a stepwise manner. Firstly, the experiment evaluation environment is built upon by choosing the platform, software, dataset and test option. Secondly, different classifiers are chosen from the different classification categories: Bayesian, functions, rules and tree based approaches.
3.1. Evaluation experiment
All the simulations were executed on a computer system that has i5-5200U CPU, 8.00 GB RAM and Windows 7 Professional operating system. WEKA (3.8)- an open source machine learning algorithm is used [33]. It was developed in 1997 by University of Waikato, New Zealand.
REVIEW ARTICLE
regression, classification, clustering, association rules, attribute evaluator and visualization. In this paper, the author evaluates some of the machine learning algorithms.
In this paper, improvised version of KDDCUP’99; NSL-KDD dataset is used for the experimental purposes. KDDCUP’99 is one of the most extensively used dataset for Intrusion Detection and publically available [34, 35]. It contains around 4,900,000 records and each record contains 41 features. The KDD CUP dataset is not preferred nowadays because it suffers from several problems [24]. According to Tavallaee et al. [24], this dataset was generated using a closed network and suffers from problem of redundant entries, hand injected attacks and non-validation. These drawbacks in KDD CUP dataset lead to performance degradation of various IDS.
The NSL-KDD dataset was introduced to resolve some of the inherent problems of KDDCUP’99. It comprises of carefully chosen records of an entire KDDCUP’99 dataset and also resolves the problems specified by Tavallaee et al. [24]. The NSL-KDD dataset contains 125,973 records where each record comprises of 41 features. This paper evaluates NSL-KDD dataset because it can be easily shared and allows other researchers to compare all classification techniques under the same baseline. With live network traffic it became challenging for researchers to validate or improve former research outcomes because live data is never shared or released due to secrecy concerns. This dataset is used to design a better IDS. It divides the network traffic into 2 classes. It initially contains 42 attributes and 125973 instances.
This paper uses 10-fold cross-validation to train and evaluate the algorithms because it reduces the variation of estimation [36]. In case of cross validation, data is partitioned into 2 subsets, one subset for carrying out the analysis and other subset for authenticating the analysis. To reduce the variance, several iterations are executed with variable size partitions and then the average is taken. In case of 10-fold cross validation, the dataset is arbitrarily partitioned in 10 parts in such a manner that class is represented in equal proportion as in the case of the entire dataset. The learning process is done 10 times on different training sets. An average of 10 error rates across 10 different folds calculated to obtain an overall error rate. 10 fold cross validation is considered because extensive experiments on different datasets have revealed that 10 folds gives you the finest estimation of error [36]. With the help of the above settings, evaluation of different classification algorithms is performed.
3.2. Classification algorithms
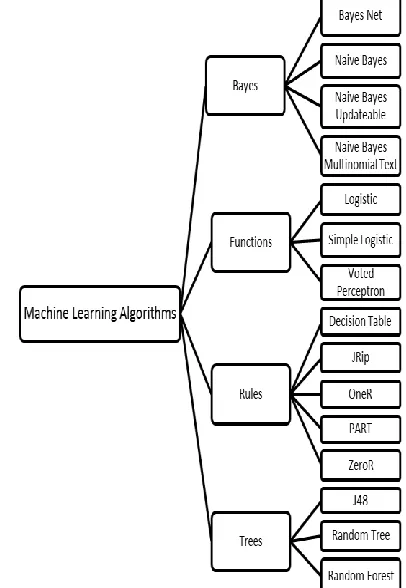
Different classifiers can classify the traffic of network as normal or anomaly. In this paper, WEKA is used to classify traffic using algorithms of different classification categories as shown in Figure 1.
Figure 1 Various Machine Learning Algorithms in Different Categories.
Brief description of these classification categories is as follows:
3.2.1. Bayes Classifier
Bayesian classifiers [37] use Bayes’s theorem to evaluate the likelihood of occurrence of certain events and store the probability of class and conditional probability of each attribute. After encountering a new instance, algorithm updates the probabilities stored with the specific class. Under this category, the four algorithms are evaluated. Brief description of evaluated algorithms is as follows:
3.2.1.1. Bayes Net
A Bayesian network [37] represents a set of variables as nodes of the graph and dependency among these variable is shown in form of edges. During modeling, a Bayesian network must make certain assumptions about the dependence and independence among variables because in the real world two variables are never completely independent. Bayes Net models relation between features in a very simple way. However, this type of model is very complex to implement.
3.2.1.2. Naïve Bayes
REVIEW ARTICLE
are completely independent. Naïve Bayes is used when you have limited memory, CPU power and training time is also very crucial. Naïve Bayes is computationally efficient and can be trained very easily. However, it is very simple representation doesn’t allow for rich hypothesis. Also, assumption about independence among attributes is too constraining.
3.2.1.3. NaiveBayesMultinomialText
It is a specific form of Naïve Bayes designed for text documents. Simple Naïve Bayes models a document as the occurrence and absenteeism of individual words. Multinomial based Naïve Bayes is used when multiple occurrences of words matter a lot because it takes into consideration quantity of occurrences. It possesses high computational efficiency, accuracy for most of classification and prediction problems but accuracy/precision decreases with small amount of data.
3.2.1.4. NaiveBayesUpdateable
It is an incremental version of Naïve Bayes that handles one request at a time. It uses kernel estimator and default precision of 0.1 for modeling of numerical attributes. It doesn’t use discretization.
3.2.2. Functions Classifier
They deploy the model of regression and neural network [38]. In this type of classifier, the input data is mapped to the output data. In this category, following 3 algorithms are evaluated:
3.2.2.1. Logistic
Logistic regression [39] assumes that input variables are numeric and they have a Gaussian distribution. However, it can also achieve good results if data is not Gaussian. It is fast and simple to implement but suffers from an overfitting problem.
3.2.2.2. Simple Logistic
SimpleLogistic adds one SimpleLinearRegression model per class. SimpleLogistic has built-in attribute selection i.e. it stops adding SimpleLinearRegression models when the cross validation error stops decreasing. It prevents overfitting of training data but slows down the learning process.
3.2.2.3. Voted Perceptron
This algorithm takes benefit of data that is linearly separable with huge margins. Easy to implement and its precision is comparable to Support Vector Machine (SVM). It also works with high dimensional data using kernel functions. However, this algorithm requires huge amount of storage in storing weight vectors and their count. Also, learning process is very slow.
3.2.3. Rules Classifier
For an accurate estimate of class amid all the attributes association rules are used [36, 40]. They are mutually exclusive
in nature and can be learnt one at a time. More than one conclusion can be predicted with the help of rule based classifier. Brief description of algorithms evaluated in this category is as follows:
3.2.3.1. Decision Table [41]
It summarizes the dataset in the form of a decision table that comprises of equal amount of attributes as in the original dataset. Later on, it determines a decent subgroup of attributes using best first search. By excluding the less contributory attributes in the designing of model this algorithm eliminates the risk of over-fitting and in turn generates a small and compressed decision table. However, calculation gets very complex if several values are uncertain.
3.2.3.2. JRip
It uses examples of a previous judgment in the training data and determines a set of rules that covers all the members of that class. Thereafter, it proceeds to next class until all the classes are covered. JRip builds models in such a way that they can be interpreted very easily. It can also handle categorical and continuous values as well as noisy data. However, it doesn’t not provide high precision/accuracy when the training set is small.
3.2.3.3. OneR
It builds a single rule corresponding to every attribute then selects the rule that has the lowest error rate. That’s why it is known as OneR. In WEKA, a rule which identifies the maximum number of correct instances is selected as its single rule. To do so, the most recurrent class of that attribute value is determined [41]. If 2 rules possess identical error rate then it selects one of the rules at random [42]. The rules generated in this way might not be that accurate in comparison to other state of art algorithms but simple and easy to interpret. Also, it divides all values into disjoint intervals. This may cause over fitting problem in case of continuous-valued attributes.
3.2.3.4. PART
This algorithm generates an ordered set of rules known as decision rules. Novel data is matched against every rule and item is allotted the class of best matching rule. In each iteration. It is an amalgamation of C4.5 and JRip algorithm [43].
3.2.3.5. ZeroR
REVIEW ARTICLE
3.2.4. Trees
They prepare a tree like structure as a result where nodes represent a test on the value of attribute and branch represents the outcome of the test [44-45]. They are also popular with the name decision tress. Description of algorithms evaluated under this category on NSL-KDD dataset is as follows:
3.2.4.1. J48
It produces a binary tree and classifies a new item on the basis of decision tree made by attributes values of training data. Whenever a training set is encountered, this algorithm recognizes the attribute that differentiates majority of instances in an accurate manner. A classification-decision tree is generated for the given dataset by recursively partitioning the data until data is perfectly categorized so that maximum accuracy can be assured of the training data. It is one of the best machine learning algorithms.
3.2.4.2. RandomTree
This algorithm is called random tree because you are actually classifying the dataset repeatedly by randomly selecting a subset of attributes, this results in the formation of multiple decision trees. To reach a final decision, every tree makes a vote. This kind of methodology reduces the risk of overfitting. It runs efficiently on large datasets and maintains correctness even when a huge percentage of data is missing. However, it ignores the correlation among attributes.
3.2.4.3. RandomForest
RandomForest is a combination of multiple RandomTrees into one large classifier with more amount of randomization. The value of each tree depends on the input vector sampled independently. Randomness is incorporated by building each tree but on slightly different rows sampled with repetitions. Also, certain numbers of features are selected by randomly electing subset of columns. So, each tree is different and each tree votes for a particular class and class with maximum number of votes became predicted class. It offers lower classification error and handles uneven datasets really well. It possesses the danger of overfitting with high cardinality categorical variables. Moreover, it is hard to make them incremental and difficult for human to interpret.
4. PERFORMANCE EVALUATION
To evaluate the performance of 15 most widely used machine learning algorithms on different metrics using NSL-KDD dataset, a simulation study is performed in this section.
4.1. Simulation environment
The performance of different machine learning algorithms on NSL-KDD dataset is evaluated with the help of WEKA. The evaluation is performed on the KDDTrain+.arff file that contains 125,973 instances with 41 attributes. 10-fold cross
validation is used as a test option throughout all the evaluations. Evaluations are performed a multiple number of times and results are compiled by taking an average of ten different evaluations on the KDDTrain+.arff file. Evaluation provides you lots of information about the algorithm such as model building time, different type of errors and a confusion matrix. Confusion matrix is the foundation from which a number of different parameters can be calculated. Confusion matrix is composed of 4 values:
True Positive (TP): TP indicates the number of positive instances identified accurately.
False Positive (FP): FP indicates the number of negative instances identified as positive incorrectly i.e. number of normal traffic instances incorrectly classified as attacks
True Negative (TN): TN indicates the number of negative instances identified as negative.
False Negative (FN): FN indicates the number of positive instances identified as negative incorrectly.
In this paper, False Discovery Rate, Average Accuracy, Root Mean Squared Error and Model Building Time are used to evaluate performance of classifiers where a value of False Discovery Rate and Average Accuracy are determined with the help of the confusion matrix.
4.2. Performance Evaluation
This section presents the performance comparison between 15 above mentioned algorithms on the basis of different metrics on NSL-KDD dataset.
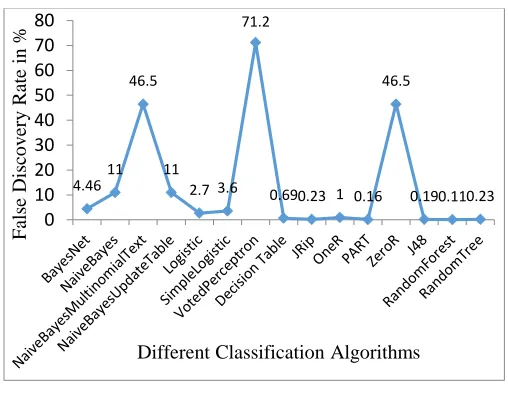
4.2.1. False Discovery Rate (FDR)
Figure 2 False Discovery Rate
FDR indicates the percentage of incorrectly made positive predictions out of the total number of positive predictions. It is calculated with the help of below mentioned formula:
4.4611 46.5
11 2.7 3.6
71.2
0.690.23 1 0.16 46.5
0.190.110.23
0 10 20 30 40 50 60 70 80
Fals
e
Dis
co
v
er
y
R
ate
in
%
REVIEW ARTICLE
FDR = FP
TP + FP∗ 100
For example, in case of a Bayes Net algorithm number of FP and TP instances are 3129 and 66908 respectively in NSL-KDD dataset. Therefore, the FDR of Bayes Net is calculated as
% 46 . 4 100 * 70037 3129 100 * 3129 66908
3129
FDR
It should be as small as possible for a good classification algorithm. Figure 2 demonstrates that RandomForest possesses minimum FDR followed by PART, J48, RandomTree and JRip.
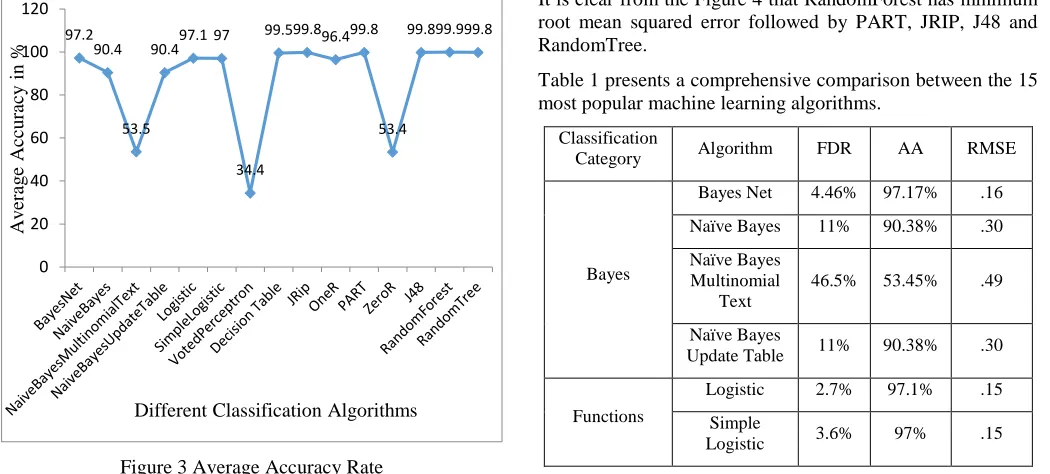
4.2.2. Average Accuracy (AA)
AA is determined as the percentage of correctly classified instances from the total number of class instances. It is calculated with the help of below mentioned formula:
AA = TP + TN
TP + FN + FP + TN
For example, in case of a Bayes Net algorithm number of TP, TN, FP and FN instances are 66908, 55501, 3129 and 435 respectively in NSL-KDD dataset. Therefore, the FDR of Bayes Net is calculated as
% 2 . 97 100 * 125973 122409 100 * 55501 3129 435 66908 55501 66908 FDR
Average Accuracy of a classification algorithm must be on the high end. Figure 3 illustrates the fact that RandomForest possesses the highest accuracy of 99.9% followed by RandomTree, PART, J48 and JRip with 99.8% accuracy.
Figure 3 Average Accuracy Rate
4.2.3. Root Mean Squared Error (RMSE)
RMSE is an excellent metric for numeric prediction. To calculate RMSE, we first need to calculate residual. Residual is difference between actual value and the value predicted by the model. RMSE is calculated with the help of below mentioned formula:
𝑅𝑀𝑆𝐸 = √1
𝑛∑(𝑦𝑖− 𝑦̂)𝑖
𝑛
𝑖=1
Where, yi is the actual value, ŷ iis the predicted value and n is
number of predictions.
Figure 4 Root Mean Squared Error
It is clear from the Figure 4 that RandomForest has minimum root mean squared error followed by PART, JRIP, J48 and RandomTree.
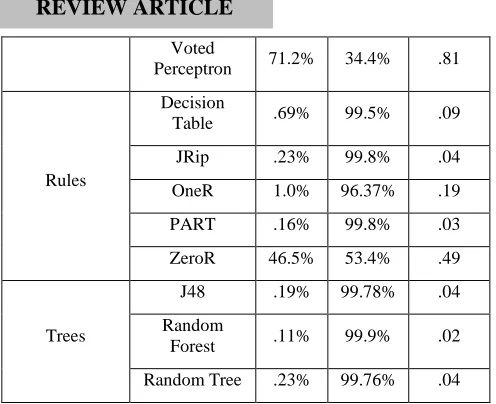
Table 1 presents a comprehensive comparison between the 15 most popular machine learning algorithms.
Classification
Category Algorithm FDR AA RMSE
Bayes
Bayes Net 4.46% 97.17% .16
Naïve Bayes 11% 90.38% .30
Naïve Bayes Multinomial
Text
46.5% 53.45% .49
Naïve Bayes
Update Table 11% 90.38% .30
Functions
Logistic 2.7% 97.1% .15
Simple
Logistic 3.6% 97% .15
97.2 90.4
53.5
90.497.1 97
34.4 99.599.896.499.8 53.4 99.899.999.8 0 20 40 60 80 100 120 A v er ag e A cc u rac y in %
Different Classification Algorithms
0.16 0.3 0.49 0.3 0.150.15 0.81 0.09 0.04 0.19 0.03 0.49 0.040.020.04 0 0.1 0.2 0.3 0.4 0.5 0.6 0.7 0.8 0.9 R o o t m ea n s q u ar ed er ro r
REVIEW ARTICLE
Voted
Perceptron 71.2% 34.4% .81
Rules
Decision
Table .69% 99.5% .09
JRip .23% 99.8% .04
OneR 1.0% 96.37% .19
PART .16% 99.8% .03
ZeroR 46.5% 53.4% .49
Trees
J48 .19% 99.78% .04
Random
Forest .11% 99.9% .02
Random Tree .23% 99.76% .04
Table1 Performance Comparison of 15 Classifiers on the basis of different parameters
It is clear from the above results that out of 15 classification algorithms, 5 classification algorithms perform best in terms of accuracy, false detection rate and error. Table 2 depicts the performance comparison between best 5 machine learning algorithms.
Classification Category
Algorith m
FDR AA RMSE
Rules
JRip .23% 99.8% .04
PART .16% 99.8% .03
Trees
J48 .19% 99.78% .04
Random Forest
.11% 99.9% .02
Random Tree
.23% 99.76% .04
Table2: Performance Comparison between best 5 machine learning algorithms on the basis of different parameters
However, model building time is a very crucial parameter in order to decide the feasibility of implementation of an algorithm in real-time network IDS. An algorithm will not be suitable if its average accuracy is very low or if its training time is very high. Therefore, it is very important to determine the time required by an algorithm to build a model on the dataset so that best suitable model out of these 5 algorithms can be used for a real-time network IDS.
4.2.4. Model Building Time (MBT)
MBT is the model building time on training data. Figure 5 shows that model building time is minimum in case of
RandomTree and maximum for JRip out of a set of best 5 performing algorithms.
Figure 5 Model Building Time
4.3. Discussion
After analyzing the performance comparison of 15 classification algorithms, it is concluded that some algorithms perform better than the other algorithms. Here, the author discusses all the evaluation parameters separately.
4.3.1. False Discovery Rate
FDR is the percentage of incorrectly made positive predictions out of the total number of positive predictions. It basically highlights the number of normal traffic instances incorrectly classified as attacks. It is clear from the results that RandomForest has minimum FDR followed by PART, J48, RandomTree and JRip. However, the difference between FDR of these algorithms is negligible since it is below 0.25% for best 5 algorithms. VotedPreceptron, ZeroR and NaiveBayesMultinomialText are clearly out of competition since they possess very high FDR.
4.3.2. Average Accuracy
All tree and rule based algorithms possess high accuracy except ZeroR algorithm. It also validates author’s discussion in section 3 that ZeroR is useful in providing baseline performance. VotedPerceptron provides a minimum amount of accuracy, followed by zeroR and other NaiveBayes based algorithms.
4.3.3. RootMeanSquaredError
In contrast to Mean Absolute Error, RMSE punishes large errors severely. It is minimum for RandomForest followed by PART, RandomTree, J48 and JRip with negligible or no difference. Like in case of FDR and AA, RMSE is higher in case of VotedPerceptron.
0 20 40 60 80 100 120 140 160
Mo
d
el
B
u
ild
in
g
T
im
e
in
s
ec
REVIEW ARTICLE
Although the detection rate is a very crucial component in an IDS but at the same time it is very important to evaluate the feasibility of implementing an algorithm in a real-time IDS. Selection of a classification algorithm plays a very important role in performance improvement of a network IDS. A network IDS is the necessity for commercial world not for the scientific world. Companies look for the algorithms that not only detect intrusion with high accuracy but also within a very short span of time. Algorithms that possess very high accuracy but consume lots of time in building the model can only be used by researchers in their laboratories. Therefore, it is very important to take model building time into consideration.
4.3.4. Model Building Time
It is evident from the above table 1 that RandomForest offer highest detection rate and lowest false alarms in comparison to other 14 algorithms. RandomForest takes significant time in building model because it builds multiple classifiers. The best performed algorithm with low time to build the model is RandomTree. This model can play significant role for the organizations looking for deploying a real time network IDS. This model can also be beneficial for researchers who are working on the development of lightweight data mining algorithms.
5. CONCLUSION
The motive of this paper is to identify an efficient and accurate machine learning algorithm that can address and control the ever increasing problem of network intrusion in a convenient manner. Initially, a literature survey is made on the studies of KDDCUP’99 and NSL-KDD dataset. Later on, a comprehensive study of 15 most popular machine learning algorithms along with their pros and cons is done. Then, WEKA is used to assess the performance of most popular machine learning algorithms. The paper concludes that out of 15 most popular machine learning algorithms, RandomTree possesses a high detection rate and minimum model building time so it can be readily implemented in a real-time network IDS. In the future work, feature selection will be done in the existing algorithm so that detection accuracy can be improved further without increasing the model building time on the high dimensional dataset. Besides, real time implementations of the algorithm will be done to in order to evaluate its effectiveness.
REFERENCES
[1] R Daş, A Karabade, G Tuna, “Common Network Attack Types and Defense Mechanisms”, in Signal Processing and Communications Applications Conference (SIU), 16-19 May 2015, pp. 2658 – 266. [2] P. Kessel, K. Allan, “Get ahead of cybercrime” in Global Information
Security Survey, October 2014, pp. 1-36.
[3] M Panda, A. Abraham, M. R. Patra, “A hybrid intelligent approach for network intrusion detection” in International Conference on Communication Technology and System Design, vol. 30, 2012, pp. 1-9. [4] O. Can, O.K. Sahingoz, “A survey of intrusion detection systems in
wireless sensor networks” in 6th International Conference on in
Modeling, Simulation, and Applied Optimization (ICMSAO), 27-29 May 2015, pp.1-6.
[5] R.C. Summers, “Secure computing: Threats and safe-guards” in Computers, New York: McGraw-Hill, 2000, pp. 1-688
[6] C. P. Pfleeger, S. L. Pfleeger, “Security in Computing” in Computer Security, 4th ed., USA: Prentice Hall PTR, 2006, pp. 1-845.
[7] Firewalls (2015). Firewall definition from pc magazine encyclopedia. Retrieved from http://www.pcmag.com/encyclopedia/term
/43218/firewall; accessed June 18, 2015.
[8] W. Stallings, “Cryptography and Network Security: Principles and Practice” 5th ed., USA: Prentice Hall Press, pp. 1-900
[9] H. M. Imran, A. B. Abdullah, M. Hussain, S. Palaniappan, and I. Ahmad, “Intrusions detection based on optimum features subset and efficient dataset selection” in International Journal of Engineering and Innovative Technology(IJEIT) vol. 2, no. 6, 2012, pp. 265-270.
[10] U. Bashir, M. Chachoo, “Intrusion detection and prevention system: Challenges & opportunities” in International Conference on Computing for Sustainable Global Development (INDIA Com), 5-7 March 2014, pp.806-809.
[11] M. Baykara, R. Daş, “A Survey on Potential Applications of Honeypot Technology in Intrusion Detection Systems”, in International Journal of Computer Networks and Applications (IJCNA), vol. 2, no. 5, October 2015, pp. 203-208.
[12] M. J. Ikram, J. Cazalas, “Efficient Collaborative Technique using Intrusion Detection System for Preserving Privacy in Location based Services”, in International Journal of Computer Networks and Applications (IJCNA), vol. 2, no. 5, October 2015, pp. 222-231. [13] H. Benmoussa, A. A. Kalam, A. A. Ouahman, “Towards a new intelligent
generation of intrusion detection system”, in Proceedings of the 4th Edition of National Security Days, 12-13 May 2014, pp.1-5.
[14] S. Benferhat, K. Tabia, “Integrating Anomaly-Based Approach into Bayesian Network Classifiers” in e-Business and Telecommunications, 2009, vol.8, eds. Joaquim Filipe, Mohammad S. Obaidat, pp. 127-139. [15] J. McHugh, “Testing intrusion detection systems: A critique of the 1998
and 1999 DARPA intrusion detection system evaluations as performed by Lincoln Laboratory” in ACM Transactions on Information and System Security, vol. 3, no. 4, 2000, pp. 262–294.
[16] A. Hofmann, B. Sick, “Online Intrusion Alert Aggregation with Generative Data Stream Modeling," in IEEE Transactions on Dependable and Secure Computing, vol. 8, no. 2, 2011, pp. 282-294. [17] O. Maimon, L. Rokach (Eds.), “Data Mining and Knowledge Discovery
Handbook” in Database Management & Information Retrieval, 2nd ed. Springer, 2010, pp. 1-1285
[18] J. P. Anderson, “Computer security threat monitoring and surveillance,” Technical Report, Fort Washington, Pennsylvania, USA, 1980. [19] W. Lee and S. J. Stolfo, “Data mining approaches for intrusion detection”
in Proceedings of the 7th conference on USENIX Security Symposium, vol. 7, San Antonio, TX, 1998.
[20] R. Lippmann, J. W. Haines, D. J. Fried, J. Korba, and K. Das, “The 1999 DARPA off-line intrusion detection evaluation” in Computer Networks, vol. 34, no. 4, 2000, pp. 579-595.
[21] M. G. Schultz, E. Eskin, E. Zadok, S. J. Stolfo, “Data Mining Methods for detection of New Malicious Executables”, in IEEE Symposium on Security and Privacy, Columbia University, 14-16 May 2000, pp.38-49. [22] T. Hwang, T.Lee, and Y. Lee, “A Three-tier IDS via Data Mining Approach” in Proceedings of the 3rd annual ACM workshop on Mining network data, 2007, pp. 1-6.
[23] P. Srinivasulu, D. Nagaraju, P. R. Kumar, and K. N. Rao, “Classifying the Network Intrusion Attacks using Data Mining Classification Methods and their Performance Comparison” in IJCSNS International Journal of Computer Science and Network Security, vol. 9, no.6, 2009, pp. 11-18. [24] M. Tavallaee, E. Bagheri, L. Wei, and A. A. Ghorbani, “A detailed
REVIEW ARTICLE
[25] K. Reddy, M. Iaeng, V. N. Reddy, and P. G. Rajulu, in “A Study of Intrusion Detection in Data Mining” in World Congress on Engineering, vol. III, 2011, July 6-8.
[26] G. V. Nadiammai and M. Hemalatha, “Perspective analysis of machine learning classifiers for detecting network intrusions” in IEEE Third International Conference on Computing Communication & Networking Technologies (ICCCNT), India, 26-28 July 2012, 2012, pp. 1-7. [27] G. Kalyani and A. J. Lakshmi, “Performance Assessment of Different
Classification Techniques for Intrusion Detection” in IOSR Journal of Computer Engineering (IOSRJCE), vol. 7, no. 5, 2012, pp. 25-29. [28] S. Subramanian, V. B. Srinivasan, and C. Ramasa, “Study on
Classification Classifiers for Network Intrusion Systems” in Journal of Communication and Computer, vol. 9, 2012, pp. 1242-1246.
[29] B. Neethu, “Classification of Intrusion Detection Dataset using machine learning Approaches” in International Journal of Electronics and Computer Science Engineering, vol. 1, 2012, pp. 1044-51.
[30] S. Revathi, Dr. A. Malathi, “A Detailed Analysis on NSL-KDD Dataset Using Various Machine Learning Techniques for Intrusion Detection”, in International Journal of Engineering Research & Technology (IJERT), vol. 2 no. 12, 2013, pp. 1848-1853
[31] L. Dhanabal, Dr. S.P. Shantharajah, “A Study on NSL-KDD Dataset for IntrusionDetection System Based on Classification Algorithms” in International Journal of Advanced Research in Computer and Communication Engineering, vol. 4, no. 6, 2015, pp. 446-452. [32] P. C. Murthy, Dr. A. S. Manjunatha, A. Jaiswal, B. R. Madhu, “Building
Efficient Classifiers For Intrusion Detection With Reduction of Features” in International Journal of Applied Engineering Research, vol. 11, no. 6, 2016, pp. 4590-4596
[33] WEKA. (2014). Weka 3 - Data Mining with Open Source Machine Learning Software in Java. [Online] Available at: http://www.cs.waikato.ac.nz/ml/weka/ [Accessed: 4 Mar 2014]. [34] KDD Cup 1999. Available on: http://kdd.ics.uci.edu/databases/kddcup
99/kddcup99.html
[35] M. Lichman, (2013). UCI machine learning repository. http://archive.ics.uci.edu/ml. accessed sep 2016.
[36] I. H. Witten, E. Frank, and M. A. Hall, “Data Mining: Practical Machine Learning Tools and Techniques”, 3rd ed., eds. J. Geller, E. Davis, P.A. Flach, Morgan Kaufmann Publishers Inc, 2011, pp. 1-558
[37] G. H. John, P. Langley, “Estimating Continuous Distributions in Bayesian Classifiers” in Proc. Of the 11th Conference on Uncertainity in Artificial Intelligence, August 18 - 20, 1995, pp. 338-345
[38] Dash, R. Kumari. “Selection of the Best Classifier from Different Datasets Using WEKA” in International Journal ofEngineering Research and Technology, vol. 2, no. 3, March-2013.
[39] S. L Cessie, J. C. Van Houwelingen, “Ridge Estimators in Logistic Regression” in Applied Statistics, vol. 41, no. 1, 1992, pp. 191-201. [40] P. Werbos, “Beyond Regression: New Tools for Prediction and Analysis
in the Behavioral Sciences”. PhD Thesis, Harvard University, 1974. [41] B.R. Gaines, P. Compton, “Induction of ripple-down rules applied to
modeling large databases”
[42] S Vijayaran, Sudha. “An Effective Classification Rule Technique for Heart Disease Prediction” in International Journal of Engineering Associates (IJEA), vol.1, no. 4, 2013, pp.81-85.
[43] S. Ali, K. A. Smith, “On learning algorithm selection for classification” in Applied Soft Computing, vol. 6, no. 2, 2006, pp. 119-138.
[44] J. Quinlan “C4.5: Programs for Machine Learning” in ---. Morgan Kaufmann, San Mateo, 1993.
[45] R. Kohavi, “Scaling up the accuracy of naïve-bayes classifier: A decision-tree hybrid” in Proc. of the 2nd International Conference on Knowledge Discovery and Data Mining, pp.202–207. AAAI Press, Menlo Park, 1996.
Author
Dr. Prachi is working as Associate Professor in The