Original Research Article
Nutritional status of adolescent school girls residing in rural areas of
Dharwad district, India: a cross sectional study
Sreeshma Pavithran*, D. D. Bant
INTRODUCTION
The WHO has defined adolescence as the age period between 10 to 19 years of age for both the sexes (married and unmarried).1,2 Adolescent and youth population together constitute 26.3% of world’s population and in India, as per the 2011 census, there are 253.2 million adolescents in India, which accounts to 20.9% of the population, constituting nearly one tenth of Indian population, form a crucial segment of the society.3 50% of adult of weight and adult skeletal mass is attained during adolescence period.Rapid Increase in height and related skeletal growth and onset menarche increases
energy and nutrients demand and thus leading to deficiency micronutrients like iron, calcium and iodine. Poor nutrition can delay puberty and lead to stunting. Adolescent girls form a vital “link” of nutrition between the present and the future generation. Early marriage and risk of pregnancy at earlier age increases the chance during child birth and malnourished adolescent mothers are less likely with stand these complications. Other Cultural factors like preference to male child, differential expenditure on nutrition, feeding of women with left-over food and add on burden of adolescent girls to help in household duties prevalent in rural areas effect their growth and development.
ABSTRACT
Background: Adolescence is a period with rapid growth drive and demands higher nutrition. Improving Nutritional status of rural adolescent girls becomes the cornerstone of community’s nutritional status and target intervention for breaking intergeneration cycle of nutritional deficiencies. The objective of the study was to determine nutritional status and study the demographic factors affecting nutritional status of rural adolescent girls in Dharwad district.
Methods: A cross-sectional study was carried out among 350 adolescent school girls studying in eight high schools in rural area of Dharwad district during July – September 2017. Demographic profile and dietary pattern was obtained. Anthropometric measurement and clinical examination was done. Statistical analysis was done using SSPS package.
Results: Study found 14.9% of rural adolescent girls were under- weight for their age. Based on BMI, 25.2% of girls were under-nourished and 3.7% were over nourished. Significant relation with age, type of diet and age of menarche was found at p value <0.05.
Conclusions: There is high prevalence of under nutrition among adolescent girls and is under nutrition is associated with micronutrient deficiencies like anaemia. There is need to create awareness to improve the nutritional needs of adolescent girls in rural areas.
Keywords: Adolescent girls, Nutritional status, Rural area, Nutrient intake, BMI
Department ofCommunity Medicine, Karnataka Institute of Medical Sciences, Hubballi, Karnataka, India
Received: 04 May 2018
Revised: 26 May 2018
Accepted: 28 May 2018
*Correspondence:
Dr. Sreeshma Pavithran,
E-mail: [email protected]
Copyright: © the author(s), publisher and licensee Medip Academy. This is an open-access article distributed under the terms of the Creative Commons Attribution Non-Commercial License, which permits unrestricted non-commercial use, distribution, and reproduction in any medium, provided the original work is properly cited.
Nutrition forms the cornerstone to attain healthy physical growth and reproductive outcome in adulthood. Thus the world wide attention is now drifted towards improving the nutritional status of adolescent girls to break the intergeneration cycle of malnutrition. Despite considerable understanding regarding the nutritional challenges faced by adolescent, it is not mostly neglected in resource limited families in rural areas. The present study to assess nutritional status is conducted in rural areas of North Karnataka districts which have high rate of early marriages and high maternal mortality rates.
METHODS
A cross sectional study was conducted among 350 rural adolescent school girls studying in class 8th, 9th and 10th standard from 8 high schools from Kalgatigi Taluk, Dharwad district, Karnataka, India which is rural field practice of Department Of Community Medicine, Karnataka Institute of Medical Sciences during July - September 2017. Permission was obtained respective school authorities after obtaining ethical committee approval from institution. Written informed Consent for participation and examination was taken from parents. All girls whose parents consented for participation and were present at school on the day of data collection were included in study. Data regarding demographic profile and dietary pattern was obtained using pre-designed & semi-structured questioner by interview method. Anthropometric measurements like height, weight, hip circumference and waist circumference were measured using standardised instrument. The socioeconomic evaluation was done as per the updated modified BG Prasad classification 2017. 72 hour diet was noted and calories and protein content of various for Indian cooked and uncooked food was obtained.4,5 Intake per day was calculated and compared with standard recommended intake.
The WHO Height- for – age Z-score chart for individuals aged 5-19 years is used for assessment of weight for age and classified as normal, stunting and severe stunting.6 Weight- for –age is assessed using weight- for- age charts using Agarwal Growth charts, IAP for Indian children 1-18 years of age.7 The WHO BMI (body mass index) - for –age chart for girls aged 5-19 years is used and accordingly the students are classified as normal, thinness, severe thinness, overweight and obese.8 A waist-height ratio of >0.5 is a considered high risk for diabetics, obesity and metabolic syndrome.9 The is data were computerised and analysed using SPSS Package.
RESULTS
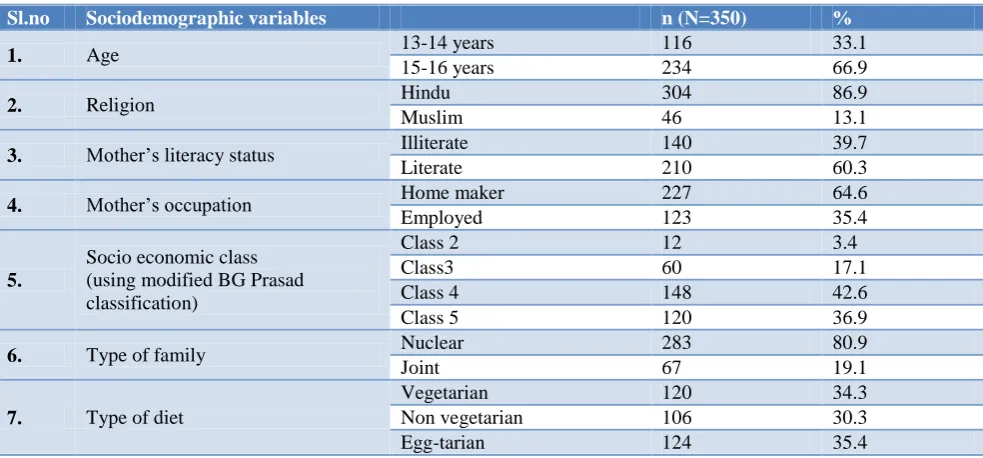
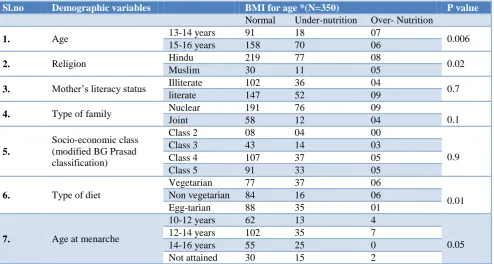
The study population belonged to age group of 13 to 16 years. The mean age of the study population was 14.85±2.3 years. Table 1 shows the demographic profile of rural adolescent girls. Majorities were Hindus, i.e. 87% and 42.6% belonged to Class IV B.G Prasad Classification. 80.9% girls lived in nuclear families. Mean height of adolescent girls studied was 149.9±6.29 and their mean weight was 40.75±6.9. According to WHO- height for age WHO chart, Severe stunting was found in 14.9% of girls. 14.9% of girls were found under- weight for age as per IAP-KN Argarwal chart. According WHO BMI- for –age, 25.2% were found under nourished and 1.4% obese. 10% of rural adolescent girls were found have waist height ratio >0.05 (Table 2). Under-nutrition was higher among girls belonging to middle adolescent (15-16 years) i.e., 29.9% (70) compared to 11.2% (18) in early adolescents (13-14years). Vegetarians had higher prevalence of under nutrition i.e. 30.8% (37) compared to non-vegetarians and egg-tarians. These results are significant at p value >0.05 (Table 3).
Table 1: Sociodemographic profile of the study population.
Sl.no Sociodemographic variables n (N=350) %
1. Age 13-14 years 116 33.1
15-16 years 234 66.9
2. Religion Hindu 304 86.9
Muslim 46 13.1
3. Mother’s literacy status Illiterate 140 39.7
Literate 210 60.3
4. Mother’s occupation Home maker 227 64.6
Employed 123 35.4
5.
Socio economic class (using modified BG Prasad classification)
Class 2 12 3.4
Class3 60 17.1
Class 4 148 42.6
Class 5 120 36.9
6. Type of family Nuclear 283 80.9
Joint 67 19.1
7. Type of diet
Vegetarian 120 34.3
Non vegetarian 106 30.3
Table 2: Nutritional status of adolescent girls based on various anthropometric measurements.
Sl.no Anthropometric variable n (N) %
1. Height-for- age*
Normal (-2 to +2) 180 51.4
Stunted (-2 to -3) 118 33.7
Severely (<-3) 52 14.9
2. Weight- for-age**
Underweight (<3rd percentile) 52 14.9 Normal (3rd to 97th percentile) 298 85.1 Over weight (>97th percentile) 0 0
3. BMI- for-age***
Normal (+1 to -2) 249 71.1
Thin (-2 to-3) 58 16.6
Severe thinness(<-3) 30 8.6
Overweight(+1 to +2) 08 2.3
Obese (>+2) 05 1.4
4. Waist height ratio Normal (<0.5) 315 90
At risk of obesity (>0.5) 35 10
*Based on WHO height- for- age z scores growth chart; **According to KN Agarwal reference value; ***Based on WHO BMI- for- age z scores growth chart.
Table 3: Nutritional status according to socio demographic profile of rural adolescent girl.
Sl.no Demographic variables BMI for age *(N=350) P value
Normal Under-nutrition Over- Nutrition
1. Age 13-14 years 91 18 07 0.006
15-16 years 158 70 06
2. Religion Hindu 219 77 08 0.02
Muslim 30 11 05
3. Mother’s literacy status Illiterate 102 36 04 0.7
literate 147 52 09
4. Type of family Nuclear 191 76 09
0.1
Joint 58 12 04
5.
Socio-economic class (modified BG Prasad classification)
Class 2 08 04 00
0.9
Class 3 43 14 03
Class 4 107 37 05
Class 5 91 33 05
6. Type of diet
Vegetarian 77 37 06
0.01 Non vegetarian 84 16 06
Egg-tarian 88 35 01
7. Age at menarche
10-12 years 62 13 4
0.05
12-14 years 102 35 7
14-16 years 55 25 0
Not attained 30 15 2
Table 4: Calories and protein intake of adolescent girls according to their age.
Sl.no Nutrient intake Age group RDA Mean intake % of deficit RDA
1. Kilo calories 10-13 years 1970 961.56 ±288.63 51.1 14-16 years 2060 992.93±349.88 51.3
2. Protein 10-13 years 57 46.57 ±21.92 19.2
14-16 years 65 53.74±18.8 18.4
The Mean calorie intake of the adolescents girls per day was 992.93±290.41k cal and their mean protein was 53.4±19 grams which is much lower than recommended daily allowance (RDA) for adolescence as Indian Council of Medical Research (Table 4).13
DISCUSSION
adolescent age group in comparison with early adolescence. Similar results were found in Kumar study.10 Contradictory were finding by Joshi et al and Baliga et al.11,12 Thus emphasizes the need of improved nutrition in early adolescence to attain optimum growth and development.
The mean calorie and protein intake of the adolescents girls in rural area was found lower than ICMR recommendation. Study done Joshi et al in Bhopal district found low energy consumption is related to under -nourishment.11 Similar Low energy intake among adolescent girls is reported by is reported by Saibaba et al in Andhra Pradesh, Sinha & Singhin Lucknow and Joshi et al in Bhopal district.11-13 Likely reasons for very low intake reported in present study are most girls did not have breakfast and consumed lunch from school mid day meal programme. Also girls found it difficult to recall and accurately quantify what they consumed. The prevalence of under -nutrition was found higher among adolescent girls with vegetarian diet. Similar finding is reported by Ashok et al in Mysore district.14
The present study also found that 2.3% were over-weight, 1.4% were obese and 10% at risk of developing obesity by waist-height ratio. Baliga et al in Belgavi also similar prevalence of overweight (2%) also Study by Singh and et al found higher (16%) prevalence of risk of developing obesity (BMI >24.9).12,15 Thus this study throws light on both extremes of nutrition prevalent in rural areas and further research for identifying risk factors for emergence of obesity in rural areas.
The study findings thus call for measures to aid proper growth from early adolescent through interventions at schools and household level. Right type of nutrition and health education with dietary supplementation should be promoted.
Limitations
Since the study setting was schools, nutritional status non schools going rural adolescent girls were not assessed. School drop-out was not considered.
CONCLUSION
The study found that under nutrition is significantly prevalent among rural adolescent school girls and are deficit in their nutrient in-take. Middle adolescent and vegetarian diet has higher prevalence of under nutrition. There is need for create awareness and implement programmes regarding nutrition early in adolescence to achieve optimum growth and development.
ACKNOWLEDGEMENTS
The authors thank DDPI officer, Dharwad District, Karnataka, Principals of Schools and Class teachers of
respective classes for their support and student for cooperation and participation in study.
Funding: No funding sources Conflict of interest: None declared Ethical approval: Not required
REFERENCES
1. Chouhan SK, Chouhan R, Khan MA, Chouhan S. Programmatic perceptive of adolescent health in India. Int J Multidisciplinary Edu Res. 2017;2(2):87-93.
2. Sinha S, Singh RB. A study on diet and nutritional status among adolescent girls in Lucknow district, India Int J Community Med Public Health. 2016;3(8):2019-25.
3. Government of India Census Bureau population of State and Union Territories of India www.censusindia.gov.in; 2011.
4. Dietary Guidelines for Indians-A Manual..National Institute of Nutrition. Indian Council of Medical Research. 2nd edition. 2011: 104-108.
5. Hiremathand LD, Naglotimath DA. Essentials of Community Medicine- A practical Approach, Nutrition. 2nd edition. Jaypee Publishers; 2012: 201-213.
6. WHO- Weight- for –age. Available at: www.who.int. Accessed on 3 August 2017.
7. Agarwal DK. Physical and sexual growth pattern of affluent Indian children from 5 years of age. Indian Journal of Paediatrics 1992;29:1203-84.
8. WHO- BMI- for –age. Available at: www.who.int. Accessed on 3 August 2017.
9. Kuriyan R, Thomas T, Lokesh DP, Sheth NR, Mahendra A, Joy R, et al. Waist Circumference and Waist for Height Percentiles in Urban South Indian Children Aged 3-16 Years, Indian Pediatr. 2011;48:765-71.
10. Ashok Kumar T. Nutritional status of adolescent girls in Rural Tamil Nadu. Nat J Res Com. 2012;1(1):48-51.
11. Joshi SM, Likhar S, Agarwal SS, Mishra MK, Shukla U. A study of nutritional status of adolescent girls in rural area of Bhopal District. National J Community Med. 2014;5(2):191-4.
12. Sulakshana B & N Vijaya. Treatment seeking behaviour of rural adolescent girls–A community based cross-sectional study. Int J Med Public health. 2012;2(2):23-7.
13. Saibaba A, Ram MM, Rao GVR, Devi U, Syamala TS. Nutritional status of adolescent girls of urban slums and the impact of IEC on their nutritional knowledge and practices, Indian J Community Med. 2002;27(2):151-6.
15. Singh S, Kansal S, Kumar A. Assessment of nutritional status of adolescent girls in rural areas of district Varanasi. Indian J Res. 2012;6:30-4.
Cite this article as: Pavithran S, Bant DD.