Applicability of Multi-modal Public Transport System
Based on Accessibility Analysis
Yi Zhao
1, Jian Lu
1*, Hongtong Qiu
21 Jiangsu Key Laboratory of Urban ITS and Jiangsu Province Collaborative Innovation Center of Modern
Urban Traffic Technologies, Nanjing, China.
2 National Road Traffic Management Engineering Technology Research Center, China.
* Corresponding author. Tel.: 18061472553; email: [email protected] Manuscript submitted July 10, 2014; accepted January 8, 2015.
doi: 10.17706/ijcce.2015.4.3.211-218
Abstract: Public transport has a natural disadvantage in terms of speed, comfort and flexibility with respect to individual traffic. While the synergy of various public transport modes can be set to produce the best possible results of public transport system, which may bring superiority relate to individual traffic. Considering the characteristics of the bus speed, the transfer characteristics, this study explored the possibility of multi-modal public transport system to replace individual traffic and the differential application scopes of them from the stands of space accessibility and time accessibility. According to the conclusion, recommendations on public transport modes selection, layout and others are given to improve the effect of multi-modal public transport system.
Key words: Multi-modal public transport, accessibility, applicability.
1.
Introduction
The urban public transport system includes a variety of patterns such as normal buses, rail transit, the BRT, trams, taxi and so on. Each kind of traffic tools provides different services to passengers with different speeds, carrying capacity, prices and comfort levels. However, the single index service quality of each trip mode is not completely good [1], the single public transport mode is difficult to meet the residents' pursuit of travelling quality in future, and we must develop multi-model public transport system, give full play to the advantages of different public transport modes, making them supplement to each other. Only reasonable organized city public transport system can offer safe, quick, convenient, on-time, comfortable and economic transportation services to passengers, saving time as much as possible in social activities, meeting the needs of city production, social development and citizens' work and life.
2.
Multi-modal Public Transport System
With the development of urban economy and technology, various modes of urban public transport have become available apart from the traditional ground public transport system, such as BRT and rail transit, both with large volume, forming the urban public transport network in which multiple public transport ways coexist [2]. Multi-model public transport is a comprehensive system which covers various modes of public transport and it's the inevitable choice in order to adapt to urban development, and to meet the travel demand of citizens.
reduced by all kinds of public transport means, such as rail transit, bus, taxi, etc. Therefore it's not only an inevitable trend to provide diversified means of public transport networks, but also the only way out for big cities to further develop their public transport systems [3]. Development of multi-model public transport has following advantages: 1) can meet the demands of passenger flows of different levels; 2) forms transit oriented (TOD) development; 3) further improves urban competitiveness.
Based on the actual condition of traffic in big cities, it is difficult to limit development of individual traffic completely or substantially under current condition of resources and transportation [4]. Therefore the premise of transforming transport mode in big cities remains proper level of individual motorized travel modes. Meanwhile, multi-modal transport systems shall be enhanced to form a city transport mode led by multi-modal public transport connected excellently with slow-moving mode.
3.
The Basic Theories of Accessibility
The passengers' essential demand for the bus service level is hoping to get the accessibility of time and space at the same time, which is called the bus accessibility. Time accessibility is to ask for improving the running speed of public transport from the efficiency of service and shortening the time of bus trip, while space accessibility asks for increasing the coverage of bus routes and bus stations to conveniently obtain bus services.
3.1.
Space Accessibility
The multi-model public transport network system aims to replace cars as the dominant means of transportation by improving its flexibility and accessibility so that easy connection between different modes of transportation is possible.
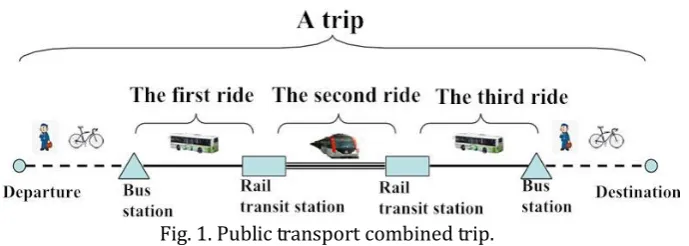
For a short-distance trip, one can travel by means of regular ground transportation, and for the distance between the starting place and bus stop, one can walk (within 500 meters )or ride a public bike(within 1 kilometer ) to get to the bus stop; the long-distance trip can be turned into the trip combination of various public transport modes [5]. As shown in 0 below, a complete complicated trip can involve a variety of modes such as the public bike (twice), ground public transport (twice) and rail transit (once). When the coverage of rail transit stations is high enough, public transport trip can be simplified as "walking"-"rail transit"-"walking". Therefore, it can be seen that, through construction of high-density public transport facilities, space accessibility of public transport can absolutely be improved.
Fig. 1. Public transport combined trip.
3.2.
Time Accessibility
For the same trip, when the time taken to fulfill the purpose of the trip through the combined modes of public transport is not more than the time taken through sedan cars, it is deemed that the time accessibility of public transport is better than that of sedan cars.
can be expressed as:
1 in city suburb speedway 0
in city suburb speedway
in city suburb speedway
T
T
T
T
T
L
L
L
V
V
V
(1)
Notes: T1 — the total time consumed by travelling by sedan; TIn City, LIn City , VIn City— the trip time, trip
distance and travel speed of the sedan car inside the city; Tsuburb , Lsuburb , Vsuburb-the trip time, trip distance
and travel speed of the sedan car in the suburbs; TSpeedway , LSpeedway , VSpeedway -the trip time, trip distance
and travel speed of the sedan car in the suburbs.
Considering the sedan car trip will be influenced by the extent of the road conditions and traffic congestions, it is significantly different in speed of sedan car travelling, depends on different road conditions [6]. So, in the formula (1), trip time of small cars can be divide into three parts combination, that is intra-city trip time Tin-city, suburban trip time Tthe suburb , the speedway trip time T speedway. In-city, suburb and speedway
represent the differences of these three road situations.
If take the multi-model public transport to replace the sedan car, on the basis of perfect multi-model urban public transport system, the single trip time of public transport can be expressed as follows:
1 2 3 4 5
2
Slow Tra
Nor Bus
BRT
Urban Track
Intercity RailN N N N N
T
T
T
T
T
T
(2)Note: T2— The total time consumed by multi-model bus trip; TSlow Tra— Time consumed by slow traffic; T Nor bus— Time consumed by normal bus trip; TBRT— the time of bus rapid transit; TUrban Track— spending
time of the urban track; TIntercity Rail— the time of the intercity rails; N1, N2, N3, N4, N5, respectively, represent
the times of being used in a multi-model bus trip by slow-speed buses, normal buses, rapid buses, the urban track and intercity rail transit.
In formula (2), it considers the most common trip modes such as slow transports (walk, non-motorized vehicle, etc.), regular public transport, rapid public transport and rail transport (urban rail and inter-city rail) in urban public transport travelling, N1, N2, N3, N4, N5 represent the use times of some public transport
travelling tools during a single travelling. Under the condition of the mature development of multi-model public transport system, it can be assumed as following: N1=0, 1, 2, which means 2 times slow moving parts
exist mostly, and they exist in the starting and end point of the trip respectively. The value range of N2, N3, N4,
N5 is 0, 1, 2, which indicates a public transport mode cannot be used for more than two times during a single
trip; meanwhile, N2+N3+N4≦4 indicates that in one single trip, besides slow moving and intercity rail transit
section, there are 4 times transformation. And if it transfers 4 times, it must be 1 time trans-line of transfer in the intercity rail transit; when N5=0 or 1, it indicates that under the multi-model public transport, one trip
uses the intercity rail once at most.
Meantime, the time spent T for each transport mode in formula (2) is composed of two parts: trip time in the sedan car t trip and the waiting time t wait.
Trip
Driving Waiting Waiting Trip
=
L
+
T t
t
t
V
Note: T— trip time of one kind of public transport mode; tDriving— time consumption in the process of
driving; t Waiting — time consumption in waiting for a bus or train; LTrip — mileage of travelling; V Trip—
public transport travel speed.
4.
Accessibility Advantage Analysis
Analysis of the above trip time based on the background of rush hours in the morning and evenings is as following. Among which, the waiting time of slow traffic is 0; The average waiting time of regular public transport and that of rapid public transport are impacted by the vehicle departure frequency, supposing the departure frequency of regular public transport and that of rapid public transport are respectively 4 min and 5 min, then the average waiting time of regular public transport and that of rapid public transport will be respectively 2 min and 2.5 min; The waiting time of urban rail transport includes the walking time after transfer and vehicle waiting time. Supposing the transfer walking time is 5 min, and the average vehicle waiting time is 1.5 min (the subway frequency is 3 min); Assuming the average waiting time of intercity rail transit (including rail motor coach) is 15minutes.
The trip time depends on the travelling speed of different trip modes; currently our country's high speed rail has a maximum speed of 300 km/h, and bullet train has a maximum speed of 250km/h, so it can be assumed that the average travelling speed of intercity rails is 180km/h; the average speed of the urban subway is over 40km per hour, and the max speed will reach to 80km per hour, so the average speed in the city rail can be assumed as 35km/h; the speed of bus rapid transit is 15~25 km per hour, and if it is designed reasonably and controlled effectively, the general speed can reach over 25km per hour, so we can assume the average speed of bus rapid transit is 25km/h; normal bus runs 10~ 18 km per hour, so the hypothesis of the average speed is 15km/h [7].
The purpose of slow-moving traffic is to access other public transport means, assuming to access the public transport facilities within 5 min maximum (500m) under mature environment of multi-modal public transport, which is of average slow-moving speed 2.5 min. The actual velocity of sedan cars in cities is about 18~30 km per hour, assume the average velocity of which in peak-hour as 20km/h. The average velocity in suburb or elevated roads is 40~50km per hour, assume the value as 40km/h. The velocity in highways is no more than 120km/h; assume the actual velocity as 100km/h.
This paper makes detailed comparative analysis from two aspects about the accessibility of trip modes. One is the time accessibility of single public transport trip and sedan car, and the other aspect is the time accessibility of multi-modal public transport trip and sedan car.
4.1.
The Time Accessibility of Single Bus Trip and Sedan Car Trip
As shown in Table 1, when sedan car trip can be achieved by the way of single public transport and the average speed of the sedan car is 20km/h due to the influence of signal control and traffic jam in the city, and the distance of single trip is over 4.17km, the time accessibility of bus rapid transit is better than sedan car trip. When trip distance is over 5.04km, urban rail transit will be better than sedan car trip [8]. However, when the road condition is good and the average speed of the sedan car is high, even urban rail transit and bus rapid transit struggle to compete with sedan car.
4.2.
Time Accessibility of Multi-model Public Transport and Car Transportation
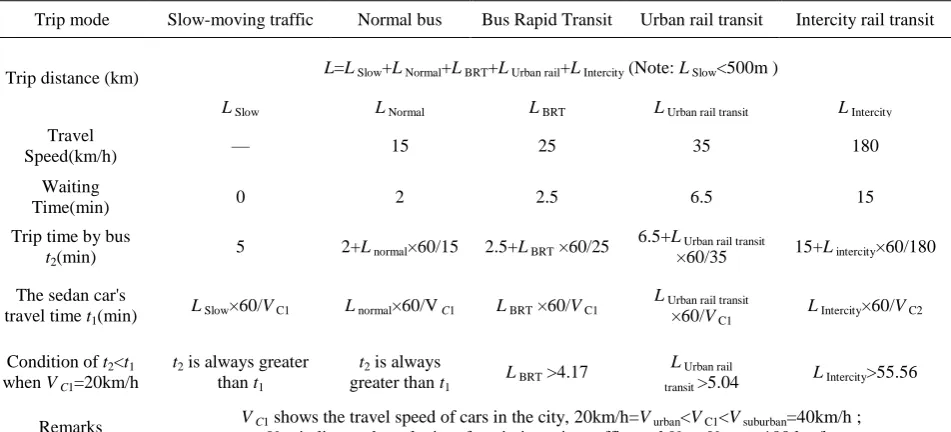
Table 1. Single Public Transport Mode Compared with the Time Accessibility of Sedan Cars Trip mode Slow-moving traffic Normal bus Bus Rapid Transit Urban rail transit Intercity rail transit
Trip distance (km) L=L Slow+L Normal+L BRT+L Urban rail+L Intercity (Note: L Slow<500m )
L Slow L Normal L BRT L Urban rail transit L Intercity
Travel
Speed(km/h) — 15 25 35 180
Waiting
Time(min) 0 2 2.5 6.5 15
Trip time by bus
t2(min)
5 2+L normal×60/15 2.5+L BRT ×60/25
6.5+L Urban rail transit
×60/35 15+L intercity×60/180
The sedan car's travel time t1(min)
L Slow×60/V C1 L normal×60/VC1 L BRT ×60/V C1
L Urban rail transit ×60/V C1
L Intercity×60/V C2
Condition of t2<t1 when VC1=20km/h
t2 is always greater than t1
t2 is always greater than t1
L BRT >4.17
L Urban rail
transit >5.04
L Intercity>55.56
Remarks VC1 shows the travel speed of cars in the city, 20km/h=V urban<V C1<V suburban=40km/h ;
VC2 indicates the velocity of car in intercity traffic, and VC2=V BRT d=100 km/h.
Table 2. Comparison between the Time Accessibility of Multi-model Public Transport and Sedan Cars
Tr
an
sf
er
tim
es Multi-model Trip vs. Car Trip
Non-motorized Traffic Normal Bus Bus Rapid Transit Urban
track Intercity Rail The condition of t2<t1 (V C1=20km/h )
L slow L normal LBRT L Urban track L Intercity
1 C o m b in at io n 1
Selection of modes 2 1 1
L normal <0.6×L BRT -6.5;
L BRT>10.8 Trip time of bus t2
(min) 5+(2+L normal×60/15)+(2.5+LBRT×60/25)=9.5+4×L normal+12/5×L BRT The car's travel time
t1(min)
(1+L normal +LBRT) ×60/V C1
C o m b in at io n 2
Selection of modes 2 1 1
L Normal <1.29×L Urban track -10.5;
L Urban track >8.14 Trip time of bus t2
(min) 5+(2+L normal×60/15)+(6.5+L Urban track×60/35)=13.5+4×L normal+12/7×LUrban track The car's trip time
t1(min)
(1+L normal +L Urban track)×60/V C1
C o m b in at io n 3
Selection of modes 2 1 1
11<0.6L BRT + 1.29L Urban track
Trip time of bus t2
(min) 5+(2.5+LBRT×60/25)+(6.5+L Urban track ×60/35)=14+12/5×LBRT+12/7×L Urban track The car's trip time
t1(min) (1+L BRT +L Urban track ) ×60/V C1
2 C o m b in at io n 1
Selection of modes 2 2 1
L Normal<0.6×L BRT-8.5;
L BRT>14.17 Trip time of bus t2
(min) 5+(2×2 +L normal×60/15) + (2.5+LBRT×60/25)=11.5+4×L normal+12/5×LBRT The car's trip time
t1(min)
(1+L normal +L BRT ) ×60/V C1
C o m b in at io n 2
Selection of modes 2 2 1
L Normal<1.29×L Urban track -12.5;
L city rail>9.69 Trip time of bus t2
(min) 5+(2×2+L normal×60/15)+(6.5+L Urban track ×60/35)=15.5+4×L normal +12/7×LUrban track The car's trip time
t1(min) (1+L normal +L Urban track ) ×60/V C1
C o m b in at io n 3
Selection of modes 2 1 2
L normal<0.6×LBRT-9;
L BRT>15 Trip time of bus t2
(min) 5+(2+L Normal×60/15)+(2×2.5+L BRT×60/25)=12+4×L Normal+12/5×LBRT The car's trip time
t1(min) (1+L normal +L BRT ) ×60/V C1
C o m b in at io n 4
Selection of modes 2 1 2
L Normal<1.29×L Urban track -17;
LUrban track >13.18 Trip time of bus t2
The car's trip time
t1(min) (1+L normal +L intra-urban track ) ×60/V C1
C
o
m
b
in
at
io
n
5
Selection of modes 2 1 1 1
L normal<0.4×LBRT+1.29×L Urban track -13 Trip time of bus t2
(min) 16+4×L Normal+12/5×L BRT+12/7×L Urban track
The car's trip time
t1(min) (1+Lnormal+L BRT+L Urban track) ×60/V C1
In Table 2, the multi-model bus trip which needs only one-time transfer (using 2 types of public transport modes, non-motorized traffic mode not include) and the multi-model bus trip which needs two-time transfer were compared with the trip behavior of the sedan car, the result is as follows:
Under multi-model public transport system, the regulation of frequency of single travel transference can be realized by the appropriate distribution of rail transit, bus rapid transit, normal bus transit and so on. It can be regarded that 2 times of transfer can meet the needs of one trip, while transference over 2 times is not considered in discussion scope.
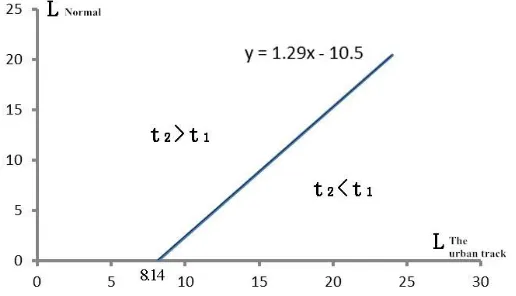
The multi-model public transport travelling of 1 time transfer analyzes such three different modes of combined activities as normal public transport combined with bus rapid transit, normal public transport combined with urban track, and bus rapid transit combined with urban track. In the case of the sedan car's speed staying at 20 km/h, if a certain condition of the multi-model public transport is met, the time accessibility of it will be better than the sedan car. In the case of normal public transport and urban track transport are adopted for travelling, as shown in Table 2, when the normal public transport distance
L-normal and the urban track distance L-urban are locating at the right side of the straight line
Fig. 2. Comparison between the time accessibility of the multi-model public transport trip (by normal bus and urban track) and the sedan car trip.
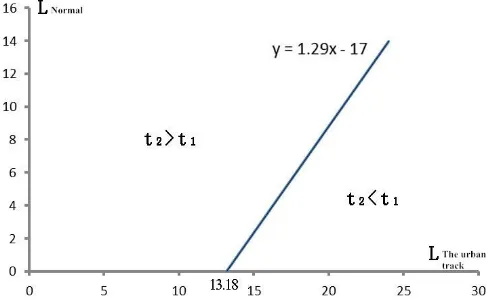
The multi-model public transport travelling of 2-time transfer analyzes such five different modes of combined activities as 2 times of normal public transport combined with 1 time of bus rapid transit, 2 times of normal public transport combined with 1 time of urban track, 1 time of normal public transport combined with 2 times of bus rapid transit, 1 time of normal public transport combined with 2 times of urban track, and 1 time of normal public transport combined with 1 time of bus rapid transit and 1 time urban track. Likewise, when the trip distance in different trip modes meets certain condition, the time accessibility of the multi-model bus trip will be better than car trip. Taking the one-time normal bus combined with two-time
line (y=1.29x-17), t2 of the trip time of multi-model bus will be less than the t1 of the trip time of cars. See Fig.
3.
(y=1.29x-10.5), the trip time of multi-model public transportt2will be less than the car t1, as seen in Fig. 2.
For the above-mentioned transfer behavior, the intercity rail transit is not considered altogether, as it is known from Table 1, when the intercity distance is more than 55.56 km, for the trip of the same distance, the time taken by means of the intercity rail transit will be far less than the car mode. The time saved by the intercity rail transit can make up the partial delay by the multi-model public transport trip within the city, which further improves the competitiveness of the multi-model public transport in intercity trips compared with the car trip.
5.
Conclusion and Suggestion
5.1.
Conclusion
And the sedan car trip is easily influenced by the surrounding environment, for example, when traffic jams happen on the city roads, the sedan car trip can cause quite a long delay which is hard to estimate. In terms of the stability of the time accessibility, public transport is much better than that of the sedan car trip.
5.2.
Suggestion
Construction of the multi-model public transport involves a variety of public transport means such as track transit, bus rapid transit, and normal road transit. Only through the coordination of different transportation means, the advantage of the multi-model public transport can be fully displayed. For effectively optimize the connection between different modes, guarantee the development of the multi-model public transport can be provided from the following aspects: 1) forecast planning; 2) effective institutions and management; 3) policy, fund and land guarantee; 4) Public transport information construction, public transport priority and public transfer guarantee.
References
[1] Borne, P., Fayech, B., Hammadi, S., & Maouche, S. (1993). Decision support system for urban transportation network. IEEE TSMC, Part C, 1, 67-77.
[2] Illsley, N., Holmes, K., Gibbard, C., & Drummond, P. (2007). Transport Direct Electronic Transfer of Bus Service Data Briefing Note (pp. 58-79). Version 1.0.
Fig. 3. Multi-model bus trip (1 time normal bus and 2 times intra-urban track) compares with the time accessibility of the car.
[3] Geurs, K. T., & Ritsema van Eck, J. R. (2008). Accessibility Measures: Review and Applications. RIVM Report 408505 006, National Institute of Public Health and the Environment.
[4] Cebollada, A. (2009). Mobility and labour market exclusion in the arcelona metropolitan region. J. of Transport Geogr., 17(3), 226-233.
[5] Steinfeld, A., et al. (2010). The value and acceptance of citizen science to promote transit accessibility. J. Technology and Disability, 22, 73-81.
[6] Latora, V., & Marchiori, M. (2011, Feb.). Efficient behavior of small-world networks. Physical Review letters, 19, 1-4.
[7] Vanderbulcke, G., Steenberghen, T., & Thomas, I. (2009). Mapping accessibility in Belgium: A tool for land-use and transport planning? J. of Transport Geogr., 17(1), 39-53.
[8] Fojtík, D., Ivan, I., & Horák, J. (2011). Database of public transport connections — Its creation and use.
Proceedings of the 12th International Carpathian Control Conference (pp. 115-119).
Yi Zhao was born in Anhui Province, China, in 1989. He received the B.S. degree from Hefei University of Technology, Hefei, in 2010, and received the M.S. degree from Southeast University, Nanjing, in 2013, both majoring in transportation engineering. He is currently pursuing the Ph.D. degree with the School of Transportation, Southeast University. His research interests include transportation management demand, traffic flow theory, traffic safety and ITS.
Jian Lu was born in 1972, China. He received his B.S. degree, M.S. degree and Ph.D. degree from Southeast University, Nanjing, in 1995, 1998 and 2003, respectively. He is the associate dean, professor and doctoral tutor of the School of Transportation in Southeast University. He is the young academic leader of Jiangsu Province. He has elected to join the "New Century Excellent Talents" Support Plan of Ministry of Education, and "333 high-level talent project" of Jiangsu Province. His research interests include traffic management, transport planning, traffic safety and intelligent transportation systems and so on.