Copyright © The Author(s). All Rights Reserved. Published by American Research Institute for Policy Development DOI: 10.15640/ijhs.v6n3a1 URL:https://doi.org/10.15640/ijhs.v6n3a1
On The Health and Wealth of Nations
Kyle Murphy
1& Doug Dix
2Abstract
From the Human Development Report of 2014, we calculated the product of infant mortality rate, under-five mortality rate, female adult mortality rate, and male adult mortality rate as a new measure of national health, the total mortality rate or TMR, and the ratio of per capita health spending in purchasing power parity to inequality in life expectancy as a new measure of national health, the health spending per health inequality or Health/c/IneqLE. Of the 172 nations reporting sufficient data to evaluate these parameters, 52 were healthy (TMR < 1 billion). All healthy nations were rich (Health/c/IneqLE> 101). Of the 120 sick nations (TMR > 1 billion), 108 were poor (Health/c/IneqLE< 102). We conclude that Health/c/IneqLE> 101 is a necessary condition for national health. Twelve nations were rich but sick. None of these twelve had Health/c/IneqLE> 186. All nations with Health/c/IneqLE> 194 were healthy. We conclude that Health/c/IneqLE> 194 is a sufficient condition for national health. We recommend that efforts to improve human development be directed at increasing Health/c or decreasing IneqLE. Efforts to increase Health/c should increase per capita health spending and/or diminish population growth. Efforts to decrease IneqLE should enhance primary health care for the poor.
Key words: Health, Wealth, Nations, Inequality Introduction
Human development is the process of improving wellbeing. The Human Development Index (HDI) was created to summarize human development within a nation. It combines equally measures of health, education, and wealth (1). The HDI has some utility, but also some flaws. First among these is the fact that wellbeing is essentially synonymous with health. Education and wealth are of secondary importance, valuable only as means to health. By combining the three parameters equally, the HDI dilutes and distorts the role of health in human development. Second, the HDI underestimates the difference in human development between nations.
In the 2014 Human Development Report, for instance, HDI varied from a low of 0.337 for Niger to a high of 0.944 for Norway (2). This implies that human development in Niger is 35.7% of what it is in Norway. We suggest this vastly understates the difference in wellness between these two countries. Finally, the division of all nations into four approximately equal groups designated “very high human development” for those with HDI >0.807, and “high human development” for those with HDI between0.699 and 0.807, and “medium human development” for those with HDI between 0.556 and 0.699, and low human development for those with HDI <0.541 is artificial and deceptive.
The most developed nations exhibit infant and child mortality rates and maternal mortality ratios that are less than 2%, and adult mortality rates that are less than 12%, of those in the least developed nations. These mortality statistics portray a larger difference in human development than does the HDI. And the mortality statistics give an undiluted, undistorted, and undeniable view of a nation’s health.
1 Department of Health Science and Nursing, University of Hartford, 200 Bloomfield Avenue, West Hartford, CT 06117
Mortality rate is the most fundamental measure of national health, and nations typically report four different mortality rates: Infant (probability of dying between birth and first birthday/1000 births = IMR), under-five (probability of dying between birth and fifth birthday/1000 births = U5MR), adult female (probability of a female dying between 15th and 60th birthdays/1000 females = AMR-F), and adult male (probability of a male dying between
15th and 60th birthdays/1000 males = AMR-M). For each reporting nation, we calculated the product of the four rates
to form an approximation to total mortality rate (TMR). The TMR is an estimate of the probability of dying between birth and the 60th birthday/trillion people.
It is the purpose of this paper to list the nations according to this new measure of health, to dichotomize the listed nations as healthy or sick, and to compare the healthy and sick nations according to measures of wealth (gross domestic product per capita in purchasing power parity = GDP/c), health spending per capita in purchasing power parity (Health/c), and inequality in life expectancy as a percentage of expected (IneqLE) (2). For reference, we compare the above rankings with rankings by maternal mortality ratio (Maternal MR = deaths from pregnancy/100,000 live births), adolescent birth rate (Adol Births = number of births between ages 15 and 19/1000 females between ages 15 and 19) and HDI. We also created a new measure of national wealth, thehealth spending per capita relative to health inequality by calculating the ratio Health/c/IneqLE. We demonstrate the brilliant utility of this new measure.
Methods
In the 2014 Human Development Report (2), 187 nations reported HDI and other data. Fifteen of these nations, Lichtenstein, Andora, Hong Kong, Palestine, Zimbabwe, Cuba, Libya, Oman, Myanmar, Syria, Djibouti, Argentina, Dominica, Saint Kitts & Nevis, and Palau reported insufficient data to calculate TMR and/or Health/c/IneqLE, and were not consider further. For the remaining 172 nations, TMR and Health/c/IneqLE were calculated and analyzed as described above. Antigua & Barbuda, Seychelles, and Kiribati were included in this analysis, although these nations did not report maternal mortality ratios. All other data utilized in this analysis are from the 2014 Human Development Report (2).
Results
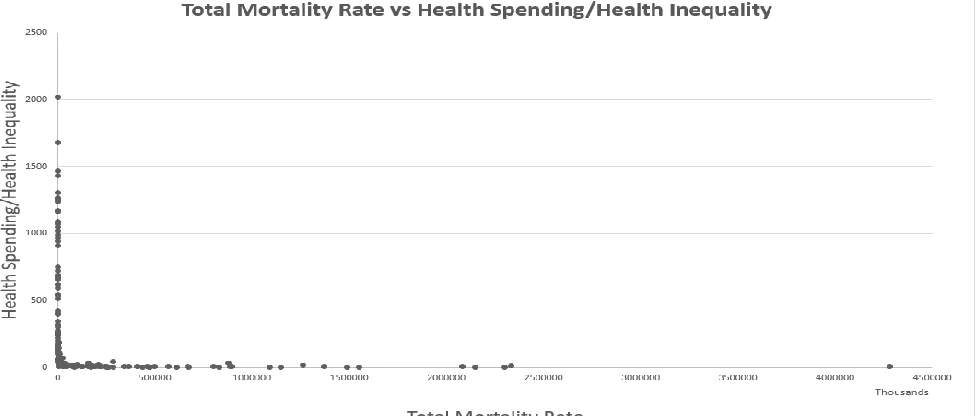
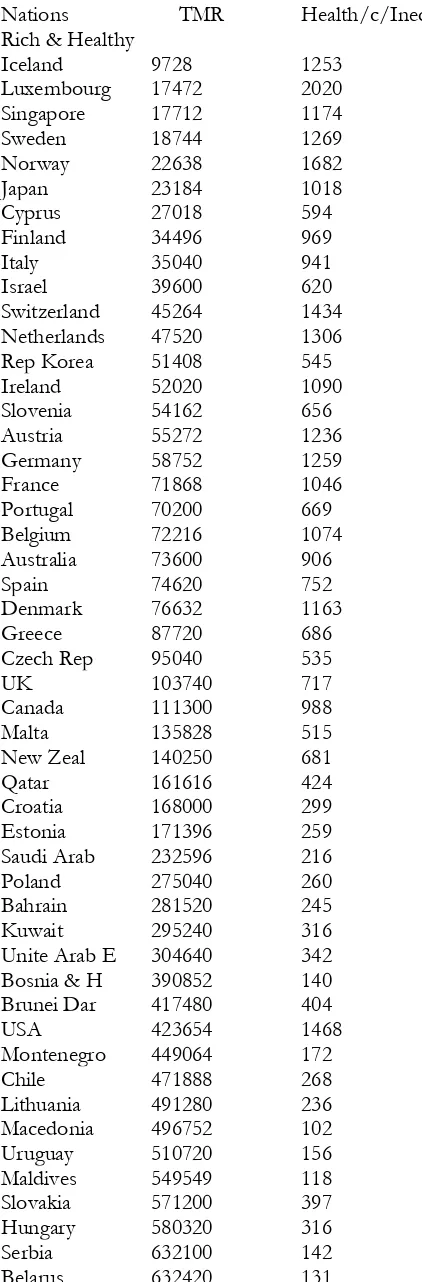
Table 1 lists the 172 nations studied with values for TMR and Health/c/IneqLE. Iceland has the lowest TMR at 9,728, and Sierra Leone the highest at 4,280,988,348.We defined healthy nations as those with TMR < 1 billion deaths/trillion people. Of the 172 nations studied, 52 are healthy by this definition. Of these 52 healthy nations, all are defined as rich because they have Health/c/IneqLEequal to or greater than 102. The remaining 120 nations are sick.Of these sick nations, 108 are defined as poor because they have Health/c/IneqLE< 102. Twelve sick nations are rich because they have Health/c/IneqLE> 102. But none of these rich & sick nations have Health/c/IneqLE> 186. Figure 1 describes the relationship between TMR and Health/c/IneqLE.
Table 1: Nations Ranked by TMR and Health/c/IneqLE
Nations TMR Health/c/IneqLE Rich & Healthy
Iceland 9728 1253
Luxembourg 17472 2020
Singapore 17712 1174
Sweden 18744 1269
Norway 22638 1682
Japan 23184 1018
Cyprus 27018 594
Finland 34496 969
Italy 35040 941
Israel 39600 620
Switzerland 45264 1434
Netherlands 47520 1306
Rep Korea 51408 545
Ireland 52020 1090
Slovenia 54162 656
Austria 55272 1236
Germany 58752 1259
France 71868 1046
Portugal 70200 669
Belgium 72216 1074
Australia 73600 906
Spain 74620 752
Denmark 76632 1163
Greece 87720 686
Czech Rep 95040 535
UK 103740 717
Canada 111300 988
Malta 135828 515
New Zeal 140250 681
Qatar 161616 424
Croatia 168000 299
Estonia 171396 259
Saudi Arab 232596 216
Poland 275040 260
Bahrain 281520 245
Kuwait 295240 316
Unite Arab E 304640 342 Bosnia & H 390852 140
Brunei Dar 417480 404
USA 423654 1468
Montenegro 449064 172
Chile 471888 268
Lithuania 491280 236
Macedonia 496752 102
Uruguay 510720 156
Maldives 549549 118
Slovakia 571200 397
Hungary 580320 316
Serbia 632100 142
Costa Rica 677160 195
Malaysia 986580 161
Poor & Sick
Sri Lanka 1176560 36
China 1524096 57
Tunisia 2161152 62
Albania 2728755 59
Peru 2788884 40
Thailand 3019302 57
Columbia 3160080 53
Venezuela 3474900 75
Iran 3534300 74
Brazil 3676400 88
Grenada 3682448 87
Ukraine 3682800 58
Mexico 3766560 92
Algeria 4182000 30
Tonga 4256538 20
St. Lucia 4276800 74
Jordan 4394016 80
Egypt 4530330 39
Jamaica 4608632 24
Viet Nam 4610304 28
Samoa 5017950 26
Armenia 5143680 25
Vanuatu 5243940 7.8
Ecuador 6632280 54
Paraguay 7136096 36
Georgia 7191360 51
Moldova 7916670 43
Honduras 8120334 22
Belize 8406720 42
Surinam 8592066 59
Trinidad & T 8727264 101 El Salvador 9088128 35 St. Vin & G 9775920 39
Morocco 10503513 25
Cape Verde 11581526 25
Nicaragua 12235104 33
Dom Rep 15164820 35
Fiji 15604776 23
Azerbaijan 16239375 38 Kazakhstan 16545352 50
Iraq 22859424 69
Kyrgyzstan 24406920 9.3 Philippines 25251840 16
Solomon 25758954 7.8
Indonesia 26759200 15
Mongolia 29252412 26
Bangladesh 29993304 4.4 Micronesia 32526936 23
Guatemala 37765440 27
Uzbekistan 38237760 11
Bolivia 49560390 11
Bhutan 53411400 14
Namibia 74522448 14
Cambodia 77792000 6.3
Tajikistan 79803360 4.6 Madagascar 84587838 2.3 Sao To & P 89071164 8.1
India 96768672 7.9
Guyana 99248730 19
Yemen 119480400 7.3
Lao 130076928 5.9
Kiribati 153897600 8.7
Botswana 155669374 34
Timor-Leste 158731776 4.1 Pakistan 167766048 3.6
Eritrea 172915652 1.3
Turkmen 179769375 13
Senegal 189072900 4.4
Ghana 192925152 5.7
Gabon 207799200 21
Rwanda 214723080 4.9
Sudan 215564328 8.6
Papua 221719680 3.8
Tanzania 239850072 4
Haiti 249237288 4.4
Gambia 250085955 2
Ethiopia 259163640 1.9
Comoros 284898900 2.3
South Afri 286483230 40 Mauritania 341610360 4.3
Kenya 363866748 3
Liberia 405938400 4.6
Malawi 435187968 1.6
Uganda 462117150 3.8
Benin 467386200 2.1
Burkina Fas 473448096 2.4 Afghanistan 497688345 5.2
Congo 567130368 3.9
Niger 609493248 1.2
Togo 668808384 2.8
Guinea 671678280 1.8
Zambia 800440368 4.9
Burundi 827589360 1.5
Eq Guinea 879400800 34 Cot d'Ivoire 885479040 4.7 Cameroon 894632100 3.4 Mozambique 1090890990 1.6
Mali 1148682240 2.4
Swaziland 1259919360 14 Nigeria 1368394560 7.1 Guinea-Bis 1489609440 1.6
Chad 1548640050 1.9
Angola 2079077200 5.6
Lesotho 2333982200 9 Sierra Leone 4280988348 5.8
Rich & Sick
Lebanon 1054944 155
Turkey 1405152 111
Latvia 1518696 173
Russia 1780290 147
Bulgaria 2202288 145
Romania 2317392 114
Barbados 2613240 145
Antigua & B 2996280 145
Seychelles 3177460 111
Panama 3689344 113
Mauritius 3812640 104
Bahamas 5245520 186
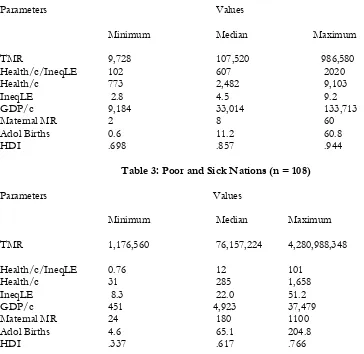
Tables 2 – 4 describe some characteristics of these groups of nations. Notice the clean break between the rich & healthy group and the poor & sick group in both TMR and Health/c/IneqLE. Notice also the overlap in the ranges of values for the other parameters between the three groups of nations.
Although GDP/c varies enormously over the 172 nations studied, from $451 for Democratic Republic of Congo to $133,713 for Qatar, a 294-fold difference, health spending as a percentage of GDP/c is remarkably constant, varying from 1.9% for Qatar to 19.5% for Liberia with a median of 6.3%.
Table 2: Rich and Healthy Nations (n = 52)
Parameters Values
Minimum Median Maximum
TMR 9,728 107,520 986,580
Health/c/IneqLE 102 607 2020
Health/c 773 2,482 9,103
IneqLE 2.8 4.5 9.2
GDP/c 9,184 33,014 133,713
Maternal MR 2 8 60
Adol Births 0.6 11.2 60.8
HDI .698 .857 .944
Table 3: Poor and Sick Nations (n = 108)
Parameters Values
Minimum Median Maximum
TMR 1,176,560 76,157,224 4,280,988,348
Health/c/IneqLE 0.76 12 101
Health/c 31 285 1,658
IneqLE 8.3 22.0 51.2
GDP/c 451 4,923 37,479
Maternal MR 24 180 1100
Adol Births 4.6 65.1 204.8
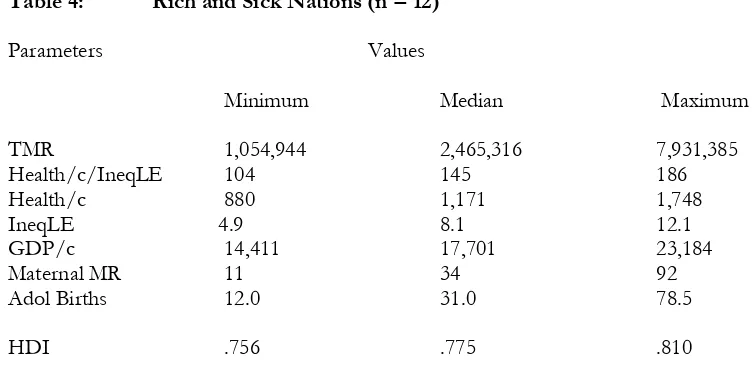
Table 4: Rich and Sick Nations (n = 12)
Parameters Values
Minimum Median Maximum
TMR 1,054,944 2,465,316 7,931,385
Health/c/IneqLE 104 145 186
Health/c 880 1,171 1,748
IneqLE 4.9 8.1 12.1
GDP/c 14,411 17,701 23,184
Maternal MR 11 34 92
Adol Births 12.0 31.0 78.5
HDI .756 .775 .810
Discussion
Bloom and Canning described the loose, approximately linear relationship between a nation’s life expectancy at birth and the log of that nation’s per capita income (3). They discussed how causality might flow in both directions. Health fosters wealth, and vice versa.
We created a new measure of national health, the TMR, and a new measure of national wealth, the health spending per capita relative to the health inequality, or Health/c/IneqLE. The relationship between these two parameters is rectangular (Figure 1). Because none of the 108 nations with Health/c/IneqLE less than 102 are healthy, i.e., have a TMR less than 1 billion, we suspectHealth/c/IneqLE = 102 to be a necessary condition for national health.
Because all 52 nations with Health/c/IneqLE equal to, or greater than, 195 are healthy, i.e., have TMR less than 1 billion, we suspect Health/c/IneqLE = 195 to be a sufficient condition for national health. Nations with Health/c/IneqLE between 102 and 186 may be healthy or sick. Of the 20 nations with Health/c/IneqLEwithin this range, eight are healthy and 12 are sick.
The other parameters of health (maternal mortality ratio, adolescent birth rate, and health inequality) and wealth (Health/c, and GDP/c) show a correlation between median values of health and wealth. The wealthy nations have lower maternal mortality ratio, adolescent birth rate, and health inequality than the poor nations. But there is substantial overlap between the ranges of values between the rich & healthy, poor & sick, and rich & sick groups of nations. The wealthy nations have higher median HDI than the poor nations, but, again, with substantial overlap between ranges (Tables 2 – 4).
In conclusion, we offer TMR and Health/c/IneqLE as accurate measures of national health and wealth, respectively. We recommend that efforts to improve human development be directed at increasing Health/c and/or decreasing IneqLE. Because all nations spend approximately the same percentage of GDP/c on health, increasing GDP/c by increasing GDP and/or reducing population growth should increase Health/c. Improving primary health care for the poor, as recommended by the Alma Atta Declaration (4), should decrease IneqLE.
References
1. United Nations Development Programme, Human Development Report 2016 2. United Nations Development Programme, Human Development Report 2014