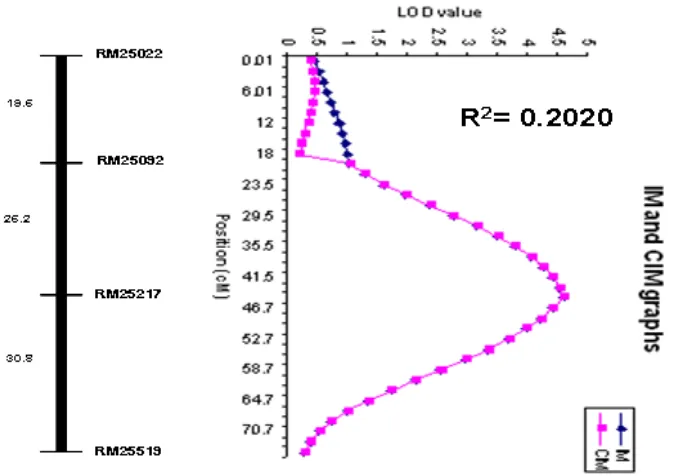
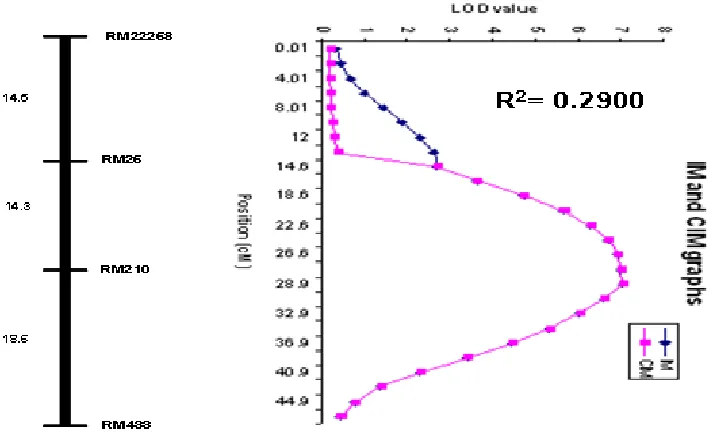
QTL MAPPING FOR SALINITY TOLERANCE AT SEEDLING STAGE IN RICE
Full text
Figure
Related documents
Proxy Server Proxy Server WBC Client WBC Client Proxy Server Proxy Server Proxy Server Proxy Server WBC Client WBC Client Proxy Server Proxy Server Lustre Storage Cluster
o Dating, Social Networking, Voice & Chat, Food & Drink, Health & Fitness, Travel, Retail, Education, Entertainment..
Determination of sugar and Sucrose were carried out by polarization method, and moisture content determination was carried out using hot air oven method .Result
See hermeneutic dialectics HD
In this study, the selection of the best (optimum) forming condition in the stamping process of titanium bipolar plate was performed using TOPSIS and VIKOR
On the other hand, number of colonies formed by BSB8-RR cells with tumor antigen knockout was slightly reduced compared to the control cells (compare lane 3 with 4), but it
Based on 143 h of ethnographic observations in the maternity unit, 12 semi-structured interviews, and two focus groups with staff, we identified six mechanisms that appeared to
The chamber and committee rooms also require an efficient audio, video recording facility and real-time transcribing service in order to provide the Hansard reports.. The
