THE IN EL UENCE OF SO D IU M DODECYL SULPHA I E
ON THE DISSOLUTION O F HYDROPH OBIC DRUGS
by
SU K M IN D ER MALL
B.Pharm., M R. Pharm.S.
The School of Pharmacy,
University of London.
March, 1996.
Thesis submitted for the degree of Doctor of Philosophy in the
ProQuest Number: 10104845
All rights reserved
INFORMATION TO ALL USERS
The quality of this reproduction is dependent upon the quality of the copy submitted.
In the unlikely event that the author did not send a complete manuscript and there are missing pages, these will be noted. Also, if material had to be removed,
a note will indicate the deletion.
uest.
ProQuest 10104845
Published by ProQuest LLC(2016). Copyright of the Dissertation is held by the Author.
All rights reserved.
This work is protected against unauthorized copying under Title 17, United States Code. Microform Edition © ProQuest LLC.
ProQuest LLC
789 East Eisenhower Parkway P.O. Box 1346
ABSTRACT.
The purpose of this study was to investigate the influence of the anionic surfactant,
sodium dodecyl sulphate, on the dissolution of hydrophobic drugs.
The surface energy of each drug studied was considered in terms of a Lifshitz-van der
Waals contribution and a polar contribution which was divided into electron donor and
electron acceptor parameters. These data were obtained from contact angle experiments,
using an automated Wilhelmy plate technique. The surface energy data for the solids were
used along with surface energy terms for the head groups and the hydrophobic tails of the
micelle to give a free energy of adhesion to each region of the micelle for each of the
drugs.
The solubilities of these drugs were considered in both water and aqueous micellar sodium
dodecyl sulphate solutions, as a function of temperature, and also by considering parallel
experiments in which the pH was buffered at the pK^ of the drug.
A Taylor-Aris diffusion technique was also used to provide a direct measurement of
partition between a buffered aqueous phase and the micelles, again as a function of
temperature. The thermodynamics of transfer were calculated for each experimental
procedure by use of the van't Hoff isochore.
The initial rotating disk dissolution rate of drug compacts was measured in water and
water with SDS micelles at a range of temperatures. The thermodynamic parameters of
activation were calculated from the rate data.
Correlations were obtained between the measured solubilities, partitioning and dissolution
data and the free energy of adhesion obtained from surface energy data. These properties
were found to be strongly influenced by a polar repulsion energy between the monopolar
surfactant head group.
This work provides an insight into a possible mechanism of solubilisation, using the Lewis
ACKNOWLEDGEMENTS.
Thanks must go firstly to my supervisor, Graham Buckton for his constant advice and
encouragement during this work and whose enthusiasm for the subject was always very
motivating.
Many people in the School of Pharmacy have helped me during this work to whom I am
very grateful, particularly the technical staff in the pharmaceutics department. Special
thanks must go to Brian Bissenden for his continual guidance in constructing and
maintaining much of the equipment used for this work.
Thanks are also due to my industrial supervisors, initially David Storey and then David
Rawlins for their advice and interest over this period of research. Financial support from
the School of Pharmacy and M.S .D. is greatly appreciated.
I also wish to thank my fhends at the School of Pharmacy for making the past three years
very enjoyable, especially David Carthew for his help with computers and also his valued
friendship. Thanks must also go to my family for their interest in this work.
Finally, I would like to thank Keith for his encouragement, support and patience
TABLE OF CONTENTS
Abstract
Pag
2
Acknowledgements 3
List of Figures 15
List of Tables 20
List of Symbols 25
Chapter 1 Introduction 28
1.1. Introduction 29
1.1.1. Interfacial phenomena 29
1.1.2. Surface tension of a liquid ( Yl v) 30
1.1.3. Surface free energy of a solid 30
1.1.4. Solid/liquid interfacial energy ( Ysl) 31
1.1.5. Wettability of powders 31
1.1.5.1. The thermodynamics of wetting 32
1.1.5.2. Adhesional wetting 33
1.1.53. Immersional wetting 34
1.1.5.4. Spreading wetting 34
1.1.5.5. Conditions for spontaneous wetting 34
1.2. Surfactants 36
1.2.1. Classification of surfactants 36
1.2.1.1. Anionic 37
I.2.I.2. Cationic 37
1.2.1.3. Ampholytic 37
1.21.4. Non-ionic 38
6
Page
1.2.2.1. Anionic surfactants 38
1.2.2.2. Cationic surfactants 39
1.2.2.3. Nonionic surfactants 39
1.2.3. Micellization 40
1.2.3 .1. Critical micelle concentration 40
1.2.3.2. Micellar structure 40
1.2.3.3. The Krafift phenomenon 41
1.2.3.4. Solubilisation 42
1.2.3.5. Pharmaceutical aspects of solubilisation 42
1.3. Surface tension & contact angles 44
1.3.1. Surface tension measurement 44
1.3 .1.1. The Wilhelmy plate method 44
1.3.2. Contact angle measurement 48
1.3 .2.1. The Wilhelmy plate technique 48
1.3.2.2. Contact angle hysteresis 51
1.4. Calculation of surface energies from contact angles 52
1.4.1. Critical surface tension, Y c 52
1.4.2. Polar and dispersion components of surface energy 53
1.4.2.1. Calculation of polar and dispersion forces 54
1.4.3. Theory of non-additive surface energy components 55
1.4.3.1. Calculation of acid-base surface energy parameters 56
1.5. Solubility 59
1.5.1. The process of solution 59
1.5.2. Aspects of structure relating to solubility 60
7
Page
1.6. Dissolution 63
1.6.1. The Noyes-Whitney equation 63
1.6.2. Dissolution of solid drugs 64
1.6.3. Factors affecting dissolution rate 65
1.6.4. Measurement of dissolution rates 67
1.7. Partitioning 69
1.7.1. Partition coefficients 69
1.7.2. Water dragging effect 70
1.7.3. Choice of solvent 71
1.8. Absorption 73
1.8.1. Absorption across biological membranes 73
1.9. Aims and objectives 75
Chapter 2 Materials 76
2.1. Liquids 77
2.1.1. Buffer 77
2.1.2. Sodium hydroxide 78
2.2. Model powders 79
2.2.1. Sulphonamides 79
2.2.2. Sodium dodecyl sulphate 83
Page
Chapter 3 Contact Angle Measurement & Surface Energies 85
3.1. Introduction 86
3.2. Methods 88
3.2.1. Description of the Cahn D C A analyser 88
3.2.12. Method for cleaning glassware 89
3.21.3. Experimental procedure 89
3.2.2. Measurement of critical micelle concentration 90
3.22.1. Liquid penetration 91
3.2.2.2. Experimental procedure 91
3.2.2.3. Determination of CMC 92
3.2.3. Contact angle measurement 92
3.2.3.1. Powder plate preparation 93
3.2.32. Choice of liquid 95
3.2.33. Experimental procedure 95
3.3. Results and discussion 97
3.3.1. Surface tension data obtained for solutions of various SDS
concentration 97
3 .3 .1.1. Reproducibility of the data 97
3.3.1.2. Data analysis 97
3.3.2. Contact angle data obtained for the sulphonamides 100
3 .3 .2.1. Powder plate preparation 101
3.3 2.2. Errors in 0 and cos 0 values 101
3.3.3. Contact angle data for the sulphonamides against six solutions
of various SDS concentrations in water 103
3 3.3.1. CMC of SDS in water at 25 °C 103
9
Page
3.3.33. Advancing contact angle data for the sulphonamides 106
3.33.4. General discussion 108
3.4. Surface energies 109
3.4.1. Results and discussion 109
3.4.1.1. Surface energies calculated using the van Oss acid/base theory 109
3.41.2. The free energy of adhesion 111
3.4.1.3. Problems associated with the van Oss acid/base theory 112
3.4.14. General discussion 113
3.5. Conclusions 114
Chapter 4 Solubility Studies 115
4.1. Introduction 116
4.1.1. Factors affecting solubility 117
4.1.2. Use of surfactant 117
4.1.3. Parameters of solubility studied 118
4.1.4. Thermodynamics of transfer 118
4.2. Methods 120
4.2.1. Determination of maximum absorbance values ie 120
4.2.1.1. Experimental procedure 120
4.2.2. Construction of calibration curves 121
4.2.3. Determination of the solubility of a drug solid in a liquid 121
4.2.3.1. Experimental procedure 121
4.2.4. Determination of solubilities below and above CMC of SDS 122
10
Page
4.3. Results and discussion 124
4.3.1. ^max values 124
4.3.2. Calibration curves 124
4.3.3. Solubility data 128
4.3.3.1. Data in water and 0. IM SDS 128
4.33.2. Data in buffer and O.IM SDS 129
4.3.33. Thermodynamics of transfer from solubility experiments 130
4.33.4. Comparison between the free energy of adhesion and the
thermodynamics of transfer 133
4.3.3.5. General discussion 138
4.3.3.6. Solubilities at pK„ values 138
4.3.4. Solubilities in various SDS concentration 139
4.3.41. Plots of dimensionless solubilities versus surfactant concentration 140
43.4.2. General discussion 142
4.4. Conclusions 143
Chapter 5 Dissolution Rates 144
5.1. Introduction 145
5.2. Methods 147
5.2.1. Preparation of disk 147
5.2.2. Apparatus used for rotating disk dissolution 148
5.2.3. Experimental procedure for rotating disk dissolution rate studies 149
5.2.4. Apparatus used for initial powder dissolution 150
5.2.5. Experimental procedure for initial powder dissolution studies 151
11
Page
5.3. Results and discussion 15 3
5.3.1. Data obtained with varying temperature 153
5 .3 .1.1. Relationship between dissolution data and surface energy data 156
5.3.2. Data obtained at various stirring rates 160
5.3.2.1. Relationship between initial rotating disk dissolution rates and
varying stirring rates at 37°C in water and aqueous SDS solution 166
5.3.3. Data obtained at various SDS concentrations 166
5.33.1. Relationship between initial rotating disk dissolution rates at
37°C and 100 rpm and various concentrations of SDS solutions 170
5.3.4. General discussion 170
5.3.4.1. Thermodynamics of transfer from rotating disk dissolution
experiments and relationships with the surface energy data 170
5.3.5. Data obtained for initial powder dissolution rates (IPDR) 173
5.3.5.1. General discussion 174
5.4. Conclusions 177
Chapter 6 Partitioning 178
6.1. Introduction 179
6.2. Methods 181
6.2.1. Log P values from a computer program 181
6.2.2. Measurement of log P in water/octanol systems 181
6.2.3. The Taylor-Aris diffusion technique 183
6.2.3.1. Experimental procedure 183
12
Page
6.3. Results and discussion 189
6.3.1. Theoretical data obtained for log P 189
6.3.2. Data obtained from measurements of log P in an octan-l-ol/
water system 189
6.3.3. General discussion 190
6.3.4. Data obtained from the Taylor-Aris diffusion technique 190
6 .3 .4 .1. Thermodynamics of transfer from Taylor-Aris diffusion
experiments 191
6.3.4.2. Comparison between the free energy of adhesion and the
thermodynamics of transfer 192
6.3.4 3. General discussion 198
6.4. Conclusions 200
Chapter 7 Inter-relationships 201
7.1. Introduction 202
7.2. Slower dissolution rates of Sulfamerazine in an aqueous SDS
solution than in water 203
7.2.1. Solubilities 203
7.2.2. Rotating disk initial dissolution rate studies (RDIDR) 204
7.2.3. General discussion 207
7.2.4. Implications for dissolution testing 208
7.3. Relationship between dimensionless solubility and
dimensionless initial powder dissolution rate (IPDR) 209
13
Page
7.4. Comparison of wettability, solubility and dissolution in water 215
7.4.1. General discussion 216
7.5. Thermodynamics of transfer from dissolution experiments
and relationships with the surface energy data 217
7.6. Partitioning behaviour in relation to surface energy data 220
7.7. Future work 223
Chapter 8 Work on another drug:L-365-260 224
8.1. Introduction 225
8.2. Methods 227
8.2.1. value and calibration curve 227
8.2.2. Contact angle measurement 227
8.2.2.1. Assessment of surface energy 228
8.2.2.2. Contact angle measurement in solutions of various SDS
concentration 228
8.2.3. Solubility studies 228
8.2.3.1. Equilibrium solubilities 228
8.2.3.2. Dimensionless solubilities 229
8.2.4. Initial powder dissolution rates 229
8.3. Results and discussion 230
8.3.1. À value and calibration curve obtained 230
14
Page
8.3 .2.1. Data for surface energy analysis
8.3.2.2. Data against solutions of various SDS concentrations
8.3.3. Solubility data
8.3 .3 .1. Data for equilibrium solubilities
8.3.3.2. Dimensionless solubilities
8.3.4. Initial powder dissolution rates
8.3.5. General discussion
231 232 233 233 235 236 238
8.4. Conclusions 240
Chapter 9 Conclusions 241
9.1. 9.1.1. 9.1.2. 9.1.3. 9.1.4. 9.1.5.
Conclusions 242
Contact angle measurement and calculation of surface energies 242
Solubilities of the powdered drugs in water and micellar solutions 243
Dissolution properties under various conitions 243
Partitioning behaviour in solutions buffered to the pK^ of the
drug, with and without micelles 244
Overall conclusions 245
Appendix 247
List of Figures
15
Page
Figure 1.1.1. Diagram to illustrate the equilibrium of forces acting on a drop
of liquid on a solid. 32
Figure 1.1.2. The three stages in the wetting process; a) Adhesional wetting,
b) Immersional wetting, c) Spreading wetting. 33
Figure 1.2.1. Structures formed at high concentrations of surfactant (above
that which produces spherical micelles: a) Spherical micelles
b) Cylindrical micelles c) Middle phase (hexagonal rods) and
d) Neat phase (lamalae). 41
Figure 1.3.1. Diagram illustrating the Wilhelmy plate method with the plate
at equilibrium. 45
Figure 1.3.2. Determination of F^ jo j 47
Figure 1.3.3. A schematic diagram of the Wilhelmy plate method. 49
Figure 1.3 .4. A typical chart recorder trace. 49
Figure 1.3.5. Contact angle hysteresis on a tilted surface. 51
Figure 1.4.1. Graph of Cos 0 vs. Ylv used to determine the critical surface
tension, Yc- 52
Figure 1.5.1. Cavity model to show the process of solution. 60
Figure 1.6.1. Schematic diagram of dissolution for a solid surface. 65
Figure 1.7.1. Diagrammatic representation of solute partitioning between
water and another liquid, either alone or associated with water. 70
Figure 1.8.1. Drug absorption from a formulation. 73
Figure 2.2.1 The structure of Sulfanilamide. 81
Figure 2.2.2. The structure of Sulfadiazine. 81
Figure 2.2.3. The structure of Sulfamerazine. 82
Figure 2.2.4. The structure of Sulfamethazine. 82
Figure 2.2.5. The structure of Anthracene. 84
Figure 3.2.1. A diagrammatic representation of the Wilhelmy plate apparatus. 88
Figure 3.2.2. Showing the portion of the curve selected for determination
16
Page
Figure 3.2.3. Schematic diagram of the punch and die used to prepare the
powder plates. 94
Figure 3.2.4. Showing the portion of the curve selected for analysis. 96
Figure 3.3.1. Surface tension concentration profile showing the surface
tension fall to a minimum due to surfactant impurity. 104
Figure 4.2.1. Typical UV scan to show the of a drug in solution. 120
Figure 4.3 .1. Calibration curve of sulfanilamide. 125
Figure 4.3.2. Calibration curve of sulfamethazine. 125
Figure 4.3.3. Calibration curve of sulfamerazine. 126
Figure 4.3.4. Calibration curve of sulfadiazine. 126
Figure 4.3.5. The relationship between the total free energy of adhesion
(head and tail contribution) derived from surface energy data
and the enthalpy of transfer into micelles from solubility
experiments in water and buffer at pH = pK^ of drug. 135
Figure 4.3.6. The relationship between the enthalpy of transfer from water
solubility data and the free energy of adhesion of the drugs
to SDS head groups from surface energy data. 136
Figure 4.3.7. The relationship between the enthalpy of transfer from water
solubility data and the free energy of adhesion of the drugs
to SDS tail groups from surface energy data. 137
Figure 4.3.8. Dimensionless solubility of sulfamerazine in various
concentrations of SDS. 140
Figure 4.3.9. Dimensionless solubility of sulfadiazine in various
concentrations of SDS. 140
Figure 4.3 .10. Dimensionless solubility of sulfamethazine in various
concentrations of SDS. 141
Figure 4.3 .11. Dimensionless solubility of sulfanilamide in various
concentrations of SDS. 141
Figure 5.2.1. Disk of powder compact, held in a stainless steel cylinder. 148
17
Page
Figure 5.2.3. Initial powder dissolution apparatus. 151
Figure 5.3.1. Relationship between the enthalpy of transfer and the free
energy of adhesion to SDS head groups. 157
Figure 5.3.2. Relationship between the enthalpy of transfer and the free
energy of adhesion to SDS tail groups. 158
Figure 5.3.3. Relationship between the enthalpy of transfer and the total free
energy of adhesion to SDS (head and tail groups). 159
Figure 5.3.4. Initial rotating disk dissolution rate for sulfamerazine in water
with and without SDS micelles as a function of stirring rate. 162
Figure 5.3.5. Initial rotating disk dissolution rate for sulfadiazine in water
with and without SDS micelles as a function of stirring rate. 163
Figure 5.3.6. Initial rotating disk dissolution rate for sulfamethazine in water
with and without SDS micelles as a function of stirring rate. 164
Figure 5.3.7. Initial rotating disk dissolution rate for sulfanilamide in water
with and without SDS micelles as a function of stirring rate. 165
Figure 5.3.8. Initial rotating disk dissolution rate for sulfamerazine at 37°C
and 100 rpm as a function of aqueous SDS concentration. 168
Figure5.3.9. Initial rotating disk dissolution rate for sulfadiazine at 37°C
and 100 rpm as a function of aqueous SDS concentration. 168
Figure 5.3.10. Initial rotating disk dissolution rate for sulfamethazine at 37°C
and 100 rpm as a function of aqueous SDS concentration. 169
Figure 5.3.11. Initial rotating disk dissolution rate for sulfanilamide at 37°C
and 100 rpm as a function of aqueous SDS concentration. 169
Figure 5.3.12. Plot of dimensionless IPDR of sulfamerazine against SDS
concentration. 175
Figure 5.3.13. Plot of dimensionless IPDR of sulfadiazine against SDS
concentration. 175
Figure 5.3.14. Plot of dimensionless IPDR of sulfamethazine against SDS
18
Page
Figure 5.3.15. Plot of dimensionless IPDR of sulfanilamide against SDS
concentration. 176
Figure 6.2.1. Apparatus used to measure log P values in an octan-l-ol / water
system. 182
Figure 6.2.2. The Taylor-Aris diffusion apparatus. 185
Figure 6.3.1. The relationship between the total free energy of adhesion
(head and tail contribution) derived from surface energy data
and the enthalpy of transfer into micelles by the Taylor-Aris
diffusion technique at pH = pK^ of drug. 193
Figure 6.3.2. The relationship between the free energy of adhesion to the
SDS head groups (derived from surface energy data) and the
enthalpy of transfer obtained using the Taylor-Aris diffusion
technique. 194
Figure 6.3.3. The relationship between the free energy of adhesion to the
SDS tail groups (derived from surface energy data) and the
enthalpy of transfer obtained using the Taylor-Aris diflhision
technique. 195
Figure 6.3.4. The relationship between the the entropy of transfer (from
Taylor-Aris diffrision technique) and the y contribution to
the surface energy of the (largely monopolar) drugs. 197
Figure 7.2.1. Arrhenius relationship showing the effect of temperature
on RDIDR of sulfamerazine in water and a SDS solution. 205
Figure 7.3 .1. Plot of dimensionless IPDR and dimensionless solubility for
sulfamerazine against SDS concentration. 209
Figure 7.3 .2. Plot of dimensionless IPDR and dimensionless solubility for
sulfamethazine against SDS concentration. 210
Figure 7.3 .3. Plot of dimensionless IPDR and dimensionless solubility for
19
Page
Figure 7.3.4. Plot of dimensionless EPDR and dimensionless solubility for
sulfanilamide against SDS concentration. 211
Figure 7.6.1. The relationship between the total free energy of adhesion
(head and tail contribution) derived from surface energy data
and the enthalpy of transfer into micelles from solubility
experiments in water and buffer at pH = pK^ of drug. 220
Figure 8.1.1. The structure of L-365-260. 225
Figure 8.3.1. Calibration curve for L-365-260. 230
Figure 8.3.2. Solubility of L-365-260 in water (mol.dm'^) at four different
temperatures. 234
Figure 8.3.3. Solubility of L-365-260 in 0. IM SDS solution (mol.dm'^) at
four different temperatures. 234
Figure 8.3.4. Plot of dimensionless solubility against surfactant concentration
for L-365-260. 236
Figure 8.3.5. Plot of dimensionless IPDR and dimensionless solubility for
L-365-260 against SDS concentration. 238
Figure A. 1. Concentration of L-365-260 in the plasma of dog (N° 930275)
following an oral dose of 5mg/kg. 267
Figure A.2. Concentration of L-365-260 in the plasma of dog (N° 930277)
following an oral dose of 5mg/kg. 268
Figure A. 3. Concentration of L-365-260 in the plasma of dog (N° 930139)
following an oral dose of 5mg/kg. 269
Figure A.4. Concentration of L-365-260 in the plasma of dog (N° 930283)
following oral dose of 5mg/kg. 270
Figure A.5. Concentration of L-365-260 in the plasma of dog (N° 930279)
following an oral dose of 5mg/kg. 271
Figure A. 6. Concentration of L-365-260 in the plasma of dog (N° 930281)
following an oral dose of 5mg/kg. 272
Figure A. 7. Comparison of AUC in the plasma of dogs following an oral
List of Tables
20
Page
Table 2.1.1. Liquids used for contact angle measurements. 77
Table 2.1.2. Constituents of universal buffer for a 1 litre solution. 77
Table 2.2.1. The four sulphonamides and their batch numbers. 79
Table 2.2.2. Dissociation constants and partition coefficients for the
sulphonamides. 80
Table 2.2.3. The supplier and batch number of SDS. 83
Table 3.2.1. Surface energy values of all liquids used (mN.m‘^) 90
Table 3.3.1. Surface tension data (mN.m*^) obtained for solutions of SDS
of various concentrations and pH values at 25°C ± the
standard deviation. 98
Table 3.3.2. Surface tension data (mN.m'^) obtained for solutions of SDS
of various concentrations and pH values at 42°C ± the
standard deviation. 99
Table 3.3.3. CMC of SDS data as a function of temperature and pH. 100
Table 3.3.4. Advancing contact angle data obtained for the sulphonamides
against water, ethylene glycol (EG) and di-iodomethane (DI)
± the standard deviation. 101
Table 3.3.5. Surface tension data (mN.m'^) for varying concentrations
of SDS solutions (mol.dm'^) ± the standard deviation. 103
Table 3.3.6. Advancing contact angle data obtained for the sulphonamides
against solutions of various SDS concentration in water ± the
standard deviation. 107
Table 3 .4.1. The surface energy terms for test compounds, liquids used in
contact angle studies and sodium dodecyl sulphate head
groups and tails. 110
Table 3.4.2. Calculated terms for free energy of adhesion between each of
the drugs, SDS tails and SDS heads in the presence of water
21
Page
131
Table 4.3.1. Table of values. 124
Table 4.3.2. To show the equation of best fit for each calibration curve. 127
Table 4.3 .3. Solubility of the drugs in water at different temperatures with
and without SDS micelles. 128
Table 4.3 .4. Solubility of the drugs in buffer (at pH = pK^ of drug) at
different temperatures with and without SDS micelles. 129
Table 4.3.5. Calculated enthalpy parameters of solution in water and water
with SDS micelles and the thermodynamics of transfer (kJ.mol"^). 130
Table 4.3.6. Calculated free energy parameters of solution in water and water
with SDS micelles and the thermodynamics of transfer
(kJ.mol-*). 131
Table 4.3.7. Calculated entropy parameters of solution in water and water
with SDS micelles and the thermodynamics of transfer
(J.mol-*.K-')
Table 4.3.8. Calculated enthalpy parameters of solution in buffer (at pH =
pKg of drug) and buffer with SDS micelles and the
thermodynamics of transfer (kJ.mol'^).
Table 4.3.9. Calculated free energy parameters of solution in buffer (at pH =
pK^ of drug) and buffer with SDS micelles and the
thermodynamics of transfer (kJ.mol'^).
Table 4.3.10. Calculated entropy parameters of solution in buffer (at pH =
pK^ of drug) and buffer with SDS micelles and the
thermodynamics of transfer (J.mol'\K"^)
Table 4.3.11. Dimensionless solubilities of the sulphonamides in various
concentrations of SDS solutions at 37°C.
Table 5.3.1. Rotating disk dissolution rate data for compressed disks in
water at various temperatures. All units for rate constants are
% w/v.min'^ for disks of 132.7 mm^. Values are means ±
standard deviations. 154
132
132
133
22
Page
Table 5.3.2. Enthalpy of activation data obtained from the temperature
dependence of rotating disk dissolution rate constants
(thermodynamic parameters calculated from conventional
Arrhenius relationship at 31 OK). 155
Table 5.3.3. Entropy of activation data obtained from the temperature
dependence of rotating disk dissolution rate constants
(thermodynamic parameters calculated from conventional
Arrhenius relationship at 31 OK). 155
Table 5.3.4. Free energy of activation data obtained from the temperature
dependence of rotating disk dissolution rate constants
(thermodynamic parameters calculated from conventional
Arrhenius relationship at 31 OK). 156
Table 5.3.5. Rotating disk dissolution rate data for compressed disks in
0. IM SDS in water at 37°C, at various stirring speeds. All
units for rate constants are % w/v.min'^ for disks of 132.7 mm^.
Values are means ± standard deviations. 161
Table 5.3.6. Rotating disk dissolution rate data for compressed disks at 100
rpm and 37°C in solutions of various SDS concentration and
water. All units for rate constants are % w/v.min'^ for disks
of 132.7 mm^. Values are means ± standard deviations. 167
Table 5.3.7. Normalised initial powder dissolution rates in varying solutions
of SDS concentrations for the sulphonamides at 37°C and
100 rpm. 173
Table 6.3.1. Log P values for the sulphonamides in an octan-l-ol/water system. 189
Table 6.3.2. Measured log P values in an octan-l-ol/water system. 189
Table 6.3.3. Partition coefficients (as log P) obtained from the Taylor-Aris
diffusion technique at different temperatures for the drugs
23
Page
Table 6.3.4. Calculated thermodynamic parameters of transfer from buffer
(at pH = pKg of drug) to SDS micelles. 192
Table 7.2.1. The thermodynamics of activation calculated from the
temperature dependence of the RDIDR 205
Table 7.3.1. Contact angles of the sulphonamides at selected SDS
concentrations (in degrees). 212
Table 7.3.2. Diffusion coefficients for the sulphonamides in water and SDS,
calculated using the equation of Levitch, (1962). 214
Table 7.4.1. Data shown for the sulphonamides for the values of a number
of different parameters in water. 215
Table 7.5.1. The solubility of each drug in water and a solution of
6.93 X 10'^ mol.dm'^ sodium dodecyl sulphate. Units of g.dm'\ 218
Table 8.1.1. Solubility data in various solvents for L-365-260. 226
Table 8.2.1. The compaction pressure and dwell time employed for
L-365-260 powder. 227
Table 8.3.1. Advancing contact angle data for L-365-260 against water and
formamide. Values are means ± the standard deviation. 231
Table 8.3.2. Advancing contact angle data for L-365-260 against solutions of
various SDS concentrations in water. Values are means ± the
standard deviation. 232
Table 8.3.3. Solubility of L-365-260 in water and 0. IM SDS solution
(mol.dm'^) at four different temperatures. Values are means
± the standard deviation.
Table 8.3.4. Dimensionless solubilities of L-365-260 in various solutions of
SDS concentrations at 37°C.
Table 8.3.5. Normalised initial powder dissolution rates (IPDR) in varying
solutions of SDS concentrations for L-365-260 at 37°C
and 100 rpm. 237
233
24
Page
Table A. A. 1. Individual body weight (kg) for females before and after a single
oral administration of L-365-260. 257
Table A B 1. Mean pharmacokinetic parameters (n = 6) following a single oral
administration of L-365-260 to female dogs. 263
Table A.B.2. Plasma concentrations of L-365-260 (pg/ml) after a single oral
administration of 5 mg/kg of formulation A. 264
Table A.B.3. Plasma concentrations of L-365-260 (pg/ml) after a single oral
administration of 5 mg/kg of formulation B. 265
Table A.B.4. Plasma concentrations of L-365-260 (pg/ml) after a single oral
25
List of Symbols
a constant
A collision number
Ag surface area of a powder, or another material
b constant
c concentration of solute in solution
Coct concentration of drug in octan-1 -ol
Cg concentration dissolved at saturated solubility
crater Concentration of drug in water
CMC critical micelle concentration
CMT critical micelle temperature
D diffusion coefficient
dh diffusion layer thickness
diffusion coefficient of the micelle in aqueous solution
solute diffusion in aqueous solution
E activation energy
f fraction of solute in the micellar phase
F force
Fj detachment force
Fg equilibrium force
F^ d o i force at the zero depth of immersion
g acceleration due to gravity
IPDR initial powder dissolution rate
k dissolution rate constant
K solubility of an infinitely large particle
m mass
My molecular volume
p perimeter of a plate
pKa dissociation constant
26
P partition coefficient
?o polarity
r radius
R gas constant
RDEDR rotating disk initial dissolution rate
t time
T absolute temperature
Wa work of adhesion
W, work of immersion
Wg work of spreading
Greek symbols
Ylv surface tension of a liquid
Ysl solid/liquid interfacial energy
Ysv surface energy of the solid
Yc critical surface tension
Y^ dispersive contribution to surface energy
Y^ polar contribution to surface energy
Y™^ the total surface energy
Y ^ Lewis acid-Lewis base contribution to surface tension (or surface energy)
Y^^ Lifshitz-van der Waal's contribution to surface tension (or surface energy)
Y' electron donator component of the surface free energy
Y^ electron acceptor component of the surface free energy
A difference in or change in, eg change in enthalpy AH
AG Gibbs free energy change
AG* free energy of activation change
AGhead free energy of adhesion to the head groups of the surfactant
27
AGhead + tau ^66 energy of adhesion to the head and tail groups of the surfactant
AGi^ 2 adhesion between solid 1 and 2, in presence of water
AH enthalpy change
AH* enthalpy of activation change
AHyap enthalpy of vaporisation
AH® standard state enthalpy change
A S entropy change
A S* entropy of activation change
overall polar component of solubility parameter
ô j dispersive component of solubility parameter
Ô}, hydrogen bonding component of solubility parameter
Ôp polar component of solubility parameter
ôg solubility parameter
0 contact angle
Og advancing contact angle
Og equilibrium contact angle
Or receding contact angle
maximum absorbance
V kinematic viscosity
a the variance of the dispersion curve
28
CHAPTER 1
Chapter 1 Introduction 29
1.1. INTRODUCTION
The physical characterisation of pharmaceutical powders is important when considering
the formulation of dosage forms {eg Parsons et al, 1992b and York, 1983). Bulk material
properties often bear little relationship to surface properties, thus this work involves
investigation of the surface properties of pharmaceutical powders. This is because
contact between materials occurs at interfaces and a knowledge of surface properties is
necessary if the behaviour of materials, in terms of interactions with other phases, is to be
understood (or predicted). Such information has proved useful in the past for the
prediction of the performance of solid dosage forms and suspensions eg Rowe (1989),
Parsons et al, (1992b) and Pinto et a/.,(1995). Therefore it was decided to estimate
surface properties of materials by investigating their behaviour when in interfacial contact
with a number of well characterised different materials. The aim being to relate the
estimated interactions of a pharmaceutical powder with the various measured interactions
a solid dosage form encounters on oral delivery, such as solubility, dissolution and
partitioning.
1.1.1. Interfacial phenomena.
Consideration of the interaction between the phases is fundamental to the understanding
of the nature and behaviour of surfaces. When considering pharmaceutical systems, the
following interfaces are relevant;
vapour/liquid liquid/liquid solid/solid
Chapter 1 Introduction 30
Since this work is concerned with the surface properties of powders, the assessment of
the solid/vapour and the solid/liquid interfaces is of most interest.
1.1.2. Surface tension of a liquid (Ylv)*
In a liquid, the molecules at the surface are not completely surrounded by other like
molecules, unlike those in the bulk of the liquid. At the surface, each liquid molecule is
surrounded by other liquid molecules to the sides and below, whilst above the molecule,
there are gas molecules in the vapour.
The intermolecular forces between the liquid and vapour molecules are much weaker
than those between the liquid molecules. Molecules at the surface are pulled inward by
molecules below the surface of the liquid. The liquid attempts to contract to give
minimum surface area ie to attain the minimum surface energy, which for a free drop
would result in the formation of a sphere (which is a tendency for the surface to contract).
The contraction of the liquid/vapour surface is spontaneous. The liquid surface exists in
a state o f tension and the phenomenom is termed surface tension
(Ylv)-1.1.3. Surface free energy of a solid.
The value of the work required per unit area to move molecules to the surface of a liquid
is termed the surface free energy. For a liquid/vapour interface, the surface tension
(mN.m*^) and the surface free energy (mJ.m'^) are numerically equal. The surface free
energy o f a solid is similar to the surface tension of a liquid, since it results from the
Chapter 1 Introduction 31
intermolecular forces are far greater and therefore, the molecules are unable to move
freely.
1.1.4. Solid/ liquid interfacial energy (Ysl)
This also occurs due to an imbalance of forces at the interface. It will depend on the
surface free energy and surface tension of the solid and liquid involved.
1.1.5. Wettability of powders.
The wettability of a powder represents the extent of its interaction with a liquid. Indirect
methods are used to measure wettability. When a drop of liquid is placed at the surface
of a solid, an angle is produced between the powder and the liquid. This angle is known
as the contact angle, 0, and represents an equilibrium of three energies, Ysv - surface
energy of the solid, Ylv " surface tension of the liquid and Ysl " solid/liquid interfacial
Chapter I Introduction 32
Y,
LVVapour
Liquid
SL
I S o lid
Figure 1.1.1. Diagram to illustrate the equilibrium of forces acting
on a drop of liquid on a solid.
These forces can be described by Young's equation (Young, 1805).
Y s v = Y s l + Y i.v (cos 0)
The smaller the value o f 0, the greater the wettablity. Thus, 6 provides a means o f
evaluating the wettability o f powders as a measurable quantity.
1.1.5.1. The thermodynamics of wetting.
A useful model describing the three stages in the wetting process has been given by Parfitt
Chapter 1 Introduction 33
a) b) c)
Figure 1.1.2. The three stages in the wetting process;
a) Adhesional wetting
b) Immersional wetting
c) Spreading wetting
1.1.5.2. Adhesional wetting.
In adhesional wetting, the solid is brought into contact with the liquid surface which
adheres to it, resulting in the loss of a liquid/vapour interface. The driving force for this
process is known as the work of adhesion, W^, which is described in Equation 1.1.3.
w , = Y s l - ( Y s v + Y l v ) (1.1.3.)
In combination with Young's equation (Eq. 1. 1.1.), this gives the Young-Dupré equation;
Chapter 1 Introduction 34
1.1.5.3. Immersional wetting.
Immersional wetting is the process whereby a unit area of surface is completely immersed
in the liquid. It involves the replacement of the solid/vapour interface with a solid/liquid
interface. The work involved, Wj, per unit area of surface, is called the work of
immersion and is given by;
Wi = 4YsL-4Ysv (1.1.5.)
which, combined with Young's equation (Eq. 1.1.1.) to remove the solid related surface
energy terms yields:
Wi = - 4ylv (cos 0) (1.1.6.)
1.1.5.4. Spreading wetting.
In spreading wetting, the liquid spreads over the solid surface replacing solid surface area
in equal amounts by liquid surface and solid/liquid interface. Hence the work of spreading
wetting, Wg is given by;
w , = Y s v - Ysl + Yl v ( 1 . 1 . 7 . )
which in combination with Eq. 1.1.1. gives;
Ws = -Ylv (cos 0 - 1) (1.1.8.)
1.1.5.5. Conditions for spontaneous wetting.
For spontaneous wetting to occur, the work of adhesion, immersion and spreading must
Chapter 1 Introduction 35
a) Adhesional - Ylv (1 + c o s 0) > 0
b) Immersional - Y l v cos 0 > 0
c) Spreading - Y l v (cos 0 - 1) > 0
Since the surface tension, Ylv? is always positive, the value of cos 0 determines whether
each condition is satisfied, as shown below;
a) cos 0 ^ - 1 ie0 <180°
b) cos 0 > 0 ie Q < 90°
Chapter 1 Introduction 36
1.2. SURFACTANTS.
Surface active agents or surfactants, are molecules which are characterised by having two
regions in their chemical structure, one hydrophobic (water-hating) and the other
hydrophilic (water-liking). The hydrophobic region would consist of a hydrocarbon chain,
and the hydrophilic region can be an ionisable, polar or water soluble group. Surfactants
are often referred to as amphiphilic molecules as they have an attraction in both aqueous
and oil phases.
It is energetically favourable for surfactants, when dissolved, to adsorb at interfaces,
orientating themselves in such a manner that the regions are associated with the
appropriate solvent. Because of the accumulation of surfactant molecules at surfaces and
interfaces, there will be an expansion which will reduce surface and interfacial tensions.
Surfactants will lower surface tension to different degrees.
1.2.1. Classification of surfactants.
Surfactants are characterised by the possession of both polar and non-polar regions on the
same molecule (Florence and Attwood, 1988). The polar or hydrophilic region of the
molecule may carry a positive or negative charge, giving rise to cationic or anionic
surfactants respectively, or may be composed of a polyoxyethylene chain, as in many of
the non-ionic surfactants. The non-polar or hydrophobic portion of the molecule is most
Chapter 1 Introduction 37
Surfactants can be classified into four groups:
1.2.1.1. Anionic.
These are surfactants in which the hydrophilic portion of the molecule carries a negative
charge. A common example is sodium lauryl sulphate (also known as sodium dodecyl
sulphate), which is:
CHj (CH^),! - SO;.Na^
Other examples have the general structure R - COO or R - SO^ (where R represents the
hydrocarbon based chain).
1.2.1.2. Cationic.
In this case, the cation of the compound is the surface active species eg
hexadecyltrimethylammonium bromide:
CH3(CH2)i5N^(CH3)3Br-1.21.3. Ampholytic.
This type of surfactant can behave as either an anionic, non-ionic or cationic species,
depending on the pH of the solution {ie the extent of ionisation of the various functional
groups). An example would be N-dodecyl-N, N-dimethyl betaine, shown in its zwitterion
form;
Chapter I Introduction 38
1.2.1.4. Non-ionic.
These are surfactants which have a water soluble hydrophilic region, which is not ionic.
The water soluble moiety of this type can contain hydroxyl groups or a polyoxyethylene
chain eg polyoxyethylene monohexadecyl ether;
CH3
(ocK,CH,),,on
1.2.2. General properties of some surfactants used pharmaceutically.
1.2.21. Anionic surfactants.
This group includes a) soaps, b) alkyl sulphates and c) alkyl sulphonates.
a) Soaps
The most commonly used soaps are the alkali- metal soaps, RCOOX where X is sodium,
potassium or ammonium. The chain length, R, of the fatty acid is generally between C^o
and C2 0. A pharmaceutically important soap is sodium stearate, used as an emulsifying
agent, a cleaning agent and in glycerin suppositories.
b) Alkyl sulphates
These are prepared from fixed oils, such as coconut oil, whereby the oil is converted to
a mixture of alcohols ranging in chain length from about 1 2 to 2 0 carbons. Sodium
dodecyl sulphate is an example used pharmaceutically as a pre-operative skin cleanser
(having bacteriostatic action against gram-positive bacteria), in medicated shampoos and
Chapter 1 Introduction 39
c) Alkvl sulphonates
The best known pharmaceutical example in this group is Dioctyl sodium sulphosuccinate
or Docusate sodium. Its surface active properties account for its use as a faecal softener.
1.2.2 2. Cationic surfactants.
This category includes the quaternary ammonium salts. They are water soluble, non
caustic, stable and incompatible with anionic agents. These are important
pharmaceutically because of their bactericidal activity against a wide range of gram-
positive and some gram-negative organisms. Two common examples are a) cetrimide and
b) benzalkonium chloride.
a) Cetrimide
Solutions containing 0 . 1 to 1% cetrimide are used for cleansing the skin, wounds and
bums, for cleaning contaminated vessels and for storage of sterilised surgical instruments.
Solutions of cetrimide are also used in shampoos for seborrhoea.
b) Benzalkonium chloride
This is used as a preservative for eyedrops. It is also in preparations used as anti-
infectives in mouthwashes and for application to bums and wounds.
I.2.2.3. Non-ionic surfactants.
The advantage of non-ionic surfactants over ionic surfactants is that they are compatible
with all other types of surfactant and their properties are little affected by pH. Common
examples include cetomacrogol, which is used in many cream formulations, as well as the
Chapter 1 Introduction 40
1.2.3. Micellization.
1.2.31. Critical micelle concentration.
Surfactants form monolayers at the surface or interface of a two phase system; the polar
portion of the molecule protruding into the aqueous phase while the nonpolar portion
extends into the oily or non aqueous phase (Kayes, 1988). When the concentration of
surfactant is such that the interface contains more surfactant than that required to form
a monolayer, the excess forms aggregates or micelles, in which the lipophilic hydrocarbon
chains are orientated towards the interior of the micelle, leaving the hydrophilic groups
in contact with the aqueous medium (this can invert in non-polar solvents). The
concentration of a surfactant at which micelles form is termed critical micelle
concentration (CMC) for the surfactant.
I.2.3.2. Micellar structure.
At the point where micelles begin to form, the concentration of monomers will have
reached a maximum in the solution. Surfactants exist in a number of different states as
the concentration is changed. These have been reviewed by Buckton (1995).
As concentration is increased, the solution first passes the CMC to form spherical
micelles. Further increases may then lead to the formation of cylindrical micelles which
may subsequently be forced to join into hexagonal bundles of rods (see Figure 1.2.1.).
These bundles of rods are termed the "middle phase". Alternatively, the system may form
Chapter 1 Introduction 41
a) c)
d)
iiiUlUiU
rrrrrm rrr
lUiUiUU
Figure 1.2.1. Structures formed at high concentrations of surfactant (above that
which produces spherical micelles; a) Spherical micelles b) Cylindrical micelles, c)
Middle phase (hexagonal rods) and d) Neat phase (lamalae).
I.2.3.3. The Krafft phenomenon.
Micelle forming surfactants exhibit an unusual phenomenon in that their solubilities show
a rapid increase above a certain temperature. This temperature is known as the "Krafft
point" and is characteristic for any particular surface active agent (Shaw, 1966). This is
explained by the fact that unassociated surfactant has a limited solubility, whereas the
micelles are highly soluble. Below the Krafft temperature, the solubility of the surfactant
is insufficient for micellization. As the temperature is raised, the solubility slowly
increases until at the Krafft point, the CMC is reached. This temperature is often called
Chapter 1 Introduction 42
be dispersed in the form of micelles so that a large increase in solubility is observed.
1.2.3.4. Solubilisation.
As mentioned earlier, the interior core of a micelle can be considered to have the
properties of a liquid hydrocarbon and is thus capable of dissolving materials that are
soluble in such liquids. Thus solubilisation may be defined as the formation of a greater
solubility of a solute in a solvent, by the production of a thermodynamically stable
isotropic solution, following the introduction of one or more amphiphilic components at
or above their critical micelle concentration (Attwood and Florence, 1983).
The extent to which solubility can be increased by solubilisation will depend upon the
amount and type of surfactant present and the nature of the solute. Also the effect of
temperature and of added electrolytes are important issues in the solubilisation process
(Elworthy a/., 1968).
1.2.3.5. Pharmaceutical aspects of solubilisation.
The literature on pharmaceutical applications of micellar solubilisation is extensive. Water
insoluble bactericides, vitamins, steroids, essential oils and antibiotics have been
formulated in micellar systems, thus facilitating their use in medicine (Elworthy et a l,
1968).
Whilst solubilisation is an excellent means of producing an aqueous solution of a water-
Chapter 1 Introduction 43
absorption characteristics.
Examples of solubilisation include improving the solubility of phenolic compounds such
as cresol and chloroxylenol by solubilisation with soaps. Glycerol has also been used with
polysorbate 80 to improve the solubility of vitamin A (Coles and Thomas, 1952). This
complex topic has been reviewed by Elworthy et al, (1968). However recent examples
include Sjostrom et al, (1993) who looked at the suspension of small particles of poorly
water-soluble drugs under the influence of émulsification and surfactant concentration.
Warren et al, (1995) investigated using micellar solubilisation to enhance the solubility
of salbutamol and triamcinolone acetonide in chlorofluorocarbon solvents, with the aim
of formulating solution metered dose inhaler products of these drugs.
Many surface active molecules also occur naturally in the body. Bile salts are surfactants
which are synthesised in the liver and which are present in the gastrointestinal tract
(GIT). One of the main functions of bile salts is to solubilise fat in the gastrointestinal
tract and to facilitate its absorption. It is probable that bile salts are involved in the
process of absorption of certain hydrophilic drugs from the GIT, both as a wetting agent
Chapter 1 Introduction 44
1.3. SURFACE TENSION & CONTACT ANGLES.
1.3.1. Surface tension measurement.
There are many methods available for measuring the surface tension of liquids, such as
capillary rise, drop volume and drop weight methods, Du Noüy ring tensiometer method
and the Wilhelmy plate method. These techniques have been discussed in detail by Fell,
(1988) and Sheridan et al, (1994a). We will only be concerned with one of these, which
is the Wilhelmy plate method.
1.3.1.1. The Wilhelmy plate method.
The three versions of this method are; equilibrium, detachment and dynamic. A thin
rectangular plate of glass, platinum or filter paper is suspended vertically from a torsion
balance above a clean beaker containing the test liquid, which is placed on a mechanical
stage. The equilibrium method involves the stage being raised slowly until the plate makes
contact with the liquid (see Figure 1.3.1.), the force, F^ is noted and the surface tension
Chapter 1 Introduction 45
t
T o rsio n B alance
Figure 1.3.1. Diagram illustrating the Wilhelmy plate method
with the plate at equilibrium.
where;
Y l v = Fe g / P
p = perimeter of the plate
g = acceleration due to gravity
For the detachment method, the stage is raised until the plate just dips into the liquid. The
stage is then lowered slowly until the plate is just at the point of detachment. The force
Fj is read from the torsion balance and the surface tension may be calculated using
C hapter I Introduction 46
The dynamic method involves use of the automated equipment, Cahn Dynamic Contact
Angle analyser, which allows easier and more accurate measurement of surface tension.
With this technique, the test liquid is placed on a motorised platform and the glass slide
or filter paper is attached to one arm of a microbalance. Both the microbalance and the
motorised platform are linked to a personal computer. The platform is then raised, at a
constant pre-set speed until the plate is immersed 5-lOjmminto the liquid. The platform
is then lowered to its initial position. The force and relative position of the platform is
obtained by the computer at one second intervals.
A graph of the force is plotted as a fimction of the stage position. The buoyancy slope
can be extrapolated back to the stage position which corresponds to the point where the
plate initially makes contact with the liquid. As shown in Figure 1.3 .2. the force at the
zero depth of immersion, ^z.d.o.i. can be determined, which is the point at which the only
force acting on the plate is due to a function of the surface tension of the liquid and its
contact angle with the plate.
Using Equation 1.3.1. the surface tension may then be calculated by replacing with
F^. d.o.i. • This method of extrapolating the buoyancy slope to determine F is much more
accurate than the single point determination used for the equilibrium methods, therefore
Chapter I Introduction 47
z.d.o.i.
B u oyan cy slope
Force (m g)
Stage p osition (m m )
Chapter 1 Introduction 48
1.3.2. Contact angle measurement.
Again, as with surface tension measurements, there are several methods available to
measure contact angles such as liquid penetration, tilting plate method, sessile drop
method and the Wilhelmy plate technique. These methods of measuring contact angles
for pharmaceutical powders can be split into two broad groups:
a) liquid penetration techniques
b) compressed powder plate methods.
There have been several publications reviewing contact angle measurement methods {eg
Neumann and Good, 1979 and Buckton, 1990b). However the technique which will be
discussed here is the Wilhelmy plate method.
1.3.2.1. The Wilhelmy plate technique.
As described in section 1.3.1. this method has been used to measure surface tension. For
contact angle measurement, a compressed powder plate is employed instead of a glass
slide. Equation 1.3.2. is used instead of Equation 1.3.1. as cos 0 is no longer unity.
co s0 = F g / p Y L v (1.3.2.)
where F = force and
g = acceleration due to gravity
The powder compact is suspended from a microbalance above the test liquid. The
motorised platform is raised until the plate makes contact with the liquid. Figure 1.3.4.
Chapter 1 Introduction 49
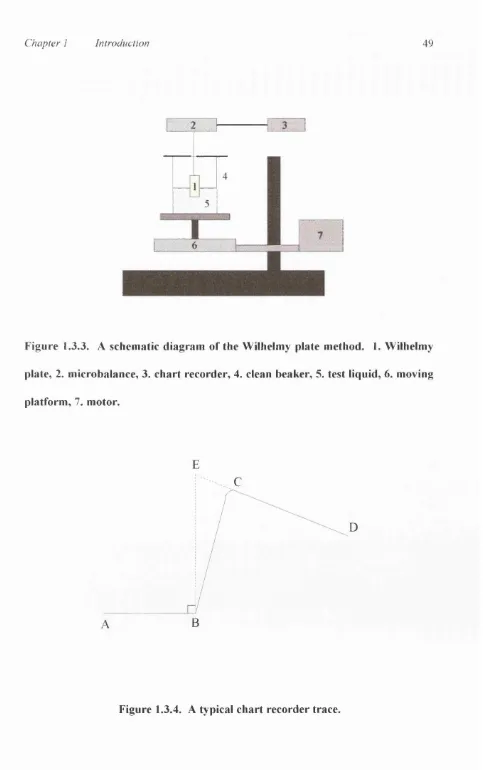
Figure 1.3.3. A schematic diagram of the Wilhelmy plate method. 1. Wilhelmy
plate, 2. microbalance, 3. chart recorder, 4. clean beaker, 5. test liquid, 6. moving
platform, 7. motor.
C
B
A
D
Chapter 1 Introduction 50
A-B is the region prior to contact between the plate and the liquid. As soon as contact
is made, a deflection is observed (C) and continued immersion of the plate causes the line
CD to be formed. Extrapolation of the line CD back to the perpendicular to AB, at B
gives the true measured force, BE. This force is then used in Equation 1.3.2. to calculate
cos 0 .
In previous reviews, the advantages and disadvantages of methods of measuring contact
angles have been discussed ggHeertjes et al, (1967). This Wilhelmy plate technique has
several advantages over the other available methods.
1. It is an automated method and therefore is not as operator dependent as the other
methods eg sesseile drop.
2. Contact angle hysteresis can be studied as advancing and receding data can be obtained
easily.
3. It is not necessary to pre-saturate the compact prior to measurement.
4. Any deformation of the plate occurring during measurement, will do so below the
liquid surface. Although if this occurs, it is not possible to obtain receding data.
The main disadvantage of this method, as for all techniques employing compressed
powder plates, is that the compaction process may alter the outer surface of the plate
(Buckton and Newton, 1986) by plastic deformation. Chawla et al, (1994) found a
further problem with surface roughness, which is unique to the Wilhelmy plate approach
to contact angle measurement. It was observed that if the perceived perimeter (the outer
Chapter 1 Introduction 51
perimeter, due to surface roughness or plate porosity, then the calculated angle would be
in error.
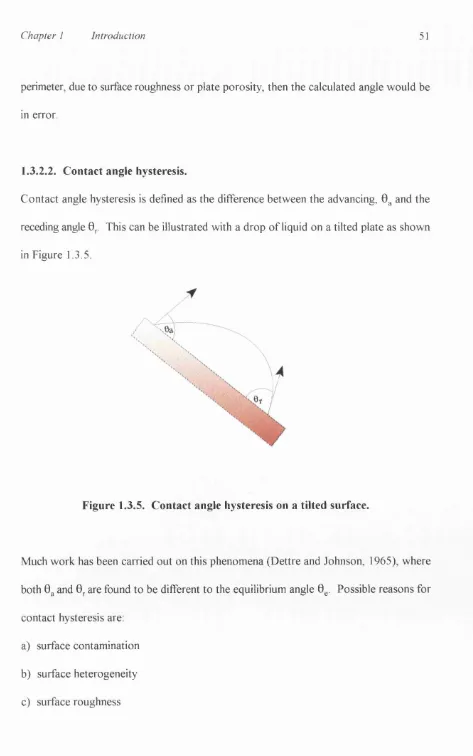
I.3.2.2. Contact angle hysteresis.
Contact angle hysteresis is defined as the difference between the advancing, 0^ and the
receding angle 0^. This can be illustrated with a drop of liquid on a tilted plate as shown
in Figure 1.3.5.
Figure 1.3.5. Contact angle hysteresis on a tilted surface.
Much work has been carried out on this phenomena (Dettre and Johnson, 1965), where
both 0g and 0^ are found to be different to the equilibrium angle 0^. Possible reasons for
contact hysteresis are:
a) surface contamination
b) surface heterogeneity
Chapter I Introduction 52
1.4. CALCULATION OF SURFACE ENERGIES FROM
CONTACT ANGLES.
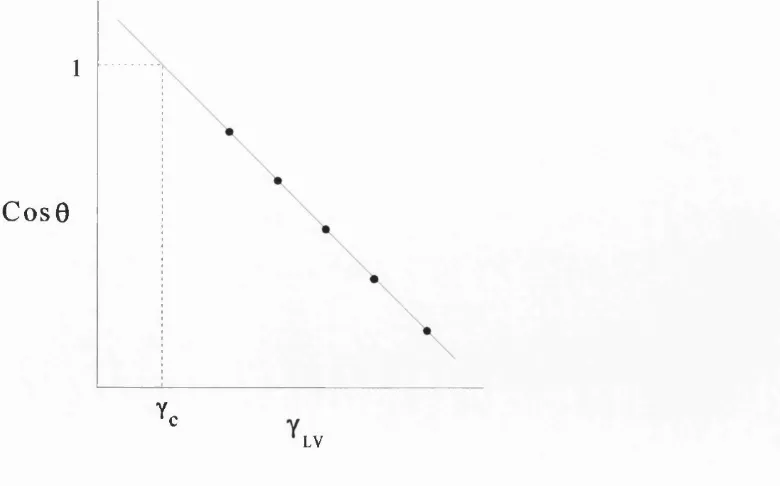
1.4.1. Critical surface tension, y^.
The critical surface tension, solid represents a measure o f the wettability o f the
solid. It may be defined as the value o f the surface tension o f a wetting liquid, above
which spontaneous wetting (ie adhesion, immersion and spreading) does not occur for
that solid
Fox and Zisman (1950) developed y^, which represents the value o f y^^ when cos 0 is
extrapolated back to equal 1 as shown in Figure 1.4.1.
1
C o s 0
Yc
LV
Figure 1.4.1. Graph of cos 0 vs. y, y used to determine the
Chapter 1 Introduction 53
A considerable amount of work has been undertaken on critical surface tension
determination. It was noted that a homologous series of pure liquids would usually give
higher values for than liquid mixtures (Good, 1977). Furthermore, a plot of cos 0 as
a function of Ylv°^ was found to be a more appropriate approach to the accurate
determination of the critical surface tension (Good, 1977).
1.4.2. Polar and dispersion components of surface energy.
Fowkes (1964) proposed that surface energy be considered as additive contributions
representing polar (p) and dispersion (d) forces, where is the total surface energy.
Y TOT ^ yP _|_ (1.4.1.)
It was important to consider the nature of different forces which could act across
interfaces. It is usual to consider physical forces as polar interactions, which can be
electrostatic interactions (also called Coulombic) and a group of forces which are
collectively termed van der Waals interactions. Coulombic interactions existing between
charged molecules and being of high energy, are not of great concern to interfacial
phenomena.
Van der Waals interactions consist of three types of forces; dipole, induced dipole and
dispersion forces. These low energy interactions between materials are of more relevance
to this line of work. Thus the interfacial force was considered to be composed of
C hapter 1 Introduction 54
1.4.21. Calculation of polar and dispersion forces.
Fowkes (1964) derived a relationship which allows the calculation of the dispersion
component of the surface energy of a solid, from a contact angle measured using a liquid
which has a surface tension, which is entirely non-polar.
Yl (1 + cos 0) = 2 (1.4.2.)
where y / ^ the dispersive component of the surface tension of a liquid
Y 2^ = the dispersive component of the surface energy of a solid
Yl = the surface tension of a liquid
This equation was represented by Zografi and Tam (1976) in a form which can be solved
iteratively by use of simple computer programmes to find the polar and dispersion
components of the surface energy of any solid if a contact angle is measured on the solid,
using two different liquids, each of known surface tension and polarity. Polarity being the
polar component of surface tension divided by the total surface tension.
The theory of polar and dispersion forces to characterise interfacial phenomena has been
used by many for over 20 years. However, more recently eg Fowkes et a l, (1990) found
that this theory may be incorrect, as interfacial tensions between squalene and many other
liquids were considered and observed behaviour was found not to correlate with
predictions that were based on polar and dispersive interactions. Such interactions were
accurately modelled by considering the polar term as being either acidic and/or basic in
C hapter I Introduction 55
1.4.3. Theory of non-additive surface energy components.
Van Oss eta l, (1987) described difficulties in considering polar interactions as all being
of a similar type and pointed out that there were materials which could be described as
polar which were dipolar, hydrogen-bonding, Lewis acids or Lewis bases. Dipolar
materials have a permanent dipole. Hydrogen bonding materials could be of three distinct
classes ie those which are proton donors and proton acceptors {eg water), those which
are predominantly proton donors {eg chloroform) and those which are predominantly
proton acceptors {eg ketones).
Similarly a subdivision is possible with the Lewis acid-Lewis base materials, which can be
considered as either bipolar or monopolar in either the electron donor or the electron
acceptor sense (van Oss et al, 1987). Two polar materials of the same sign can repel
each other. Monopolar repulsion energies are significantly stronger than apolar
interactions and will have a dominant influence on interfacial behaviour. It has been
shown that many materials are monopolar.
Van Oss et a l, (1987) suggested treating dispersion forces as a non-polar term which is
an additive contribution of all dispersion and induced-dipole-induced dipole forces, which
is defined as the Lifshitz-van der Waals term (y^^). A surface energy term can then be
defined in terms of and its constituent parts, y^^ and its acid-base contribution, y ^ ,
the acid-base parameter being further divided into an electron-donor (y ) and an electron
Chapter I Introduction 56
1.4.31. Calculation of acid-base surface energy parameters.
The first stage is to accept that no interaction can occur between the LW and the AB
forces, thus;
yTOT=^LW+^AB (1.4.3.)
For a liquid, once the total surface tension is known, the component of the surface
tension can be found by contact angle (0) measurement on a completely apolar surface,
such as Teflon, by using Eq. 1.4.4.
Yl ( 1 + cos 0 ) = 2 ( YL^^ ) (1.4.4.)
The Y^^ component of the surface tension of solids can similarly be determined by contact
angle measurement, with apolar liquids for which YL^Y^^ using the following equation;
1 + cos 0 = 2 ( Vys^"^/Yl) (1.4.5.)
According to the Dupre equation, the apolar interaction energy (AGj32^^) between
materials 1 and 2 immersed in a liquid 3 is
A G ,3 r = Yi2'-'"-Yi3"'"-Y23"'" (1.4.6.)
where
Y,2™ = (vÇ ? ^ ^ V ^ ) " (1.4.7.)
In addition to apolar interactions, polar interaction of, for example the hydrogen-bonding
Chapter I Introduction 57
materials 1 and 2 can be expressed as
A C r = Yi2^ - - Y2^ ( 1.4 .8 .)
where
Yi2^ = 2 ( Vy7y7 + A 2 > 2 ‘ - A i> 2 ‘ - A iY2^ ) (1.4.9.)
and
Y r = 2yY/ Yi - (1-4.10.)
Expressing the Young-Dupré equation as
( 1 + cos 0 ) Yl ^ (1.4.11.)
and considering that
AG'^°^= A G ^ (1.4.12.)
we obtain
( 1 +COS0) Yl = -AG^"^- A G ^ (1.4.13.)
which becomes
( 1 + cos 0 ) Yl = 2 ( /ys^^Yl^^ + A s> l' + A sYl^ ) (1.4.14.)
Thus by contact angle (0) measurement with three different liquids (of which two must
be polar) with known Yl^^^ Yl^ and Yl values using Equation 1.4.14. three times, the
Ys^T Ys^ 3iid Ys of any solid can be determined. Similarly by contact angle measurement