6092 IJSTR©2020
www.ijstr.org
A
N
E
FFICIENT
D
ETECTION OF
S
TRUCTURAL
S
IMILARITY IN
M
AMMOGRAMS USING
S
UPPORT
V
ECTOR
M
ACHINE
(SVM)
CLASSIFIER
P.Suresh Kumar, S.Meenakshi, G.Nirmala, G. Prathap
Abstract— One of the greatest threats conquer among women is the breast cancer and it has second highest incident value .According to the survey of national cancer institute more than 20% of women affected by breast cancer every year and has a highest impact value. Mammogram is the best screening tool to detect breast cancer and gives best accuracy than clinical pathological identification. Mammogram considerably reduces the false prediction rate. In Proposed Method, combined Mean and Median filter is used to smooth image and region based segmentation is used to partition the image in order to get the information from the image and then feature are extracted using Local Binary Pattern (LBP). Finally Support Vector Machines (SVMs, also support vector networks) are supervised learning models with associated learning algorithms are used to analyze data and recognize the patterns. The SVM classifier classifies the image into Malignant, benign images. Maximum classification accuracy of this method is 88.8%.
Index Terms— Mammogram, Bilateral Asymmetry, Local Binary Pattern, Support Vector Machines
—————————— ——————————
1 I
NTRODUCTIONA mammogram is a routine part of a breast cancer screening program. Frequently checking the lumps to be an insufficient for the detection of abnormalities. The lesion can be developed a years ago before it becomes palpable. The ‗bump‘ or ‗lump‘ of some kind has been found on a clinical examination by a physician, the patient will immediately understand that is mammogram and needs clinical treatments. Breast cancer is the most popular cancer in urban Indian Women. Due to lack of awareness most of the Indian female patients can detect the cancer only at the advanced stage. Mammogram is the low dose x-ray detection technique used for screening purpose. Due to the lack of access in Mammograms the physician needs an advanced technique to find the size of large tumor and lymph node metastases [1].
R E Birde al., [2] investigated that 10-30% cancers were unpredicted by radiologist. The reason for this density of breast and location of lesion.
The major causes for noise in mammogram image are the presence of rectangular and low density labels. Different types of noises are applied to mammogram images and preprocessing done with the help of median and fuzzy filters in [3]. It has been concluded from the performance analysis
factors like SNR, PSNR and MSE that Median filter is best
suited for mammogram images. An automatic segmentation based on morphological preprocessing has been proposed in [4]. Edge detection and Region based segmentation were used to detect the contour in Digital Mammogram images. It needs an improvement in edge detection algorithms for better contour and abnormalities detection.
Hasan Moslemiet al., [5] presented a method using coordinate logic filter and fuzzy inference to identify the mass regions in mammogram images. To obtain the location of masses uses thresholding. The accuracy of the method is 0.01.ADirectional Analysis procedure with KL transform for the detection of mammogram features is reported in [6].
However, the selection number of scales and orientation angle depends on optimality constrain. The selection of symmetrical or nonsymmetrical mammogram is obtained using Gobar Wavelets. The accuracy of this technique majorly depends on texture differences.
D. Tzikopoulos et.al.,[7] presents an fully automated segmentation based on breast density estimation and breast boundary extraction algorithm. A support vector machine is employed for classification and provides an accuracy of 85%.An automatic segmentation of breast tissue density using Genetic Algorithm and Artificial Neural Network (ANN) was presented in [8]. It works well only for symmetric images.
Issam El-Naqa et al.,[9] investigated a method based on SVM to identify the presence of Micro-calcification clusters in Digital Mammogram. The performance of the method is tested with 76 Mammograms. For an image it given one false positive error rate and the sensitivity is 94%.
Chun-Chu Jen [10] proposed a method to detect abnormalities in mammogram images. The extracted values are shape of the breast object as well the breast orientation. Initially mean filter is applied with the window size 11X 11 for denoising the images. The breast and non breast regions are ————————————————
P.Suresh Kumar working as Professor, Mahendra Engineering college (Autonomous),Namakkal, Tamilnadu
,Email:[email protected]
S.Meenakshi working as Assistant Professor, Mahendra College of Engineering ,Salem ,Tamilnadu
G.Nirmala working as Assistant Professor, Mahendra Institute of Technology, Namakkal, Tamilnadu
G.Prathap ,PG Scholar, Mahendra Engineering college (Autonomous),Namakkal, Tamilnadu
6093 identified using binarization. The parameters are then
classified using abnormality detection classifier. The main limitation in this method is blurring in an image.
Indra Kanta Maitraet al., [11] proposed a Computer Aided Detection (CAD) algorithm for determining the abnormalities in human breast tissue. Initially preprocessing is done with the help of contrast limited adaptive histogram equalization (CLAHE) and specific Region of Interest can be determined using Region growing algorithm. By using CC and MLO views of mammogram the mass and micro-calcification be determined using joint analysis in [12].It uses Bayesian network system for the detection of abnormalities.
Histogram modified filter and K-means clustering is applied prior to LBP based detection has been proposed in [13].The classification done with the help of Neural Network. The accuracy of this system for a set of 5 images is obtained as 94.7%. E.Geetha et al.,[14]proposed an automatic technique for the detection of breast cancer at early stage. In this preprocessing done with Otsu‘s thresholding method and combined LBP and DWT is used for the detection of features .In the final stage classification is done with the help of feed forward neural network with the learning rule as gradient decent rule.
The techniques usually employed for segmentation separates the masses and calcifications from the given input Image. A region growing algorithm for mass segmentation of a given image has been proposed in [24] .Watershed based transformation is applied to separate the masses from the dense mammograms.
2.
P
ROPOSEDW
ORKTo implement the given system a set of 260 images were taken from MIAS Mammographic Database. The images taken in both right as well left MLO and CC views. Initially salt &pepper noises were added with the mammographic images. Then the quality of the image is enhanced with Mean and Median Filter.
2.1
P
REPROCESSING:
The major reason for noises in mammogram is contrast and low-density pixels in mass borders. It needs a preprocessing filter to enhance the quality as well to find the mass regions. It needs a filter with high signal to Noise Ratio (SNR). It can also be required to preserve the edges.
2.2
M
EANF
ILTER:
In this each pixel is replaced by average value of the pixel around its neighborhood. It is easy to implement. The main limitation of impulse filter is if the image is corrupted. The main objective of the mean filters is to improve picture quality.
Fig 1 Block Diagram of the proposed work
Limitations of average filter are the averaging operation leads to blurring. The equation for the Mean filter for the window 3X3 is
(1)
Where N is no of pixels in the window.
2.3
M
EDIANF
ILTER:
In Median filter each filter output is replaced by median of the value. The neighborhood is taken as 3 by 3. The edges of the images are replaced by zeros. The main advantage of Median filter it preserves the sharpness of the edges.
(2) In this paper Mean filter is used for rough segmentation and Median Filter is used for fine segmentation
3.S
EGMENTATION:
Segmentation of Mammogram images involves classifying it into different parts such as breast boundary, nipple extraction and the pectoral muscle. Efficient region segmentation is still a challenging task because each pixel value in low dose x-ray represents two or more tissue values. Finding an accurate and efficient breast region segmentation technique is still a challenging task in digital mammography. The breast contour classifies the mammogram into breast and non-breast regions.
Fig 2 Pixel Connectivity
The region nearer the breast border has low contrast and it lacks in visibility among the peripheral zone. It is less visible and needs an efficient segmentation algorithm. The algorithm used for efficient segmentation as follows
Step 1: Start the process from Row-I
Step 2: Scan the Image from left side to right side Step 3: Check is the pixel looks as black, if so go to the next pixel else go to step 4
Step 4: If the pixel not in black then go to the next pixel and afterwards go to the step 5
Step 5: If the row is first row set all the pixels as black
N i ix
N
Xn
X
X
MeanFilter
1 2 11
)
,
,
(
2 2
2 2 1 2
1, , ) ,
(X X Xn MEDIAN x x xn er
MedianFilt
Mammographic Images
Mean
Filter Median Filter
Micro- Calcification
Feature
Extraction using Local Binary Pattern (LBP) Region of Interest (ROI) detection Detected
6094 and go to the step 7.
Step 6: Repeat the step 2 to 5 for all the rows
3.1
L
OCALB
INARYP
ATTERNA local binary pattern (LBP) is a method used for extraction and classification of texture features and most widely used for recognition and computer vision applications. The breast cancer abnormalities can be detected from the extracted features of a Mammogram image.
For a given a pixel the LBP code can be computed by comparing the pixel value with its neighbours. The neighboring window size is considered as 3X3.Thresholding applied to each pixel and the result is used to replace the central pixel value. The nearby 8 neighbours are considered for calculation. The input parameters taken are number of neighbours(P) and the radius of comparisons(R).
For a pixel the value of LBP is given as
(3) The estimated LBP value is in decimal form. and are center pixel Gray values. The binary values can be estimated and binary 1 is assigned if the neighbour value is higher than the central pixel value. Else binary 0 is allotted.
Fig 3 Basic LBP Pattern
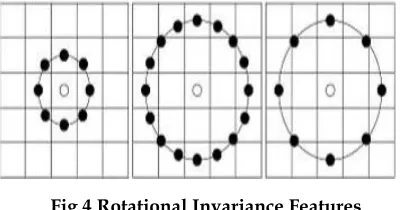
Histogram for LBP pattern is taken to find rotation invariance features of the image. It can be done by grouping the features extracted from the histogram. The LBP is mainly used to determine whether the given pattern is healthy or cancerous.
Fig 4 Rotational Invariance Features
From the selected features histograms has been drawn and training images are obtained. Figure 5 shows gray level histogram obtained for a brain image. The features are extracted from the histogram obtained values.
Fig 5 Gray level Histogram of LBP pattern
4.
S
UPPORTV
ECTORM
ACHINE(SVM)
C
LASSIFIERSupport vector machine is efficient supervised pattern classifier widely used for pattern recognition and classification problems. It is a binary classifier built by constructing a hyper-plane to separate non-members of the given input data. In this way it merges the data in the high dimensional feature space. In a given kernel space linear model is constructed and decision is taken between two datasets. SVM can also be suited for non-linear classification problems. For the given input data set xi, a
group of training classes were constructed and the decision made based on decision function. The hyper plane matches the given function with the relation that
(4)
Fig 6 Classification using SVM Algorithm for the generation of SVM:
Step 1: Load the given Input Dataset Step 2: Select the output signal Attributes
Step 2: Feature classification based on class labels Step 3: Estimate support value for a given Candidate
If (instances! =0) then
Step 4: Support Value=Similarity between the instances
Estimate the error Step 5: For the instance value< 0
Find the Decision value= Support Value/Total Error value for all the points
End
5.R
ESULTS ANDD
ISCUSSION:
The simulations are done by using the MATLAB R2017a. The performance of the filters is estimated based on MSE and PNSR values. In the proposed work, noisy images are denoised by mean and Median filter and the filtered image should be similar to the original image. Mean Square Error(MSE) computes the similarity between the images. The mathematical equation for the estimation of MSE is given as [15]
(5)
The other performance estimation parameter is PSNR, is Peak Signal to Noise Ratio measures peak error between two images. The formula used for the estimation of PSNR is given as [26][27]
)
,
(
x
1y
1P p
i
y
G
Gx
s
y
x
LBP
(
1
,
1
)
(
)
2
1
Gx
Gy
6095 (6)
where MXN are size of the window and I(i,j) is pixel value at the position i,j.
Table 1 shows the performance comparison of Mean and Median Filter for a set of 250 images of window size 3X3.It shows that Median Filter has best MSE and PSNR and also the combined filter have superior response and reduces the noise level. The breast images are considered with different tissue densities. Both the filters can change the characteristics of cluster in micro-classification level.
Table 1: MSE and PSNR comparison of Different Filters
Filtering
Technique Mean Square Error(MSE) Peak Signal to Noise Ratio(PSNR)
Mean Filter 13.25 32.41
Median Filter 26.97 38.54
Combined Mean and Median
Filter
27.9 39.1
Figure 7(a) shows an input image taken from MIAS database, and the combined Mean and Median Filter images was shown7(b) then the image has been segmented using first threshold binarization and given as input to the LBP for feature detection.
Figure 7 (a) Input image (b) Filtered Image
Figure 7(c) Threshold Binarization
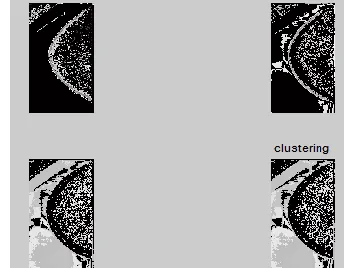
Figure 8(a) feature selected output after clustering. Number of features taken as 128. The accuracy obtained is 94.1%
Figure 8(a) Mammogram output after Clustering
The filtered and threshold images are shown in figure9(b) and 9(d).The filtered images are clustered and classified using SVM classifier and the output shows that it is mildly affected by cancer cells.
6096 (c) Threshold Binarization
(d) Mammogram output after Clustering
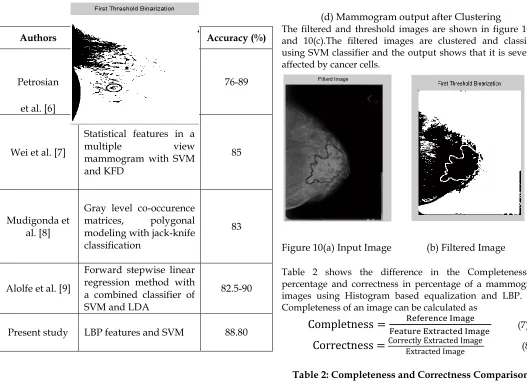
The filtered and threshold images are shown in figure 10(b) and 10(c).The filtered images are clustered and classified using SVM classifier and the output shows that it is severely affected by cancer cells.
Figure 10(a) Input Image (b) Filtered Image
Table 2 shows the difference in the Completeness in percentage and correctness in percentage of a mammogram images using Histogram based equalization and LBP. The Completeness of an image can be calculated as
Completness = Reference Image
Feature Extracted Image (7)
Correctness =Correctly Extracted Image Extracted Image (8)
Table 2: Completeness and Correctness Comparison
Completeness (%) Correctness (%)
Histogram Based
Equalization LBP
Histogram Based
Equalization LBP
93.4 96 91.4 95
A listing of classification methods close to the current study and the accuracy comparison is listed in figure 7.The SVM classifier combined with Local Binary Pattern (LBP) provides good accuracy compared with other methods.
Table 3: Accuracy Comparison of Feature Extracted Methods
6.
C
ONCLUSION:
In this paper the use of Local Binary Pattern(LBP)shows the importance of feature selection. The SVM (Support Vector Machine) classifier model is used to obtain the mammogram affected stages, the clustering
Authors Method used Accuracy (%)
Petrosian
et al. [6]
Spatial gray level dependence and textural features with a decision tree classifier
76-89
Wei et al. [7]
Statistical features in a
multiple view
mammogram with SVM and KFD
85
Mudigonda et al. [8]
Gray level co-occurence matrices, polygonal modeling with jack-knife classification
83
Alolfe et al. [9]
Forward stepwise linear regression method with a combined classifier of SVM and LDA
82.5-90
6097 process get together the features and analyzed in SVM
model. The results of simulation things from MATLAB also give good accuracy. Through this categorized detection approach can be implemented in medical field and obtain the cancer affects of breast. However this enhancement model need more number of databases images trains them and achieves good accuracy.
REFERENCES
[1] Amirhossein Ketabdar and Elham Hashemizadeh, “ Detection of Breast Cancer Using Wavelet Transform and LBP Algorithm”,Journal of knowledge based Engineering and Innovation,2017
[2] Maitra, I.K.,Nag, S., and Bandyopadhyay, S.K.
―Technique forPreprocessing of Digital Mammogram‖(2012), Computer methods and
programs in biomedicine, 107(2), pp.175-188. [3] Jen, C.C., and Yu, S.S. ―Automatic detection of
abnormal mammograms in mammographic images,Expert Systems with Applications‖ (2015)., 42(6), pp.3048-3055
[4] Issam El-Naqa et al., ― A Support Vector Machine Approach for Detection of Micro calcifications‖, IEEE Transactions on Medical Imaging, VOL. 21, NO. 12, December 2002
[5] Petrosian A, Chan HP, Helvie MA, Goodsitt MM,
Adler DD. Computer-aided diagnosis in
mammography: Classification of mass and normal tissue by texture analysis. Phys Med Biol 39, 2273– 2288, (1994).
[6] S.D.Tzikopoulos, M. E. Mavroforakis, H. V. Georgiou, N. Dimitropoulos,and S. Theodoridis, ―A fully
automated scheme for mammographic
segmentation and classification based on breast density and asymmetry,‖ Computer. Methodologies. Prog. Bio., vol. 102, no. 1, pp.47–63, 2011.
[7] R. J. Ferrari, R. M. Rangayyan, J. E. L. Desautels, and A. F. Frere,―Analysis of asymmetry in mammograms via directional filtering with Gabor wavelets,‖ IEEE Trans.Med. Imag., vol. 20, no. 9, pp. 953–964,Sep. 2001.
[8] Hasan Moslemi, Iman Abaspur Kazerouni , Fatemeh Hourali, ―Breast cancer diagnosis in mammogram images using coordinate logic filters‖,Biomedical Research 2017; 28 (22): 10108-10111
[9] Armen Sahakyan, Hakop Sahakyan, ―Segmentation of the Breast Region in Digital Mammograms and Detection of Masses‖, International Journal of Advanced Computer Science and Applications, Vol. 3, No.2, 2012
[10] D.Devakumari , V.Punithavathi, ―Comparison of Noise Removal Filters for Breast Cancer Detection in Mammogram Images‖,International Journal of Pure and Applied Mathematics,Volume 119 No. 18 2018, 3863-3874
[11] Gaurav Agarwal and Pooja Ramakant, ―Breast Cancer Care in India: The Current Scenario and the
Challenges for the Future‖, Breast Care (Basel). 2008 Mar; 3(1): 21–27.
[12] R E Bird, T W Wallace, B C Yankaskas, ―Analysis of cancers missed at screening mammography‖, Journal of Radiology. 1992 Sep;184(3):613-7.
[13] Singh, V., Rajpal, N. and Murthy, K. S. (2008). A Neuro Fuzzy Model for Image Compression in Wavelet Domain,‖ in Image and Signal Processing: 3rd International Conference, ICISP 2008. Cherbourg-Octeville, France, July 1 - 3, 2008. Proceedings, A. Elmoataz, O. Lezoray, F. Nouboud, and D. Mammass, Eds. Berlin, Heidelberg: Springer Berlin Heidelberg, 46–58
[14] P. Casti, A.Mencattini, andM. Salmeri, ―Characterization of the breastregion for computer
assisted Tabár masking of paired
mammographicimages,‖ in Proc. 25th Int. Symp. IEEE Comput.-Based Med. Syst.,2012, pp. 1–6. [15] E.Geetha, K.Ramudu, ―Breast Cancer Detection
Using LBP and DWT Features‖, International
Journal of Advanced Research in
Electrical,Electronics and Instrumentation Engineering, Vol. 6, Issue 7, July 2017
[16] M. A. Oliver, ―Determining the spatial scale of variation in environmentalproperties using the
variogram,‖ in Modelling Scale in
GeographicalInformation Science, N. Tate and P. M. Atkinson, Eds.New York: Wiley, 2001, pp. 193–219. [17] Z. Wang, A. C. Bovik, H. R. Sheikh, and E. P.
Simoncelli, ―Imagequality assessment: From error visibility to structural similarity,‖ IEEETrans. Image Process., vol. 13, no. 4, pp. 600–612, Apr. 2004. [18] M. P. Sampat, Z. Wang, S. Gupta, A. C. Bovik, and
M. K. Markey,―Complex wavelet structural similarity: A new image similarityindex,‖ IEEE Trans. Image Process., vol. 18, no. 11, pp. 2385– 2401,Nov. 2009.
[19] J. Portilla and E. P. Simoncelli, ―A parametric texture model based onjoint statistics of complex wavelet coefficients,‖ Int. J. Comput. Vis.,vol. 40, no. 1, pp. 49–71, 2000.
[20] F. J. Ayres and R. M. Rangayyan, ―Design and performance analysisof oriented feature detectors,‖ J. Electron. Imag., vol. 16, no. 2, p. 12,Apr. 2007. [21] S. Banik, R. M. Rangayyan, and J. E. L. Desautels,
―Detection of architecturaldistortion in prior mammograms,‖ IEEE Trans. Med. Imag.,vol. 30, no. 2, pp. 279–294, Feb. 2011.
[22] M. Heath, K. Bowyer, D. Kopans, R. Moore, and W. P. Kegelmeyer,―The digital database for screening mammography,‖ in Proc. 5th Int.Workshop Digital Mammogr., 2001, pp. 212–218.
6098 in Proc. IEEEe-Health and Bioeng. Conf., Iasi,
Romania, Nov. 21–23, 2013.