Top pair production at ATLAS
Andrey Loginov1,a
on behalf of the ATLAS Collaboration
1Yale University, Physics Department
Abstract.
An overview of latest ATLAS measurements of top pair (t¯t) production in proton-proton collisions at the LHC at centre-of-mass energies of 7 and 8 TeV is presented. Measurements of the t¯t production cross section (σt¯t)
in various decay channels, including analyses of differentialσt¯tdistributions and a study of jet multiplicity in t¯t production, as well as searches for t¯t resonances using boosted top techniques and standard methods, are
discussed.
1 Introduction
To date, in pp collision data at the center-of-mass energies
of √s=7 TeV and√s=8 TeV, the CERN Large Hadron
Collider (LHC) has successfully delivered two orders of magnitude more top quarks than the Fermilab Tevatron Collider. The top-antitop (t¯t) cross section (σt¯t) precision measurements test the Standard Model (SM) [1] theoreti-cal predictions, which nowadays have percent level
accu-racy [2]. Differential measurements of t¯t production are
especially important for discrimination between different
Monte Carlo generators, QCD models and parton distri-bution functions (PDFs). In addition, future top quark studies will become the best way to constrain
systemat-ics on b-tagging as well as c/b-jet energy scales. On top
of that, t¯t events are an important background in various Higgs boson analyses as well as beyond the SM searches, and it is therefore crucial to understand this process in
de-tail. New physics [3, 4] can affect both the t¯t production
and decay, modifying the observedσt¯tdifferently in
dif-ferent decay channels and/or affecting differential distri-butions. In this scenario, it is critical to correctly eval-uate all the contributions from SM processes, hence the backgrounds are determined using data-driven techniques whenever possible [5]. In these proceedings an overview of latest ATLAS [6] measurements of t¯t production at the LHC at centre-of-mass energies of 7 and 8 TeV is pre-sented.
2
σ
t¯tin
τ
had+ jets channel at
√
s
= 7 TeV
In theτhad+jets channel, one of the top quarks t → Wb
decays produce a tau lepton which then decays hadroni-cally, a b-quark and a neutrino, and the other top quark
decays hadronically. This study [7] provides the first
measurement of the top quark pair cross section in this
ae-mail: loginov@fnal.gov
track n
0 2 4 6 8 10 12 14 16 18
Events
0 20 40 60 80 100 120 140 160 180 200
Data 2011 Fit [All]
& Electron] had
τ
Fit [
Fit [Combinatorics] Fit [Multijets] ATLAS Preliminary
= 7 TeV s -1 L dt = 1.67 fb
∫
Figure 1: The ntrack distribution forτhadcandidates after
all selection cuts [7]. The black circles correspond to data, while the solid histogram is the result of the fit. The red, blue and magenta dashed curves show the fitted contribu-tions from tau and electron “signal”, and the multijets and combinatorics backgrounds, respectively.
channel. In addition, the final state is highly relevant
for searches beyond the SM. For instance, an enhanced
branching fraction in this channel can be a sign of t →
bH±(H±→τ±ν) [8].
Trigger requirements for the analysis are≥4 jets with
ET > 10 GeV (≥ 2 should be identified as b-jets by the
High Level Trigger). The offline event selection requires
≥5 jets, including≥2 b-jets selected with a tagger
oper-ating at 60% efficiency (which corresponds to light flavor
jets rejection of 340), and missing transverse momentum (Emiss
T ) satisfying E
miss T /(0.5×
√
ΣET)>8, whereΣETis is the scalar sum of the transverse energy of all objects enter-ing the Emiss
T calculation; events with electrons and muons
are excluded from the analysis. The 3 jets (including the b-jet with the highest b-tagging weight), that give the
high-est j jb transverse momentum (pT) are identified as coming
Table 1: Systematic uncertainties (%) on the inclusiveσt¯tmeasurement at √s=8 TeV in the lepton+jets channel [9].
Source e+≥3 jets µ+≥3 jets combined
Jet/MET reconstruction, calibration 6.7, -6.3 5.4, -4.6 5.9, -5.2
Lepton trigger, identification and reconstruction 2.4, -2.7 4.7, -4.2 2.7, -2.8
Background normalization and composition 1.9, -2.2 1.6, -1.5 1.8, -1.9
b-tagging efficiency 1.7, -1.3 1.9, -1.1 1.8, -1.2
MC modelling of the signal ±12 ±11 ±11
Total ±14 ±13 ±13
from t→Wb→ j jb. The remaining non-b highest pTjet
with pT > 40 GeV and |η| < 2.5 is the hadronicτ
can-didate. For theτhad candidate a variable ntrack =n1+n2
is defined, where n1 is the number of ‘inner’ tracks with
∆R(track, τhad) < 0.2, track pT > 1 GeV; and n2 is the number of ‘outer’ tracks in 0.2 < ∆R(track, τhad) < 0.6, track pT>0.5 GeV. This variable provides decent
separa-tion between a realτhadand multijet background.
To extract the signal from the ntrack distribution, the
data sample is fitted with three templates, as shown in Fig. 1: a tau and electron template (real electrons from t¯t events, either prompt or from leptonic tau decays, con-tribute significantly to the signal region); a multijets tem-plate (gluon-initiated fake taus from multijets); and a com-binatorics template (quark-initiated fake taus from ttbar).
Then a τ/(τ +e) ratio correction is done using Monte
Carlo simulation, and the resulting cross section isσt¯t =
200±19 (stat)±43 (syst) pb. Dominant systematics for
the analysis are initial and final state radiation, ISR/FSR
(12%) and b-jet tagging (10%) uncertainties.
3
σ
t¯tin lepton + jets channel at
√
s
= 8 TeV
This analysis [9] is based on the lepton+jets final state,
where one of the W bosons decays leptonically (W → eν
or W → µν), while the other decays hadronically (W →
j j). The selection criteria are similar to those used for
the σt¯tmeasurement at 7 TeV with a few improvements
to cope with harsher pile-up conditions. For example, the
lepton pT cut is raised to 40 GeV, and the jet vertex
frac-tion (a variable that quantifies the fracfrac-tion of track trans-verse momentum associated to a jet that comes from the
hard-scattering interaction)>0.5 requirement is added to
suppress jets originating from pile-up collisions.
A multivariate likelihood method is used to provide signal-to-background discrimination using lepton
pseudo-rapidity and transformed event aplanarity, A′=exp(−8A),
where A is event aplanarity, as shown in Fig. 2. The
number of t¯t events in data is determined from a fit to a distribution of the multivariate likelihood discriminant in data. The resulting cross section isσt¯t=241±2 (stat.)± 31 (syst.)±9 (lumi.) pb is in good agreement with theoret-ical predictions,σtheort¯t y = 238+22
−24 pb. The dominant
sys-tematic uncertainty is modelling of the t¯t signal in Monte Carlo as shown in Table 1.
Events / 0.05
0 1 2 3 4 5
3
10
×
3 jets
≥
e+
ATLAS Preliminary -1
Ldt = 5.8 fb
∫
s = 8 TeVData t
t W+Jets Multijet Z+Jets Single Top Dibosons
A’
0 0.2 0.4 0.6 0.8 1
Data / Expectation 0.8 1 1.2 1.4
(a) Transformed aplanarity, e+jets
Events / 0.25
0 1 2 3 4 5 6 7
3
10
×
3 jets
≥
+
µ
ATLAS Preliminary -1
Ldt = 5.8 fb
∫
s = 8 TeVData t
t W+Jets Multijet Z+Jets Single Top Dibosons
η
muon
-3 -1.8 -0.6 0.6 1.8 3
Data / Expectation 0.8 1 1.2 1.4
(b) Muon pseudorapidity,µ+jets
Figure 2: (a) Transformed aplanarity A′ = exp(−8A)
(where A is aplanarity) distribution in the e+jets
chan-nel; (b) Muon pseudorapidity (η) distribution in theµ+jets channel. The distributions in the data (dots) are compared to the model expectations, which include both signal and background processes [9]. The hatched bands display the combined statistical and systematic uncertainties.
4 Differential
σ
t¯tin the lepton + jets
channel at
√
s
= 7 TeV
Differential cross section measurements allow for a test of
QCD calculations (and a test of the Standard Model). The analysis [10] focuses on three observables of the t¯t system: the invariant mass (mt¯t), the transverse momentum (pT,t¯t)
and the rapidity (yt¯t). Events are selected in the lepton
(electron or muon)+jets channel, requiring 1 high-pTe or
µ, at least 4 high-pTjets (at least one should be b-tagged), large Emiss
T and transverse mass of the lepton-E
miss
T system.
Events consistent with the top pair hypothesis, as de-fined by a kinematic likelihood fit of the t¯t system, are
used. The differential cross sections are normalized to the
total t¯t production cross section. To enable direct
com-parisons to theoretical models, the differential
distribu-tions are unfolded to account for detector effects and
cor-rected for acceptance effects as shown in Fig. 3. Bin sizes
[ 1/ T eV tt /dmtt σ dtt σ 1/ -3 10 -2 10 -1 10 1 data NLO (MCFM) NLO + NNLL
ATLAS
-1 L dt = 2.05 fb
∫ NLO/Data 0.5 1 1.5 [GeV] t t m
300 1000 2000
NNLO/Data 0.5 1 1.5 (a) [ 1 /T e V tt /dmtt σ dtt σ 1/ -3 10 -2 10 -1 10 1 data NLO (MCFM) ALPGEN MC@NLO ATLAS -1 L dt = 2.05 fb
∫
[GeV]
t t
m
300 1000 2000
Theory/Data 0.81 1.2 1.4 (b) [ 1 /T e V t T ,t /dptt σ dtt σ 1/ -2 10 -1 10 1 10 data NLO (MCFM) ALPGEN MC@NLO ATLAS -1 L dt = 2.05 fb
∫
[GeV]
t T,t
p
7 10 20 100 200 1000
Theory/Data 0.5 1 1.5 (c) /dytt σ dtt σ 1/ -1 10 1 data NLO (MCFM) ALPGEN MC@NLO ATLAS -1 L dt = 2.05 fb
∫
t t
y
-3 -2 -1 0 1 2 3
Theory/Data
1 1.2
(d)
Figure 3: Relative differential cross section versus (a-b) mt¯t, (c) pT,t¯tand (d)yt¯t[10]. The relative cross section is compared
to the NLO prediction from MCFM [11]. For mt¯tthe results are also compared with the NLO+NNLL prediction [12]. The
measured uncertainty represents 68% confidence level including both statistical and systematic uncertainties. The bands represent theory uncertainties.
Jet-related uncertainties are dominant for mt¯t and pT,t¯t ,
whereas foryt¯tthe dominant contributions are from fake
leptons and FSR in addition to the jet uncertainties.
5 Jet multilplicity in
t¯t
events
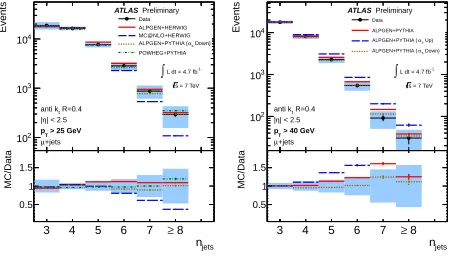
A measurement of t¯t production with additional jets, as a function of the jet transverse momentum, is important for constraining models of initial and final state radiation at the scale of the top quark mass, as well as to provide a test of perturbative QCD in the LHC energy regime. The
analysis [13] is done in the lepton+jets channel with the
event selection similar to the one outlined in Sect. 4. Jet multiplicity measurements are then performed for
four jet pTthresholds (25, 40, 60, and 80 GeV) after
cor-rection for detector efficiencies, resolution effects and bi-ases, through unfolding, as shown in Fig. 4. The measure-ments are presented within a kinematic range correspond-ing to the acceptance of the reconstruction-level event se-lection. The uncertainty of the measurements is dominated by systematics in all regions. Systematic uncertainties are propagated through unfolding using pseudo-experiments. The unfolded data distributions are compared to various Monte Carlo simulation models.
ISR/FSR variations are implemented by changing the
αs (setting the ktfac parameter to 0.5 and 2.0) within the
ALPGEN matrix element calculation, while keeping the
αs used for the PDF and parton shower fixed. The
varia-tions are referred to asαs-up (ktfac 0.5) andαs-down (kt-fac 2.0) variations. Based on this comparison, MC@NLO
+ HERWIG as well as ALGPEN+PYTHIA withαs-up
variation are disfavored by data as shown in Fig. 4.
6
t¯t
resonances
The analyses in this section present the results of a search for resonant production of heavy new particles decaying to
top quark pairs in lepton+jets and all-hadronic channels.
Many new physics scenarios predict the existence of heavy particles that decay to top quark pairs. Limits are set for
Events 2 10 3 10 4 10 Data ALPGEN+HERWIG MC@NLO+HERWIG Down) s α ALPGEN+PYTHIA ( POWHEG+PYTHIA ATLAS Preliminary -1
L dt = 4.7 fb ∫
= 7 TeV s R=0.4
t anti k | < 2.5
η
|
> 25 GeV T p +jets µ jets n
3 4 5 6 7 ≥ 8
MC/Data
0.5 1 1.5
(a) Muon channel, jet pT>25 GeV
Events 2 10 3 10 4 10 Data ALPGEN+PYTHIA Up) s α ALPGEN+PYTHIA ( Down) s α ALPGEN+PYTHIA ( ATLAS Preliminary -1
L dt = 4.7 fb ∫
= 7 TeV s R=0.4
t anti k | < 2.5
η
|
> 40 GeV T p +jets µ jets n
3 4 5 6 7 ≥ 8
MC/Data
0.5 1 1.5
(b) Muon channel, jet pT>40 GeV
Figure 4: The particle-jet multiplicities [13] for the
muon channel and the jet pT thresholds (a) 25, (b) 40
GeV. The data are shown in comparison with (a)
ALP-GEN+HERWIG, ALPGEN+PYTHIA (αs-down
varia-tion), MC@NLO+HERWIG and POWHEG+PYTHIA
Monte Carlo models, and (b) ALPGEN+PYTHIA and
ALPGEN+PYTHIAαs-up andαs-down variations. The
data points are shown in black, whereas the total
uncer-tainty (syst. +stat.) is shown as a shaded band. The MC
predictions are shown with their statistical uncertainty.
two distinct classes of models, namely for Z′bosons
(nar-row t¯t resonances) [14] and for Kaluza-Klein gluons (wide t¯t resonances) [15]. The boosted reconstruction technique employed in the analyses is especially important for high invariant mass t¯t resonances as the top quark decay prod-ucts become more collimated and start to merge.
6.1 Lepton + jets channel
This search uses a combination of resolved and boosted re-construction schemes. In the resolved rere-construction, the
standard ATLAS lepton+jets event selection is used. For
E
v
e
n
ts
/
T
e
V
1 10 2 10
3 10
4 10
5 10
6
10 DataSingle top tW+jetst
Multi-jets Z+jets Diboson
0 0.5 1 1.5 2 2.5 3 3.5
ATLAS Preliminary
= 7 TeV s -1 L = 4.66 fb
∫
[TeV]
t t
m
Data/MC 0
1 2
0 0.5 1 1.5 2 2.5 3 3.5
Figure 5: Comparison of the data and the Standard Model prediction for the t¯t invariant mass for combined resolved
and boosted selections in the summed e+jets andµ+jets
channels [22]. The shaded areas indicate the total system-atic uncertainties
boosted reconstruction was collected with a single
large-radius (R = 1.0) jet trigger with transverse momentum
threshold of 240 GeV. Offline selection requires one
high-pT anti-kt [21] jet with∆R=1.0, pT > 350 GeV and a
mass larger than 100 GeV. Additionally, because the an-gular distance between the charged lepton and the b-quark decreases as the top quark is boosted more, an isolation requirement with shrinking cone size (‘mini-isolation’) is used for leptons [22]. The resolved and boosted selec-tions are kept exclusive so that limits can be set on the combined result. Selected data events and expected back-ground yields after the resolved or boosted selections are summarized in Table 2.
Figure 5 shows the resulting mt¯tdistributions for the
combined resolved and boosted selections for the sum of electron and muon channels. The dominant systematic un-certainty comes from the jet energy scale. The existence
of a narrow leptophobic topcolor Z′in the range 0.5 TeV
< mZ′ <1.7 TeV is excluded at 95% Confidence Level
(CL). A wide Kaluza-Klein (KK) gluon for masses be-tween 0.7 TeV and 1.9 TeV is also excluded at 95% CL.
Table 2: Selected data events and expected background yields after the resolved or boosted selections [22]. The uncertainties on the normalization of the expected back-ground yield are listed.
Type Resolved selection Boosted selection
t¯t 44 113±4 720 917±98
Single top 3 243±250 49±4
Multi.jets 3 321±1 660 30±15
W+jets 2 359±472 46±9
Z+jets 539±259 8.5±4.1
Di-bosons 124±43 0.86±0.29
Total 57 978±5 170 1 118±101
Data 61 573 1 080
6.2 All-hadronic channel
In this analysis [23] the final states with high-pTtop quarks that decay hadronically and where the decay products are collimated in the direction of the top-quark are considered.
Such searches require the top quarks to have pTin excess
of 200–300 GeV and require rejection of the large back-ground of gluon jets, light-quark jets, as well as c- and b-jets. The all-hadronic signature studied in the analysis is complementary to the one presented in Sect. 6.1. Two complementary algorithms are used in the analysis to iden-tify top-quark decays and reconstruct the top-quark mo-mentum.
The first method is the HEPTopTagger algorithm [16, 17] that tests the substructure of a jet reconstructed with
the Cambridge/Aachen (C/A) algorithm [18] with∆R=
1.5 for its compatibility with a hadronic top quark decay.
This method is efficient for jets with pT >200 GeV, and
it works by forming subjets in the bigger ∆R = 1.5 fat
jet, removing soft contamination, and then reconstructing t → Wb→bqq decay products and testing compatibility of subjets with the W boson and top quark decays. The candidate top jet mass cut used for the method is 140-210 GeV.
The second method is the Top Template Tagger al-gorithm [19, 20] that compares templates of boosted top quark decays to the observed energy deposits to find the best match. The Top Template Tagger uses jets
recon-structed with the anti-ktalgorithm with a distance
param-eter of∆R=1.0 and is optimised to identify top quarks
with pT >500 GeV. The candidate top jet mass cut used
for the method is 122-222 GeV.
Table 3: Expected (Exp.) and observed (Obs.) exclusion
regions on the leptophobic Z′boson and Randall-Sundrum
KK gluon masses [23].
Model Obs. Limit (TeV) Exp. Limit (TeV)
HEPTopTagger
Z′ 0.70<m
Z′<1.00 0.68<mZ′<1.16
1.28<mZ′<1.32
KK gluon 0.70<mgKK<1.48 0.70<mgKK <1.52
Top Template Tagger
KK gluon 1.02<mgKK<1.62 1.08<mgKK <1.62
Combined (Observed Limit)
Z′ 0.70<m
Z′ <1.00, 1.28<mZ′<1.32
KK gluon 0.70<mgKK <1.62
For the HEPTopTagger, to avoid relying on a particular topology, the trigger is a) at least 1 jet with ET>100 GeV
and large ΣET OR b) at least 5 jets with ET > 50 GeV.
For the Top Template Tagger, the events are selected by the trigger that requires one anti-kt∆R=1.0 jet with ET > 240 GeV. For the event selection, at least two fat jets are required for both algorithms. For the HEPTopTagger the
jet pT is required to be greater than 200 GeV, while for
the Top Template Tagger the leading (subleading) jet pT
is required to be greater than 500 (450) GeV.
500 1000 1500 2000 2500 3000
Events / 100 GeV
0 50 100 150 200 250 300 350
Data 2011
= 1.3 pb σ Z' (1 TeV)
t t
Multijet
ATLAS
-1 L dt = 4.7 fb
∫
= 7 TeV s
HEPTopTagger
(a) HEPTopTagger
1000 1500 2000 2500 3000
Events / 100 GeV
5 10 15 20 25 30 35
Data 2011
= 0.35 pb σ (1.6 TeV) KK g
t t Multijet
ATLAS
= 7 TeV s
-1
L dt = 4.7 fb
∫
Top Template Tagger
(b) Top Template Tagger
Figure 6: Distributions of the t¯t invariant mass mt¯tfor the HEPTopTagger and the Top Template Tagger data [23].
∆R=1.4(0.4) around the axis of a fat jet are required for HEPTopTagger (Top Template Tagger) analysis.
The results obtained with the two methods are shown
in Fig. 6 together with a hypothetical Z′signal with m
Z′=
1 TeV (a) and a hypothetical KK gluon signal with mKKg=
1.6 TeV (b). To combine the limits from these two
anal-yses, the results from the tagger with the lower expected exclusion limit are selected, as summarized in Table 3.
7 Summary
To summarize, LHC keeps providing top quarks in un-precedented quantities, which allows detailed precision measurements and detailed studies. Top quark physics at LHC is a crucial milestone in both measuring the proper-ties of the top quark, the heaviest particle discovered so far, and in searches for heavy mass physics beyond the Standard Model, to which the top quark pair production process is often an important background.
References
[1] S.L. Glashow, Nucl. Phys. 22 588, (1961); S. Wein-berg, Phys. Rev. Lett. 19 1264, (1967); A. Salam, Proc. 8th Nobel Symposium, Stockholm, (1979).
[2] M. Aliev, H. Lacker, U. Langenfeld, S. Moch, P. Uwer and M. Wiedermann, Comput. Phys. Commun. 182, 1034 (2011) arXiv:1007.1327 [hep-ph].
[3] For instance, a t′decaying in Wq would mimic the t¯t
lepton+jets signature. J. Silva-Marcos, J. High Energy
Phys. 0212, 036 (2002); S. Sultansoy et al., Acta Phys. Polon. B37, 2839 (2006).
[4] J. R. Incandela, A. Quadt, W. Wagner,
D. Wicke, Prog.Part.Nucl.Phys. 63,239-292,2009;
arXiv:0904.2499v3 [hep-ex].
[5] A. Loginov, Nuovo Cim. C 033N4, 175 (2010), ATL-PHYS-PROC-2010-067.
[6] ATLAS Collaboration, JINST 3, S08003 (2008). [7] ATLAS Collaboration, ATLAS-CONF-2012-032. [8] ATLAS Collaboration, ATLAS-CONF-2012-011. [9] ATLAS Collaboration, ATLAS-CONF-2012-149. [10] ATLAS Collaboration, arXiv:1207.5644 [hep-ex],
submitted to Eur. J. Phys. C.
[11] J. Campbell, K. Ellis, C. Williams.
http://mcfm.fnal.gov/.
[12] V. Ahrens, A. Ferroglia, M. Neubert, B. D. Pecjak, and L. L. Yang, JHEP 1009 (2010) 097, arXiv:1003.5827 [hep-ph].
[13] ATLAS Collaboration, ATLAS-CONF-2012-155.
[14] R. M. Harris, C. T. Hill and S. J. Parke,
hep-ph/9911288.
[15] K. Agashe, A. Belyaev, T. Krupovnickas, G. Perez and J. Virzi, Phys. Rev. D 77, 015003 (2008),
hep-ph/0612015; B. Lillie, L. Randall and L. -T. Wang,
JHEP 0709, 074 (2007), hep-ph/0701166.
[16] T. Plehn, G. P. Salam, and M. Spannowsky, Phys. Rev. Lett. 104 (Mar, 2010) 111801, arXiv:0910.5472. [17] T. Plehn, M. Spannowsky, M. Takeuchi, and D.
Zer-was, JHEP 1010 (2010) 078, arXiv:1006.2833. [18] Y. Dokshitzer, G. Leder, S. Moretti, and B. Webber,
JHEP 9708 (1997) 001, hep-ph/9707323.
[19] L. G. Almeida, S. J. Lee, G. Perez, G. Sterman, and I. Sung, Phys. Rev. D 82 (Sep, 2010) 054034, arXiv:1006.2035.
[20] L. G. Almeida, O. Erdogan, J. Juknevich, S. J. Lee, G. Perez, and G. Sterman, Phys.Rev. D 85 (2012) 114046, arXiv:1112.1957.
[21] M. Cacciari, G. P. Salam and G. Soyez, JHEP 0804, 063 (2008), arXiv:0802.1189 [hep-ph].
[22] ATLAS Collaboration, ATLAS-CONF-2012-136. [23] ATLAS Collaboration, JHEP 1301, 116 (2013),
![Figure 1: The ntrack distribution for τhad candidates afterall selection cuts [7]. The black circles correspond to data,while the solid histogram is the result of the fit](https://thumb-us.123doks.com/thumbv2/123dok_us/8755035.1435732/1.595.325.519.340.475/figure-distribution-candidates-afterall-selection-circles-correspond-histogram.webp)

![Figure 5: Comparison of the data and the Standard Modelprediction for theand boosted selections in the summedchannels [22]](https://thumb-us.123doks.com/thumbv2/123dok_us/8755035.1435732/4.595.58.280.76.239/figure-comparison-standard-modelprediction-theand-boosted-selections-summedchannels.webp)
![Figure 6: Distributions of the tt¯ invariant mass mtt¯ for the HEPTopTagger and the Top Template Tagger data [23].](https://thumb-us.123doks.com/thumbv2/123dok_us/8755035.1435732/5.595.100.503.73.257/figure-distributions-invariant-mass-heptoptagger-template-tagger-data.webp)
