Balan P. et al., J. Sci. Res. Phar. 2014, 3(1), 33-37
J
ournal of
S
cientific
R
esearch in
P
harmacy
Research Article
Available online through
ISSN: 2277-9469
www.jsrponl
ine.com
Development and Validation of Stability-Indicating RP-UPLC Method for Simultaneous Estimation of
Etodolac and Paracetamol in Combined Dosage Form
Balan. P1*, Kannappan. N2
1Research Scholar, Faculty of Pharmacy, PRIST University, Thanjavur, Tamil Nadu, India. 2Associate Professor, Annamalai University, Annamalai Nagar,Tamil Nadu, India.
Received on: 17-03-2014; Revised and Accepted on: 28-03-2014
ABSTRACT
A
stability indicating Reverse Phase - Ultra Performance Liquid Chromatography (RP-UPLC) method was developed and validated for the simultaneous determination of Etodolac (EDC) and Paracetamol (PCM) in tablet dosage form. The chromatographic separation was performed on Thermo Scientific UPLC, Accela 1250 Pump, and auto sampler with PDA detector, using column Thermo Scientific hypersil gold C18,50 x 2.1mm, particle size 1.9µm and using 5% ammonium acetate buffer, methanol and acetonitrile in the ratio of 40:40:20 as mobile phase ata flow of 250µl/min with the detection at 236nm. The run times of the PCM and EDC were about 0.538 and 0.835 minutes respectively. The detector response is linear from 12.8µg to 19.2µg and 10.4µg to 15.6µg concentration for EDC and PCM respectively. The respective linear regression equation being y = 297078x-365.9 (r2 = 0.9999) for EDC and y= 50931x-319.3 (r2 = 0.9997) of PCM. The limit of detection and limit of
quantification was 0.05µg and 0.18µg for EDC and 0.03µg and 0.12µg for PCM. The percentage of assay of EDC and PCM were about 99.91% and 99.97% respectively. The stability indicating capability was established by forced degradation experiments. The method was satisfactorily validated as per the ICH guidelines.
Keywords: Etodolac; Paracetamol; Stability indicating; Method development; UPLC; Validation.
INTRODUCTION
E
todolac, a Non Steroidal Anti-Inflammatory Drug (NSAID), is chemically described as 1,8-diethyl-1,3,4,9-tetrahydropyrano-(3,4-b)indole-1-acetic acid [1, 2] (Fig. 1) and heterogeneous large groups of drugs which suppress inflammation in a manner similar to steroids, but less side effects of sedation, respiratory depression, or addiction than steroids. They are widely used for the treatment of inflammatory disorders and painful conditions such as rheumatoid arthritis, gout, bursitis, painful menstruation, and headache. They are effective in the relief of pain and fever. NSAIDs inhibit the cyclooxygenase (COX) activity resulting in decreased synthesis of prostaglandin, leukotriene and thromboxane precursors such as the ubiquitous enzyme which catalyzes the initial step in the synthesis of prostanoids. Prostanoid is any of a group of C-20 fatty acids complex with an internal five or six carbon rings such as prostaglandins, prostanoic acid, prostacyclins, and thromboxane; derived from arachidonic acid (C-20 polyunsaturated fatty acid with four cis double bonds). The action or the synthesis of prostanoids are involved in the modulation of a variety of pathophysiologic processes including inflammation, hemostasis, thrombosis, cytoprotection, ulceration, hemodynamics and other the progression of kidney diseases.
Fig. 1: Chemical Structure of Etodolac Fig. 2: Chemical Structure of Paracetamol
*Corresponding author:
P.Balan, M.Pharm., Research Scholar,
Faculty of Pharmacy, PRIST University, Thanjavur -613403, Tamil Nadu, India. Tel: +91 9698798284.
*E-Mail: [email protected]
Paracetamol is also a NSAID. It is chemically described as (4-hydroxy phenyl) acetamide, [3, 4] (Fig. 2) it inhibits the cyclooxygenase (COX) activity resulting in decreased synthesis of prostaglandin, leukotriene and thromboxane precursors such as the ubiquitous enzyme which catalyzes the initial step in the synthesis of prostanoids. It is readily absorbed from the gastro intestinal tract with peak plasma concentrations occuring about 10-60 min after oral administration.distribution into most body tissues.
For the present study the combination of Etodolac and Paracetamol was selected. Few methods are available to estimate these drugs by Spectroscopy [5-9] and HPLC methods [10-13]. The extensive literature survey revealed that UPLC method was not yet reported for the simultaneous estimation of these drugs. Hence the present study was aimed to develop a simple, rapid, specific, precise, accurate and validated UPLC method for the simultaneous estimation of these drugs in combined dosage forms.
MATERIALS AND METHODS
Materials:
Etodolac was obtained from Exon Laboratories Pvt Ltd, Maharashtra and Paracetamol was obtained from Granules (India) Limited, Hyderabad. Water (HPLC grade), Acetonitrile (HPLC grade), Methanol (HPLC grade) and Ammonium Acetate were of Analytical grade purchased from Merck. The commercial combination of Etodolac (400mg) and Paracetamol (350mg) that is ETOVA-P tablet (IPCA Laboratories. Ltd. Mumbai) was purchased from local drug store.
Instrumentation:
A Thermo Scientific UPLC, Accela 1250 Pump, and auto sampler (10 µl loop) with PDA detector, and column Thermo hypersil gold C18, 50 x 2.1mm (Dim), particle size 1.9µm. The UPLC system was equipped with CHROMQUEST software for data processing. Sartorius analytical Micro balance, Ultra Sonicator (DC1500H MRC), pH meter (MKVI Systronics), Micropipettes and Micro-pore filtration assembly etc were also used.
Chromatographic Conditions:
Balan P. et al., J. Sci. Res. Phar. 2014, 3(1), 33-37
methanol: acetonitrile (40:40:20), was found to resolve EDC and PCM. The mobile phase was filtered on a 0.22 micron membrane filter and then ultrasonicated for 15 min. The injection volume was 10µl. The flow rate was set to be 250µl/min. The 236nm wavelength was selected with PDA detector for analysis. All determinations were performed at constant column temperature (25 ± 20C). The total run time of the analysis is 3 min. The retention time of the PCM and EDC is 0.538min and 0.835min respectively
Preparation of standard solution:
The standard stock solutions were prepared by transferring 40mg of EDC and 32.5mg of PCM working standards in 100ml volumetric flask and dissolved with methanol upto the mark. From the standard stock solution 1ml was taken into 25ml flask, further diluted with mobile phase to get the final concentration of 13 µg/ml of EDC and 16 µg/ml of PCM.
Preparation of Sample Solution:
Accurately weighed 10 tablets were triturated with a mortar and pestle. An amount equivalent to 40mg of EDC and 32.5mg of PCM sample was transferred to a 100ml clean volumetric flask, diluted with 50ml methanol and sonicate to dissolve it completely and make up the volume with the same solvent. Further 1ml of the EDC and PCM of above stock solution was taken into a 25ml volumetric flask, diluted with mobile phase and analyzed under optimized chromatographic conditions. The chromatogram was depicted. The results of analysis were given in Table. 1 and the chromatogram were given in Fig. 3.
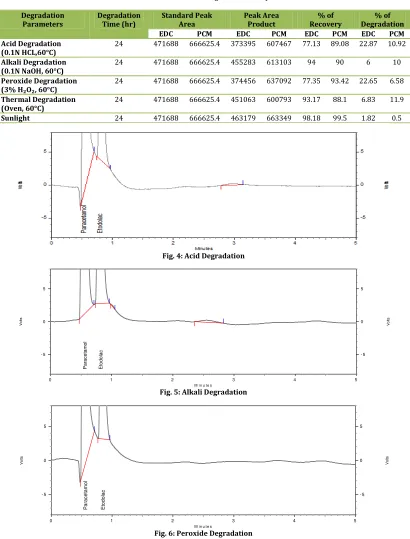
Forced Degradation Studies:
Forced degradation studies were performed to demonstrate selectivity and stability indicating capability of the proposed method. The sample was exposed to various degradation conditions [14, 15] – acidic (0.1N HCL, 60ºC, 24 hours), alkaline (0.1N NaOH, 60ºC, 24 hours), oxidization (3% H2O2, 60ºC, 24 hours), thermal (60ºC, 24 hours) and sunlight (24 hours). Both EDC and PCM were found to be highly sensitive to acidic, alkali and oxidative degradation. The assay value was dropped in all the above mentioned conditions, the result of Forced degradation studies were given in Table. 2 (Fig.4, 5, 6 and Fig. 7). However no major degradation was found in sunlight.
Method Validation:
After satisfactory development of method it was subjected to method validation as per ICH guidelines. [16] The validation parameters are linearity, accuracy, precision, LOD, LOQ, ruggedness and robustness.
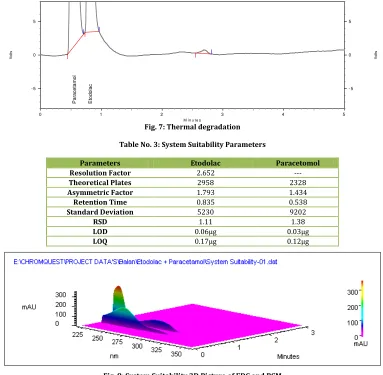
System Suitability:
System suitability parameters were evaluated to verify system performance. It was determined by six replicate injections of standards of both EDC and PCM. Other system suitability parameters such as theoretical plates (USP), resolution (USP) and asymmetry factor were also evaluated. System suitability parameters were given in Table. 3. The 3D picture of system suitability was shown in Fig. 8.
Linearity:
Linearity was demonstrated from 80% to 120% of standard using five different concentration levels for both EDC and PCM. The peak areas were recorded for all the peaks and calibration plot was constructed by plotting peak area versus concentration of EDC and PCM which were found to be linear in the range of 12.8µg to 19.2µg and 10.4µg to 15.6µg respectively, the values were given
in Table. 4. Coefficient of correlation for EDC and PCM was 0.9999
and 0.9997 respectively. The calibration curves were given in the
Fig. 9 and Fig. 10.
Accuracy (Recovery Studies):
To check the degree of accuracy of the method, recovery studies were performed in triplicate by standard addition method at 80%, 100% and 120%. Known amounts of standard mixture of EDC and PCM was added to pre-analyzed samples and was subjected to the proposed UPLC method. Results of recovery studies were shown
in Table. 5.
Precision:
Precision was evaluated by carrying out six independent sample preparations from a single lot formulation. The sample solution was prepared in the same manner as described in sample preparation. Percentage relative standard deviation (%RSD) was found to be less than 2% for within a day and day to day variations, which proves that the method is precise. The results for precision were given in Table. 6.
Robustness:
To evaluate the robustness of the developed RP-UPLC, small deliberate variations in the optimized method parameters were done. The effect of change in flow rate and wavelength on the retention time and area were studied. The method was found to be unaffected by small changes like ± 0.2 change in flow rate and ± 2 change in wavelength. The results of robustness were tabulated in
Table. 7.
Limit of Detection (LOD) and Limit of Quantification (LOQ): The limit of detection (LOD) is defined as the lowest concentration of an analyze that an analytical process can reliably differentiates from background levels [17]. The limit of quantification is defined as the lowest concentration of the standard curve that can be measured with acceptable accuracy, precision and variability. The LOD and LOQ were calculated as LOD = 3.3 x Syx /slope and LOQ = 10.0 x Syx / Slope, here Syx is residual variance due to regression. The LOD and LOQ values were given in Table. 3.
RESULTS AND DISCUSSION
I
n order to develop an effective method for the analysis of the drugs in pharmaceutical formulations, preliminary tests were performed to select adequate and optimum conditions. Parameters such as detection of wavelength, ideal mobile phase and their proportions of the standard solution were studied. Several binary or ternary eluents were tested by using various proportions of solvents including buffer and acetonitrile. The goal of this study was to develop a rapid UPLC method for the analysis of EDC and PCM in a finished tablet dosage form using a ammonium acetate buffer, methanol and acetonitrile in the ratio of 40:40:20 as mobile phase at a flow of 250µl/min, hypersil gold C18, 50 x 2.1mm, particle size 1.9µm column with the PDA detection at 236nm. The retention time was found to be 0.538 min and 0.835 min for PCM and EDC respectively. The respective linear regression equation being y = 29708x -365.9 (r2 = 0.9999) for EDC, y= 50931x -319.3 (r2 = 0.9997) for PCM. The percentage of assay for EDC and PCM were about 99.91% and 99.97% respectively. The stability indicating capability was established by forced degradation experiments. The proposed method is simple, rapid and statistically validated for its accuracy. No interfering peaks were found in the chromatograms indicating that the tablet excipients had not interfered in analysis of drugs.Table No. 1: Assay of Etodolac and Paracetamol
Formulation Drug Lable Claim(mg) Purity (%)
Tablet Etodolac 400 99.91
Balan P. et al., J. Sci. Res. Phar. 2014, 3(1), 33-37
Fig. 3: Assay Chromatorgram of Paracetamol and Etodolac
Table No. 2: Forced Degradation Study
Degradation Parameters
Degradation Time (hr)
Standard Peak Area
Peak Area Product
% of Recovery
% of Degradation
EDC PCM EDC PCM EDC PCM EDC PCM
Acid Degradation (0.1N HCL,60°C)
24 471688 666625.4 373395 607467 77.13 89.08 22.87 10.92
Alkali Degradation (0.1N NaOH, 60°C)
24 471688 666625.4 455283 613103 94 90 6 10
Peroxide Degradation (3% H₂O₂, 60°C)
24 471688 666625.4 374456 637092 77.35 93.42 22.65 6.58
Thermal Degradation (Oven, 60°C)
24 471688 666625.4 451063 600793 93.17 88.1 6.83 11.9
Sunlight 24 471688 666625.4 463179 663349 98.18 99.5 1.82 0.5
Fig. 4: Acid Degradation
M i n u t e s
0 1 2 3 4 5
V
o
lt
s
- 5 0 5
V
o
lt
s
- 5 0 5
P
a
ra
c
e
ta
m
o
l
E
to
d
o
la
c
Fig. 5: Alkali Degradation
M i n u t e s
0 1 2 3 4 5
V
o
lt
s
- 5 0 5
V
o
lt
s
- 5 0 5
P
a
ra
c
e
ta
m
o
l
E
to
d
o
la
c
Balan P. et al., J. Sci. Res. Phar. 2014, 3(1), 33-37
M in u t e s
0 1 2 3 4 5
V
o
lt
s
- 5 0 5
V
o
lt
s
- 5 0 5
P
a
ra
c
e
ta
m
o
l
E
to
d
o
la
c
Fig. 7: Thermal degradation
Table No. 3: System Suitability Parameters
Parameters Etodolac Paracetomol
Resolution Factor 2.652 ---
Theoretical Plates 2958 2328
Asymmetric Factor 1.793 1.434
Retention Time 0.835 0.538
Standard Deviation 5230 9202
RSD 1.11 1.38
LOD 0.06µg 0.03µg
LOQ 0.17µg 0.12µg
Fig. 8: System Suitability 3D Picture of EDC and PCM
Table No. 4: Linearity
Level Etodolac Paracetamol
Concentration (µg/ml) Area Concentration (µg/ml) Area
80% 12.8 375780 10.4 521597
90% 14.4 429794 11.7 603486
100% 16.01 476768 13.01 664602
110% 17.6 523836 14.3 725859
120% 19.2 568251 15.6 793059
Fig. 9: Linearity Curve for Etodolac Fig.10 Linearity Curve for Paracetamol
Table No. 5: Accuracy (Recovery) Data
Parameters Etodolac Paracetamol
% Estimated % RSD % Estimated % RSD
80% 99.78 0.9 99.39 0.4
100% 99.47 0.82 99.67 0.58
Balan P. et al., J. Sci. Res. Phar. 2014, 3(1), 33-37
Table No. 6: Precision
Drug Intraday assay Inter day assay
% Obtained % RSD % Obtained % RSD
Etodolac 99.88 0.52 99.91 1.11
Paracetamol 100.03 0.41 99.97 0.98
Table No. 7: Robustness
Factors Level Retention time Area (µv2sec)
PCM EDC PCM EDC
Standard 250µl / min 0.538 0.835 666625 471688
Flow rate 225µl / min 0.605 0.908 692738 503153
275µl / min 0.49 0.752 563498 406586
Wavelength 234nm 0.538 0.837 560576 517732
238nm 0.537 0.833 674132 377823
CONCLUSION
T
he proposed method was found to be simple, precise, accurate and rapid for simultaneous determination of EDC and PCM in bulk and tablet dosage form. The mobile phase is easy and simple to prepare and economical. The sample recoveries in formulation were in good agreement with their respective label claims. Hence, it can be easily and conveniently adopted for routine analysis of EDC and PCM in tablet dosage form.ACKNOWLEDGEMENTS
T
he authors are grateful to PRIST University, Thanjavur and Ideal Analytical & Research Institution, Puducherry, for providing all the facilities to perform the research work.REFERENCE:
1. United state Pharmacopoeia Volume II Page No. 2334-2335. 2. Sweet man C.S., Martindale, The Complete Drug Reference,
34th edn. 2005; p. 37-38.
3. British Pharmacopoeia. Vol. II, London: Her Majesty's Stationary Office; 1998; p. 2569-2570.
4. Indian Pharmacopoeia Vol. II, New Delhi: The Controller of Publications, Govt. of India; 1996; p. 554.
5. Kousy N.M. EI. Spectrophotometric and spectrofluorimetric determination of etodolac and aceclofenac. Journal of Pharm. Biomed. Anal., 1999; 20: 185-194.
6. Patidar R. Simultaneous spectrophotometric estimation of paracetamol and etodolac in tablet dosage forms Patidar R. et al., Journal of Global Pharma Technology. 2009; 1(1): 62-66.
7. Kousy N.M. El Spectrophotometric and spectrofluorimetric determination of etodolac and aceclofenc : J. Pharm. Biomed. Anal., 1999; 20: 185-194
8. Garg G., Saraf S. Simultaneous estimation of aceclofenac, Paracetamol and chlorzoxazone in tablets. Indian J. Pharm. Sci., 2007; 69: 692-694.
9. Balan.P et.al, Method development and validation of Etodolac in tablet dosage form by UVSpectrosopy, inventi Rapid: Pharm. ana. & Qual. Assur., 2(2).
10. Gopinath R, A RP-HPLC method for simultaneous estimation of paracetamol and aceclofenac in tablets, ijps, 2007; 69(1): 137/32130.
11. Su ZengAnalysis of flurbiprofen, ketoprofen and etodolac enantiomers by pre-column derivatization RP-HPLC and application to drug–protein binding in human plasma Y.-X. Jin et al. / Journal of Pharmaceutical and Biomedical Analysis, 2008; 46: 953-958.
12. Kartik A., Subramanian G. Simultaneous estimation of paracetamol and domperidon in tablets by reverse phase HPLC method. Indian J. Pharm. Sci., 2007; 69: 142-144. 13. Balan.P et.al RP- HPLC Method Development and Validation
of Etodolac and Paracetamol in Combined Dosage Form, Asian J. Research Chem., 2011; 4(7).
14. Blessy M.et.al, Development of forced degradation and stability indicating studies of drugs-A review, J. Pharm. Anal., 2013; http://dx.doi.org/10.1016/j.jpha.2013.09.003. 15. George Ngwa, Forced Degradation as an Integral part of
HPLC Stability-Indicating Method Development, Drug Delivery Technology, 2010; 10(5).
16. ICH-Guidelines Q2A, Validation of Analytical Procedures: Definition and terminology Geneva, Switzerland 1995. 68-76.
17. ICH of Technical requirements for the registration of Pharmaceutical for Human Use (ICH) (1996); Q2b. Validation Analyticla Procedures Methodology.
Conflict of interest: The authors have declared that no conflict of interest exists.