Stature
and Weight
Status
of Children
in an
Urban
Kindergarten
Population
Shiriki K. Kumanyika, PhD, MPH; Sandra L. Huffman, ScD; Mary Ellen
Bradshaw, MD; Hattie WaIler, BSN, MSN; Alan Ross, PhD; Mary
Serdula, MD; and David Paige, MD, MPH
From the Johns Hopkins University School of Hygiene and Public Health, Baltimore, Maryland; the District of Columbia Commission of Public Health, Washington, DC; and the Centers for Disease Control, Atlanta, Georgia
ABSTRACT. To assess the prevalence of growth problems
among school entrants in an urban population who were not preselected on poverty or other nutritional risk cri-teria, we analyzed height and weight measurements for
5170 4- and 5-year-old children (91.9% black, 5.5% white,
and 2.6% Hispanic) who enrolled in District of Columbia public school kindergartens in the Fall of 1985. Compared to the National Center for Health Statistics reference, the white girls and boys were of average height, Hispanic girls were of average height, and Hispanic boys were shorter than average. The black girls and boys were taller than average. In light of published evidence for black-white differences in the timing and duration of growth, we tentatively attributed this tall stature to advanced skeletal maturation of the black children relative to the predominantly white United States population growth
standards. Underweight was virtually absent in this
pop-ulation. Excess overweight was noted in all sex-racial! ethnic subgroups, particularly among Hispanic children. However, the extent to which overweight (high weight-for-height percentile) represents obesity in kindergarten-aged children and in different racial/ethnic groups needs clarification before the implications of the finding of
excess overweight can be fully understood. Overall, the
growth of these children was on a par with the National Center for Health Statistics growth reference population.
Pediatrics. 1990;85:783-790; growth, children, black, His-panic, overweight.
In the United States, surveys of children who
have been selected on the basis of low income or
other nutritional risk criteria show an excessive prevalence of short stature, underweight, and
over-Received for publication Mar 1, 1989; accepted Apr 24, 1989 Reprint requests to (S. K. K.) Dept of Nutrition, 5-126 Hender-son Bldg, Penn State University, University Park, PA
16802-6597.
PEDIATRICS (ISSN 0031 4005). Copyright © 1990 by the American Academy of Pediatrics.
weight in some age-race/ethnic groups.’5 For
ex-ample, Alvarez et al’ reported a 21% prevalence of
growth stunting and a 14% prevalence of
under-nutrition among low-income black and Hispanic children in a neighborhood health center in Boston, citing comparable rates for children in some devel-oping countries. Scholl et al#{176}reported a higher than
expected prevalence of short stature among white
and Hispanic children in a poor community in
southern New Jersey. The Centers for Disease
Control3 reported an excess of short stature and
underweight among infants and preschool children
in several age-racial/ethnic groups. The Centers for Disease Control data are a compilation of data on
subsets
of
children in numerous states and localitieswho qualify for and have actually been enrolled in
public health nutrition programs such as the
Supplemental Feeding Program for Women,
In-fants and Children or the Early Periodic, Screening,
Diagnosis and Treatment Program. A high
preva-lence of overweight was also noted in both the New
Jersey#{176} and the Centers for Disease Control3 popu-lation.
In contrast to these studies in high-risk
popula-tions, we assessed the prevalence of stature and
weight problems in an unselected population of public school children at the point of kindergarten
entry. We were interested in whether (given the
now long-standing availability of programs such as
Supplemental Feeding Program for Women,
In-fants, and Children that focus on children in the preschool age range#{176}) the heights and weights of
children entering an urban public school system
were on a par with the National Center for Health Statistics growth reference population.7 The survey
was done in the District of Columbia, which has a
METHODS
Data Collection
The data were collected in conjunction with a
Centers for Disease Control-sponsored pilot project
concerning potential nutrition surveillance
adap-tations of school height and weight measurements.8
Nine pediatric nurse practitioners and four
com-munity health nurses, usually assisted by one or
two health technicians, collected height and weight
data in all 120 District of Columbia elementary
schools during September through December, 1985.
In collecting the data, they used an established
mechanism for routine, annual height and weight
screening of public school children by the Bureau
of School Health Services, a subdivision of the
District of Columbia Commission of Public Health.
Some modifications in the usual Bureau of School
Health Services procedure were introduced to meet
the Centers for Diseases Control requirements for
standardization and to make centralized data
col-lection easier.
Before data collection, beam balance scales were
checked and either certified as accurate to the 0.25
pound or tagged as nonworking. Portable, strain
gauge digital scales accurate to 0.1 pound (SECA,
Model 770000) were used in schools that did not
have beam balance scales or that did not have
working, certified scales. For height measurements, a metal wall tape was mounted in a suitable location
at each elementary school and used with a
hand-held right-angle board for positioning of the child’s
head. Children were measured in stocking feet,
dressed, but with minimal indoor clothing. Height
was measured in inches to the nearest 0.25 inch.
Weight was measured in pounds to the nearest 0.25
pound.
A quality assurance manual provided the school
nurses with detailed instructions for taking
stand-ardized height and weight measurements under the
specific field conditions in District of Columbia elementary schools. One week before the beginning of data collection, the school health teams attended
a centralized all-day training session. Centers for
Disease Control staff members conducted
standard-ization exercises in height and weight
measure-ments as part of this training. One of the authors (S. L. H.) visited each team in the field during the first or second week of data collection to provide further guidance in implementing the measurement protocol.
Data Processing and Analyses
Data sheets were compiled centrally by the
Bu-reau of School Health Services and delivered to
Johns Hopkins for processing and analysis. Birth
date, race/ethnicity (as designated on the school
registration form), and home address data for each
child, obtained on computer tape from the central
administration of the District of Columbia Public
Schools, were merged with the height and weight
data. The socioeconomic status distribution of the
school entrant population was approximated by
matching each child’s home address to a census
tract code that was linked to a set of 1980 census tract indicators.
At the time of data collection, 6252 children were
listed on kindergarten class rolls in District of
Columbia public elementary schools. No data were
available for the 4% of children who were absent
on the day their class was measured. The final data
set included 5170 children, 86% of those present
for screening. The exclusions (n = 832) were as
follows: 398 children for whom no date of birth was
obtained; 155 children aged < 48 months or 72
months (to limit the data set to 4- and 5-year-old
children); 6 children for whom a health problem or
possible error affecting the measurement had been
noted at the time of screening; 55 children in racial categories with insufficient numbers for analysis
(50 Asian American children and 5 American
In-dian children); 42 children for whom race was
un-known; 176 children flagged by the Centers for
Disease Contol subroutine as having “impossible”
(low or high extremes) standard deviation scores
(Z) for height for age (-6 > Z > +6), weight for age (-6 > Z > +6), or weight for height (-4 > Z> +6).
Percentiles of height for age, weight for age, and
weight for height were calculated for each child
with the Centers for Disease Control
Anthropo-metric Software.9 These percentiles refer to the
National Center for Health Statistics growth
ref-erence population.7 In effect, a height-for-age or
weight-for-age percentile score is a sex-specific,
age-adjusted observation. Weight for height
per-centiles are sex-specific but assumed to be
age-independent.7 The prevalence of short stature,
un-derweight, and overweight was calculated using the
Centers for Disease Control Pediatric Nutrition
Surveillance System definitions,2 as follows: short
stature = height for age less than the fifth
percent-ile; underweight = weight for height less than the
fifth percentile; overweight = weight for height
more than the 95th percentile. All analyses were
done on a microcomputer with Statpac.’#{176}
RESULTS
Characteristics of the District of Columbia
Kindergarten Population
The age distribution of the kindergarten entrants
Age* (mo) Height (cm) (in) Weight (kg) (ib) White (n = 146)
64.8 (3.6) 113.0 (5.6) 44.5 (2.2) 20.4 (2.8) 45.3 (6.2) Hispanic (n = 78)
64.8 (4.0) 111.3 (5.6) 43.8 (2.2) 20.5 (3.8) 45.5 (8.5) Black
___________
(n = 2431) ___________63.7 (3.6) 112.5 (5.3) 44.3 (2.1) 20.1 (3.1) 44.7 (6.9) Girls (Mean (SD))
White Black Hispanic (n = 137) (n = 2319) (n = 59)
64.6 (3.7) 63.7 (3.6) 64.7 (3.4) 110.5 (5.3) 112.0 (5.3) 111.0 (4.6) 43.5 (2.1) 44.1 (2.1) 43.7 (1.8) 19.2 (2.7) 19.8 (3.5) 20.9 (4.1) 42.7 (6.1) 44.0 (7.7) 46.5 (9.0) Age (mo)
Height (cm) (in) Weight (kg) (lb)
wAge at screening.
TABLE 4. Height for Age, Weight for Age, and Weight
for Height of Public School Kindergarten Entrants, Dis-trict of Columbia, Fall 1985: Mean Percentiles (95% Confidence Intervals) by Sex and Race/Ethnicity
Sex Height for Age
White Black Hispanic
Boys Girls 53.0 (48.3, 57.8) 47.9 (43.0, 52.8) 52.9 (51.8, 54.1) 59.6 (58.4, 60.7)
Weight for Age
42.1 (35.2, 48.9)
50.1 (42.1, 58.0)
White Black Hispanic
Boys Girls 58.3 (53.9, 62.8) 56.4 (51.9, 60.8) 56.9 (55.8, 58.0) 61.6 (60.4, 62.7)
Weight for Height
55.8 (48.9, 62.8)
67.9 (60.8, 75.0)
White Black Hispanic
Boys Girls 59.4 (55.1, 63.8) 59.8 (55.8, 64.2) 56.5 (55.5, 57.6) 57.3 (56.2, 58.4) 64.6 (58.4, 70.7) 72.0 (65.1, 78.8)
TABLE 1. Age Distribution* of Public School Kinder- TABLE 2. Racial and Ethnic Distribution of Public
garten Entrants,t District of Columbia, Fall 1985 School Kindergarten Entrants,* District of Columbia, Fall 1985, Total and by Sex
Age (mo) n Percent Age (mo) n Percent 48.0-55.99 11 0.2 64.0-64.99 490 9.5 56.0-56.99 38 0.7 65.0-65.99 400 7.7 57.0-57.99 170 3.3 66.0-66.99 399 7.7 58.0-58.99 318 6.2 67.0-67.99 391 7.6
59.0-59.99 401 7.8 68.0-68.99 396 7.7
60.0-60.99 432 8.4 69.0-69.99 257 5.0 61.0-61.99 460 8.9 70.0-70.99 108 2.1 62.0-62.99 426 8.2 71.0-71.99 27 0.5
63.0-63.99 446 8.6
Total 100.0 Race Boys n Percent Girls n Percent Total n Percent
Black 2431 (91.6) 2319 (92.2) 4750 (91.9)
White 146 (5.5) 137 (5.4) 283 (5.5)
Hispanic 78 (2.9)
2655 (100.0)
59 (2.3) 2515 (99.9)
137 (2.6) 5170 (100.0) *After exclu sions described in the text.
*Age was computed by subtracting birth date from TABLE 3. Age, Height, and Weight Characteristics of
screening date. Public School Kindergarten Entrants, District of
Colum-tAfter exclusions described in the text. bia, Fall 1985, by Sex and Race/Ethnicity Boys (Mean (SD))
Eighty-two percent were 5 years old, and all but 11
of the 4-year-old children were in the last third of
__________
__________
__________
their fourth year. The sex and racial/ethnic
distri-bution is shown in Table 2. Ninety-two percent of
the children were black. Birthplace was not
re-corded for the Hispanic children. The origins of the
District of Columbia Hispanic population are
largely Central American (not including Mexico) (49%), South American (25%), and Caribbean
(11%).h1 Based on census tract information, the
kindergarten population included children from all
District of Columbia residence areas and socioeco-nomic strata. However, in comparison to the overall
District of Columbia population,#{176}2 white children
and children from high-income census tracts were
underrepresented. The white children in the public school population lived in higher socioeconomic status census tracts than the black and Hispanic children.
Raw data on age, height, and weight by sex and
race/ethnicity are summarized in Table 3. The age
distributions of the boys and girls were similar
within race/ethnicity, but the black children were __________________________________
younger than the white and Hispanic children. ____________________________
__________
Stature and Weight Status Relative to National
Center for Health Statistics Growth Reference
Population
The mean percentiles of the anthropometric van- ____________________________________________
ables for each sex-race/ethnic group are given in
Table 4. The reference distributions, when
trans-formed into percentiles, are centered at a mean of
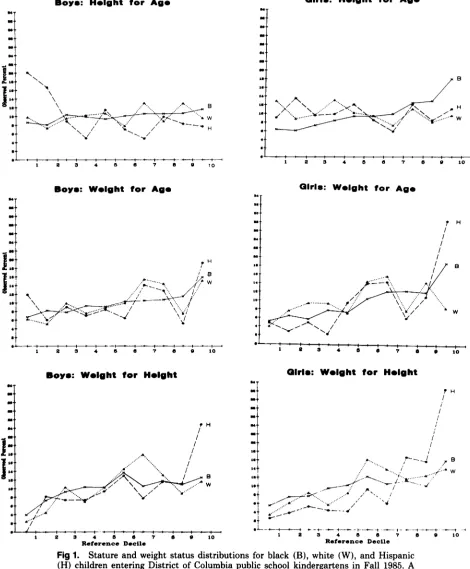
50. The observed percentile distributions are shown
in Figure 1 as the percent of kindergarten entrants ________________________________
who fell within each decile of the National Center ________________________________
for Health Statistics reference. Using this
ap-proach, if the observed distribution is identical to the reference distribution, 10% of the observations
Boys: W#{149}lght for Ags
I
5’
I
2 3 4 5 6 7 8 0 10
Girls: Wsight for Ags
H
B
w
1 2 3 4 o
1 2 3 4 5 6 7 6 9 10
Boys: Wslght for H.lght
2 3 4 6 C I C P 10
Reference Decile
Fig 1. Stature and weight status distributions for black (B), white (W), and Hispanic
(H) children entering District of Columbia public school kindergartens in Fall 1985. A distribution that is identical to the National Center for Health Statistics reference distribution would have 10% of the observations in each decile.
is shifted to the right of the National Center for
Health Statistics reference will appear as an
up-ward gradient, with less than 10% in the lower
deciles and more than 10% in the higher deciles. Stature. Black girls in the District of Columbia kindergarten population tended to be relatively tall.
The height for age graph for black girls (Fig 1)
shows an upward gradient from about 6% in the
shortest reference decile to 12% and 18% in the
deciles at the tallest end of the reference
distnibu-tion. Consistent with the impression of a
right-shifted height distribution for black girls, their
Boys:
H&ght for Ags Girls: H#{149}ight for Ag#{149}N N
\
N/H
-.--t 4 I ‘ I
-$-
-I #{176}I ‘ i #{149} #{176} -I- +-t “--I1 2 3 4 5 0 r a a io
pH
‘..‘ ‘.“
....‘ I’ /1..”
Girls: Wslght for H#{149}lght
/i
- I
- Ii
I
is I
a#{149}r .“.. ‘.. ,p-’---4 ,. B
‘t
,..
.&,... .,/ .. ./-:i’*:
:
-‘St ,,,... ‘ /1’ N
St /
‘+ #{163}“ 4
..--‘-- .-
--
$-1 2 3 4 6 6 7 a 9 10
30
28
26
24
22
20 18
6
)3 3
mean height for age was at the 59.6 percentile
(Table 4). The observed height for age distributions
and mean percentiles for Hispanic girls and white
girls were roughly comparable to the reference
dis-tnibution (Fig 1 and Table 4). The data for white
girls suggest a modest shift toward the shorter end of the distribution.
Hispanic boys were relatively short: more than
one third were in the two lowest deciles of the
reference distribution of height for age (Fig 1), and their mean height for age was at the 42.1 percentile
(Table 4). Black boys tended to be tall, but not to
the extent of black girls. The height for age
distni-bution for white boys approximated that of the
reference distribution, with perhaps a modest tend-ency toward tallness.
Consistent with the impression from the height
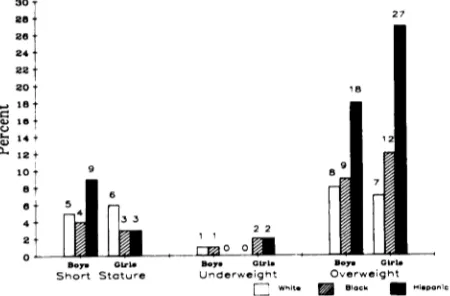
for age distributions, only Hispanic boys had an excess prevalence of short stature (ie, >5% below the fifth percentile) (Fig 2).
The pattern of male-female differences in stature was inconsistent across race/ethnicity. In blacks
and Hispanics, height for age percentiles were
higher in girls than boys, whereas the opposite was
true for whites. Viewed within sex, black and
His-panic girls were taller than white girls, whereas
Hispanic boys were shorter than white boys, and
height differences between black boys and white
boys were minimal. A two-way analysis of variance supported the validity of this finding, ie, the
inter-action of sex and race/ethnicity on height for age
was statistically significant (P = .014).
Weight Status. The distributions and mean pen-centiles of weight for age for boys and girls in the
three racial/ethnic groups (Fig 1 and Table 4)
in-dicate that the District of Columbia kindergarten
population as a whole was heavy relative to the
reference population. The patterns for girls were
more marked than those for boys, and the Hispanic
girls were the most extreme among the six
..-) 18 a
#{176})10
C.,
14
0.. 12 10
8
8
4
2
27
B,y
Ot’1 0 B.Short Stature Underweight Overwejght
flwit. #{149}p
Fig 2. Prevalence of short stature, underweight, and
overweight by sex and race/ethnicity, District of Colum-bia public school kindergarten entrants, Fall 1985.
subgroups. More than one quarter of the Hispanic
girls in the kindergarten population were in the
heaviest decile of the reference population; only
15% were below the 40th percentile of the reference distribution.
The distributions of weight for height show that
the District of Columbia population was heavier
than the reference population, irrespective of age
and stature. The distributions for boys and girls in all three racial/ethnic groups were shifted noticea-bly to the higher percentiles of the reference
distni-butions. Trends for white girls and boys were more
irregular than for the other groups. Hispanic chil-dren of both sexes had relatively few individuals at the lower end of the weight for height distribution
and relatively many at the high end. Whites and
blacks were relatively few at the low end, but with
lesser concentrations at the heaviest reference
de-cile compared to Hispanic boys and girls. The
prey-alence of underweight was less than the expected
5%, and the prevalence of overweight was greater
than the expected 5%, particularly among the
His-panic children (Fig 2).
Stature of Overweight Children. The stature of
the overweight and nonoverweight children is
com-pared in Table 5. In both sexes and in all three
racial/ethnic groups, overweight children have a
higher mean height for age percentile than
nonov-erweight children. This effect appeared to be more
pronounced among the black and Hispanic children
than among the white children. However, the test
for interaction in the analysis of variance did not
indicate a significant racial/ethnic difference in the
association of overweight with tallness, in either
sex.
DISCUSSION
With the caveat that the public school
kinder-garten population was somewhat less than
repre-sentative of children from certain high-income
cen-sus tracts, these data show adequate stature and
weight status among District of Columbia 4- and
5-year-old children from the perspective of
undernu-tnition, but suggest that overweight may be an
important problem. An excess of short stature
among the Hispanic boys is suggested, although not
conclusively because of the small numbers of
His-panic boys in this population. The absence or very
low prevalence of underweight in the District of
Columbia kindergarten entrant population was not
surprising. Low prevalence of underweight among
children in the United States has been reported
frequently, even in populations at high nutritional
risk due to low income or other criteria2’3’5 and
Total
n Mean (SD)
245 60.9 (31.7)
2410 51.8 (28.5) 9.1
way analysis of variance.
TABLE 5. Stature Comparison of Overweight and Nonoverweight Kindergarten
En-trants: District of Columbia Public Schools, Fall 1985, by Sex and Race/Ethnicity
Height-for-Age Percentile
Buys
White Black Hispanic
n Mean (SD) n Mean (SD) n Mean (SD)
Overweight* 12 57.8 (34.0) 219 61.6 (31.0) 14 51.5 (37.6)
Not Overweight 134 52.6 (28.3) 2212 52.1 (28.4) 64 40.0 (29.1)
Differencet 5.2 9.5 11.5
Girls
White Black Hispanic Total
n Mean (SD) n Mean (SD) n Mean (SD) n Mean (SD)
Overweight 9 51.3 (38.2) 270 70.5 (26.7) 16 61.1 (24.8) 295 69.4 (27.3)
Not Overweight 128 47.6 (28.3) 2049 58.1 (28.6) 43 46.0 (29.8) 2220 57.3 (28.8)
Difference 3.7 12.4 15.1 12.1w
*Weight for height above 95th percentile of National Center for Health Statistics reference.
tMean height for age percentile of “overweight” group minus mean for “not overweight” group.
:I:P < 0.05 for overall (within sex) difference in mean height-for-age percentile, by
two-Because attendance at the height and weight
screening was 96%, and because the exclusions
resulting from missing data were not clustered by
screening date or by school, there is no reason to
believe that our findings are influenced by a sizeable bias toward either under- or overestimation of
stat-ure and weight status problems. The
underrepre-sentation of children of higher socioeconomic status would, if anything, increase the number of children
with poverty-related nutritional deficits such as
short stature.’5
We evaluated the stature findings in black
chil-dren in the context of previously documented
evi-dence of accelerated growth among black
chil-dren,#{176}5’8resulting in an apparent absence of short
stature even in low-income black populations. For
example, in the Centers for Disease Control
data-base of selected low-income children served by
pub-lic health nutrition programs,2’3 the prevalence of
short stature among 3- and 4-year-old black
chil-dren was lower than for white, Hispanic, Native
American, or Southeast Asian children. Similarly,
the survey by Scholl et a15 of 5- to 12-year-old low-income children in New Jersey found a prevalence
of short stature among black boys and girls that
was one third to one half of the prevalence observed
among Hispanic and white children. Although tall
stature may reflect either parental stature or above-average nutritional status or both, the relatively tall stature of school-aged and preadolescent black
children relative to comparable white children has
been attributed to genetically determined
matuna-tional factors.’6’8 Timing and duration of some
stages of growth may be different in black and white
children.’9’ 20 For example, in the Ten-State
Nutni-tion Survey, the timing of ossification centers in
low-income blacks was advanced over that of whites
of modestly higher incomes, suggesting more rapid
skeletal maturation of children of African
ances-try.2’ Thus, the National Center for Health
Statis-tics reference,
which is based on a sample designed to represent the predominantly white United Statespopulation, may not properly estimate the stature
attainment of black children.
The inconsistency in male-female stature
differ-ences across race-ethnicity was not expected, but a
similar pattern was reported by Scholl et al.5 These
authors observed that the age-adjusted heights of
5- to 12-year-old black boys were 2.5 cm greater
than those of white boys, whereas age-adjusted
heights of black girls were 4.1 cm higher than those of white girls. Hispanic boys were 0.5 cm shorter
than white boys whereas, Hispanic girls were 0.9
CIII taller than white girls. The reason for this
pattern is unclear, but, at minimum, the
observa-tion suggests that pooling stature data across sex
in this age group may conceal useful information.
The overweight data imply a need for
obesity-related intervention but must be interpreted
cau-tiously. Although weight for specified height is a
standard criterion for determining obesity and one
that correlates well with the level of body fatness in adults,22 for children of certain ages weight for height indicates very little about the level of body fat.2325 For example, in a study of British boys and
using the National Center for Health Statistics
reference values, Griffiths et al25 showed that
in the upper decile of weight for height were also in the upper decile of fatness, as measured by skinfold
thickness, and less than half (41 percent) were in
the upper quartile of triceps skinfold thickness.
The fact that overweight children in this study
were taller than average is further reason to
em-phasize the distinction between overweight and
obesity in the interpretation of these data. A high weight for height percentile may reflect either
over-all maturational status and muscularity or excess
fatness. Tallness for age may also distinguish heavy
nonobese children from heavy obese children,26’27
but this possibility remains to be confirmed.25’ 28
Without skinfold data or some other measure of
body fat, the inference that the high-weight
chil-dren are tall and muscular is as valid as the
infer-ence
that they are tall and fat.Racial/ethnic differences in body proportions, not reflected in standard growth charts,29 further complicate the use of weight for height standards
to assess obesity. For example, blacks have
rela-tively longer lower extremities than whites.3#{176}’
Hispanic and white populations may differ on leg
length (shorter in Hispanics)28 and chest girths
(wider in Hispanics).30 Based on a body composition
study in Peruvian preschool-aged children, Trow-bridge et alt2 concluded that it may be necessary to
interpret weight for height indices differently in
different populations.
Nevertheless, our overweight findings are poten-tially indicative of a problem and should be explored further. Since high weight for height is a common finding in children in the United States, the
inter-pretation of this finding needs to be clarified to
permit early preventive intervention where
appro-priate and, conversely, to eliminate costly
interven-tion where inappropriate. Early preventive
inter-vention of adult obesity is particularly important
for black females and for some subgroups of
His-panic males and females for whom obesity and its
complications represent major health problems.’ 14
SUMMARY
By definition, studies focusing on children at high
nutritional risk tend to show an excess of growth
problems. In contrast, in an unselected public
school kindergarten population we observed stature similar to that of the National Center for Health Statistics growth reference population, with the possible exception of shorter than average stature
among Hispanic boys. Black children are taller than average. Although we can offer no definitive expla-nation for this in the absence of data on parental stature or nutritional status, there is a substantial literature suggesting that black children in the
pre-school age range are advanced in skeletal
matura-tion relative to the predominantly white United
States population growth reference. Underweight was virtually absent in this population, a finding typical of United States populations, even in
high-risk groups. The apparent excess of overweight is
noteworthy; however, clarification of the meaning of high weight for height in 4- and 5-year-old chil-dren and across race/ethnicity is needed before the implications of this finding can be determined. Overall, except for the possible concern about over-weight, the growth status of these children is
ade-quate.
ACKNOWLEDGMENTS
This project was supported, in part, by a contract from the Association of Schools of Public Health in coopera-tion with the Centers for Disease Control.
We acknowledge the pediatric nurse practitioners, community health nurses, health technicians, and school health team supervisors who collected the data and the public school principals, teachers, and children who co-operated with the project. We are also grateful for the support and assistance of Dr Andrew D. McBride, former District of Columbia Commissioner of Public Health, Dr Floretta Dukes McKenzie, former Superintendent of the District of Columbia Public Schools, and Cormac Long, former Director of Quality Assurance for the District of Columbia Public Schools. Critical services were also pro-vided by Judy Gehret (Johns Hopkins), Emma Hazell, District of Columbia Office of Planning, and many others at the participating agencies and institutions.
REFERENCES
1. Alvarez SR, Herzog LW, Dietz W Jr. Nutritional status of poor black and Hispanic children in an urban neighborhood health center. Nutr Rev, 1984;4:583-589
2. Trowbridge FL. Prevalence of growth stunting and obesity: Pediatric Nutrition Surveillance System, 1982. MMWR.
1983;32:23-26
:3, Nutritional status of minority children: United States, 1986.
MMWR. 1987;36:366-369
4. Brown JE, Serdula M, Cairns K, et a!. Ethnic group differ-ences in nutritional status of young children from low-income areas of an urban county. Am J C/in Nutr,
1986;44:938-944
5. Scholl TO, Karp RI, Theophano J, et a!. Ethnic differences in growth and nutritional status: a study of’ poor schoolchil-dren in southern New Jersey. Public’ Health Rep.
1987;102:278-283
6. Rush D, Horvitz DG, Seaver WB, et a!. The national WIC evaluation. Evaluation of the special supplemental food program for women, infants, and children. I. Background and introduction. Am J Clin Nutr. 1988:48:389-393
7. Hamill PVV, Drizd TA, Johnson CL, et a!. Physical growth: National Center for Health Statistics percentiles. Am J C/in
Nutr. 1979;32:607-629
9. Jordan MD. Anthropometric software package tutorial guide and handbook. The Centers for Disease Control, Center for Health Promotion and Education, Division of Nutrition, Statistics Branch, Atlanta, Georgia. 1987
10. Statpac: Statistical Analysis Package for the IBM PC. Wal-onick Associates, mc; Minneapolis, MN. 1985
11. Hispanic Population and Characteristics in the Washington DC Metropolitan Area. Washington, DC: Comprehensive Technologies International. 1981
12. District of Columbia Office of Policy and Program Evalua-tion. Indices. A Statistical Index to District of Columbia
Services. June 1984.
13. Peck RE, Chuang M, Robbins G.E, et al. Nutritional status of Southeast Asian refugee children. Am J Public Health.
1981;71:1144-1 148
14. Dewey KG, Daniels J, Teo KS, et al. Height and weight of Southeast Asian preschool children in Northern California.
Am J Public Health. 1986;76:806-808
15. Jones DY, Nesheim MC, Habicht J-P. Influences in child growth associated with poverty in the 1970’s: An examina-tion of HANESI and HANESII, cross-sectional US national
surveys. Am J Clin Nutr. 1985;42:714-724
16. Garn, SM, Clark DC, Trowbridge FL. Tendency toward greater stature in American black children. Am J Dis Child.
1973;126:164-166
17. Owen GM, Lubin AH. Anthropometric differences between black and white preschool children. Am J Dis Child.
1973;126:168-169
18. Garn SM, Clark DC. Problems in the nutritional assessment of black individuals. Am J Public Health. 1976;66:262-267 19. Wingerd J, Peritz E, Sproul A Race and stature differences
in the skeletal maturation of the hand and wrist. Ann Hum Biol. 1974:1:201-209
20. Eveleth PB. Population differences in growth. In: Falkner F, Tanner JM, eds. Human Growth. New York: Plenum Press; 1986:221-239
21. Garn SM, Clark DC. Nutrition, growth, development and maturation: findings from the Ten State Nutrition Survey of 1968-70. Pediatrics. 1975;56:306-319
22. Abraham S. National Center for Health Statistics. Obese
and OverweightAdults in the United States. Vital and Health
Statistics. Series 11, No. 230. Washington, DC: US Govern-ment Printing Office; January 1983. Dept of Health and Human Services publication 83-1680.
23. Michielutte R, Diseker RA, Corbett WT, et al. The relation-ship between weight-height indices and the triceps skinfold measure among children age 5 to 12. Am J Public Health.
1984;74:604-606
24. Cole TJ. A critique of the National Center for Health Statistics weight for height standard. Hum Biol.
1985;57:183-196
25. Griffiths M, Rivers JPW, Hoinville EA. Obesity in boys: The distinction between fatness and heaviness. Hum Nutr Clin Nutr. 1985;39C:259-269
26. Johnston FE. Health implications of childhood obesity. Ann Intern Med. 1985;103:1068-1072
27. Forbes GB. Lean body mass and fat in obese children.
Pediatrics. 1964;34:308-314
28. Martorell R, Mendoza FS, Castillo RO, et a!. Short and plump physique of Mexican-American children. Am J Phys
Anthropol. 1987;73:475-487
29. Roche AF, McKigney JI. Physical growth of ethnic groups comprising the US population. Am J Dis Child. 1976;130:62-64
30. Najjar MF, Rowland M. National Center for Health Statis-tics. Anthropometric Reference Data and Prevalence of
Over-weight, United States, 1976-80. Vital and Health Statistics.
Series 11, No. 238. Washington, DC: US Government Print-ing Office; October 1987. Dept of Health and Human Serv-ices publication (PHS) 87-1688. Public Health Service. 31. Malina RM, Brown KH, Zavaleta AN. Relative lower
ex-tremity length in Mexican American and in American black and white youth. Am J Phys Anthropol. 1987;72:89-94 32. Trowbridge FL, Marks JS, de Romana GL, et al. Body
composition of Peruvian children with short stature and high weight-for-height. II. Implications for the interpreta-tion for weight-for-height as an indicator of nutritional status. Am J Clin Nutr. 1987;46:411-418
33. Kumanyika 5K. Obesity in black women. Epidemiol Rev,
1987;9:31-50
34. Kumanyika 5K. Dietary and disease issues for U.S. minority populations. J Nutr Educ. In press.
THE “ME” GENERATION AS PARENTS: PART 2
I know a couple of physicians who work around the clock. During the week,
one live-in babysitter cares for their very young girl and emotionally troubled
young boy; the other live-in takes over on weekends. Recently, my 6-year-old
daughter exclaimed, “Look, Mom, Sarah has a new babysitter!” The “babysitter”
was Sarah’s mother.
Perhaps most telling is the family Halloween party we gave last October. We
invited the mother that my daughter took for the babysitter, along with her
husband and children. She never bothered to call to say she and her husband
weren’t coming. Instead, her children showed up with the babysitter. What is
happening when parents conclude that a family party means only their children
and babysitter?