Testing and Controlling for Common Method Variance: A Review of
Available Methods
Shehnaz Tehseen∗ T. Ramayah† Sulaiman Sajilan‡
Abstract: Several studies have debated over the prevalence of Common Method Variance (CMV) in or-ganizational research. This paper highlights various procedural and statistical remedies to assess and control common method variance in any organizational study. It has been recognized that Common Method Variance (CMV) may significantly influence the research findings if it is not controlled properly through procedural and statistical remedies. However, researchers usually do not use all procedural remedies to remove potential impacts of CMV. Therefore, statistical remedies are strongly suggested to control and remove effects of CMV from data analysis. We have mentioned some common and effective statistical remedies from existing litera-ture that have been widely used and recommended to control the effects of CMV. Moreover, we also discuss the challenge of CMV in relation to entrepreneurship studies and illustrate the problem utilizing an analysis of entrepreneurial competencies and business growth. In addition, we describe the possible solutions for min-imizing the impact of common method bias by using the combination of several methods. This study strongly recommends using both procedural and statistical remedies to test and control the impacts of CMV from the research study.
Keywords: Common method variance, procedural remedies, statistical remedies, Harman’s single-factor test, partial correlation procedures, correlation matrix procedure, MLMV approach.
Introduction
The researchers of social science have to deal and analyze the self-reported data such as data on respondents’ personality, behaviors, and perceptions on various issues, i.e. per-sonality traits, entrepreneurial and managerial behaviors, business success, and business environment etc. The questionnaire survey is commonly used for data collection in en-trepreneurship and management research. These surveys provide the information that is used to measure the independent as well as dependent variables in a data analysis. However, the estimated impact of one variable on other variable is at risk of being biased due to CMV which is the systematic variance shared among the variablesJakobsen and Jensen(2015), and is usually introduced to the measures by the method of measurement rather than the theoretical constructs represented by the measures (Jakobsen & Jensen, 2015;Podsakoff, MacKenzie, & Podsakoff,2012;Podsakoff, MacKenzie, Lee, & Podsakoff,
∗
PhD Scholar and Excellent Graduate Assistant, Universiti Kuala Lumpur Business School, 50300, Malaysia. E-mail: shehnaz [email protected]
†
Professor, School of Management, Universiti Sains Malaysia, 54100 Kuala Lumpur, Malaysia. E-mail: [email protected]
‡
2003). For instance, if the impacts of entrepreneurs’ competencies on SMEs’ growth are estimated using only entrepreneurs’ perceptions on their own competencies and on their business growth performance, the estimated impact may be biased if some respondents overstate both competencies and growth performance due to the tendency to assess them-selves in too positive manner or because of social desirability. In this case, a positive correlation is produced between the two variables when the same respondent is used as a source for obtaining the measures of both the independent and dependent variables. Therefore, the estimated impacts may suffer from common method bias. Thus, survey methods introduce a serious methodological challenge that is the risk of common method biasJakobsen and Jensen(2015) which has not gained much attention as a unique topic in entrepreneurship research. The purpose of this paper is, therefore, to fill the knowledge gap by describing CMV as a central topic in the entrepreneurship research. Although a number of organizational studies have debated on the serious challenges of CMV that may arise due to various factors such as common method and items’ characteristics (Doty & Glick,1998). However, such studies did not mention the details of various steps that are needed to follow in order to conduct various statistical tests to control the CMV from a certain study. We have provided all necessary steps for selected statistical approaches that are essential to assess and remove the influence of CMV from data analysis. We have men-tioned the most suitable statistical remedies for PLS models. We believe that researchers can easily follow the given steps to conduct each of the CMV control tests. Moreover, in next sections, we have described the definition of CMV, potential sources of CMV, and procedural as well as statistical approaches to control it. Furthermore, we have described a practical example that how common method bias may appear in a specific study and provided illustrations of various selected statistical tests based on our real field work data to test and remove the impacts of common bias from the study. Since, the Smart PLS software was used to analyze the data, therefore, we have emphasized in describing only those statistical remedies that were considered more suitable for PLS models.
What is Common Method Variance (CMV)?
same source is known as Common Method Variance (CMV). It represents the amount of spurious correlation among the variables that may be generated by utilizing the same method (i.e. survey) in order to measure each variable. Moreover,Reio(2010) stated that CMV threats the validity of conclusions about the constructs’ association and creates the systematic bias in a study either by inflating or deflating the correlations. CMV has been referred to the variance of measurement method rather than to the constructs’ variance that is represented by the measures (Podsakoff et al.,2003;Campbell & Fiske,1959). CMV leads to a false internal consistency which is an apparent correlation between the vari-ables created by their common source. For instance, this may occur if same respondents are asked to evaluate their own competencies and their firm’s growth performance in the same survey. Such cases can create false correlations through self-report data if the re-spondents provide consistent answers to all survey questions that are even not related. Therefore, CMV is often a problem and researchers are required to control it through all possible ways (Podsakoff et al.,2003). CMV has potential to threat the validity of data when the participants respond to all survey items in a single sitting (Burton-Jones,2009).
Common Sources of CMV
1983). For instance, if we survey business owners about their competencies, we must consider whether they may overstate their entrepreneurial competencies because of so-cial desirability. This may lead to a problem if same owners will be asked to evaluate their organizational performance. Therefore, business owners who attach great impor-tance to social desirability may overstate both their entrepreneurial competencies and organizational performance, on the other hand, the business owners with low social de-sirability will not tend to make these exaggerations. In such cases, the social dede-sirability is a confounder that impacts the answers to both entrepreneurial competencies and or-ganizational performance, which inflates the observed correlation among the constructs. CMV may be produced by the consistency motif that is the respondents’ tendency to provide consistent answers across all survey items (Jakobsen & Jensen,2015;Podsakoff et al.,2003). Another response tendency constitutes the respondents’ pervasive view of themselves and the world in general, that is captured by the concepts of positive or nega-tive affectivity (Watson & Clark,1984). Negative affectivity is related to the respondent’s negative emotions; on the other hand, the positive affectivity indicates the positive emo-tionality of the respondents (Jakobsen & Jensen,2015). Additionally, Watson and Clark (1984) noted that positive and negative affectivity consists of two separate dimensions. Moreover, CMV may arise from same raters’ tendency to use or avoid to use the extreme choices on an item scaleBachman and O’Malley(1984) and the respondents’ tendency to agree or disagree with behavioral/attitudinal statements regardless of specific content (Jakobsen & Jensen,2015;Baumgartner & Steenkamp,2001). The rater’s transient mood state may also impact his/her answers to questions about the independent as well as de-pendent variables (Podsakoff et al.,2003).Jakobsen and Jensen(2015) stated that the main characteristic of the response tendencies is that they are highly stable across time.
The characteristics of a survey item may also produce the common method bias. Ac-cording toPodsakoff et al. (2012), the complex, abstract or ambiguous items lead diffi-culty for respondents to properly respond and are more likely to cause method bias. As Podsakoff et al.(2003) already mentioned that respondents often develop their own un-derstanding and idiosyncratic meanings of the ambiguous items that may increase ran-dom responding or respondents’ systematic response tendencies. Furthermore, the item complexity may cause abstractness in the construct (Doty & Glick,1998). In such cases, the complex items make the task of responding difficult to answer on the basis of such complex items’ content and increase the probability that respondents’ systematic tenden-cies of response will impact their answer (Podsakoff et al.,2012). Similarly, method bias can be developed due to similar scale properties across different itemsPodsakoff et al. (2003); if the wording of items generate socially desirable responsesPerry(1996); Neder-hof(1985); or if items are worded only positively or negatively (Podsakoff et al.,2012). In addition, a number of other characteristics of items may lead method bias that may not solely result from the formulation of items (Jakobsen & Jensen,2015).
Approaches to Control the Method Biases
the method biases. For example, the first method to minimize the influence of method bi-ases is by the careful designing procedure of the study and the second approach is to use statistical remedies in order to control the impact of common method bias after data col-lection. The procedural remedies are suggested to use prior data collection; on the other hand, statistical remedies are proposed to apply them after data collection before/after analyzing the data. Method biases can significantly impact on the reliabilities, validities of items, and on the covariation among latent constructs as well (Podsakoff et al.,2012). Chang et al.(2010) have strongly recommended using multiple remedies in order to as-suage various concerns regarding CMV.
The Procedural Remedies to Control the Common Method Bias
In order to control method variance through procedural remedies, the common measures of the predictor (independent) variables and criterion (dependent) variables are needed to be identified and are then eliminated through study design. The items of predictor and criterion variables may be connected due to the specific format or wording, measurement structure of the questionnaire, or the respondent (Podsakoff et al.,2003). Therefore, sev-eral procedural remedies have suggested byPodsakoff et al.(2003) are summarized as below;
• The researcher should strive to get the measures of independent and dependent variables from different sources. Because obtaining or collecting data from the same source or rater is one of the main cause of the common method bias. Therefore, mul-tiple sources of responses control the common method bias in the study. The benefit of this method is that it makes impossible for the mindset of the respondent to bias the observed relationships among the independent and dependent variables, this would eliminate the impacts of implicit theories, consistency motifs, social desir-ability tendencies, and various mood states. However, sometimes it is not possible to use under all situations, therefore, might result in the information loss when data on both the independent and dependent variables are not obtained from multiple users. Another drawback of this procedure is that this remedy may require more effort, time, and high cost.
using different formats of response (such as Likert scale and open-ended questions); media (such as computer-based and face to face interviews), and locations (such as different sites or rooms). However, more effort, time, and expense are required to implement the method.
• The other procedural remedy is protecting the anonymity of the respondents and minimizing the evaluation apprehension. These procedures can minimize method bias at reporting or response editing stage. However, this method cannot be easily used along with above procedural remedies.
• Counterbalancing the order of measurement of the independent and dependent variable is another procedural remedy that can be used to neutralize some of the method biases related to items’ embeddedness or question context. However, the main disadvantage of this approach is that it can disrupt the logical flow and makes not possible to use the funneling procedure which means the logical flow of general question to specific questions.
• The other possible procedural remedies include the improving of scale items through their careful construction. For instance,Tourangeau, Rips, and Rasinski(2000) men-tioned that item ambiguity is the most common problem in the comprehension stage of response. Thus, the researchers should define unfamiliar terms, avoid vague con-cepts or provide their examples, keep questions specific, simple, and concise, do not use double-barreled and complicated syntax.
Statistical Remedies
The researchers can minimize the impacts of common method variance by using proce-dural remedies because when the effects of CMV are not eliminated or reduced then they may appear on the research findings. Sometimes it is not possible to totally remove the impact of CMV through procedural remedies because all procedural remedies are usually not applicable in all situations. For instance, researchers may not prefer multiple sources to collect data that need high cost, great effort, and more time. Thus, the other procedural remedies might reduce the impact of CMV to some extent. Therefore, it is useful to use statistical remedies to control CMV’s impacts on research findings.
results should be carefully analyzed because biased responses result into inaccurate esti-mates of impacts and relationships between variables (Y ¨uksel,2017). Thus, it is impera-tive to report results based on data without CMV issues to suggest effecimpera-tive decisions and managerial implications. Therefore, the researchers are suggested to address the issue of CMV seriously while conducting research in the entrepreneurship field and employ pro-cedural and statistical remedies to detect and control its impacts on the study’s findings. In line with the recommendations ofGefen, Straub, and Rigdon(2011), we do strongly rec-ommend using statistical remedies to identify and correct CMV impacts from PLS study’s results.
non-normal data. Thus, the above studies highlight some statistical approaches to detect or control CMV from SEM studies. In addition, it is crucial to address the issue of CMV in study to ensure the consistency and validity of the results without common method bias. Furthermore, from a review of 110 articles on leadership in top journals,Antonakis, Ben-dahan, Jacquart, and Lalive(2010) found that researchers fail to address 66% to 90% of design and estimation conditions that make their causal claims invalid. They suggested researchers to plan and evaluate their work to ensure the consistency of estimates and validity of the inferences. Therefore, they proposed 10 best practices implicating analysis and research design issues. Among their proposed 10 best practices, avoiding common-method bias is one of the practices to obtain consistent and valid estimates in study. Thus, CMV has been recognized as a major issue by the researchers in survey design that has potential to affect the consistency and validity of PLS estimates.
The recent studies have associated the risk of common method variance with the stud-ies involving the same survey respondents (Y ¨uksel,2017; Palmatier,2016;Guide & Ke-tokivi,2015;Gefen et al.,2011;Chang et al.,2010). Richter, Cepeda, Rold´an, and Ringle (2015) have acknowledged that the techniques of common method variance analysis as proposed byChin, Thatcher, Wright, and Steel(2013) are among the major methodologi-cal contributions in the domain of PLS-SEM. In line withRichter et al.(2015), this study also acknowledges the importance of CMV techniques proposed byChin et al.(2013) in identifying as well as controlling the impacts of CMV from any study using PLS-SEM approach.
This paper describes the most common or most recommended statistical remedies that can either be used before or after data analysis. The recommended statistical remedies from existing literature are as follow:
(1) Harman’s Single-Factor Test.
(2) Partial Correlation Procedures (i) Partialling Out of General Factor
(ii) Partialling Out a Marker VariableLindell and Whitney(2001) method) (iii) Partialling Out a “Marker” VariablePodsakoff et al.(2003)
(3) Correlation Matrix Procedure
(4) The Measured Latent Marker Variable Approach (i) Construct Level Correction (CLC) Approach (ii) Item level correction (ILC) Approach
An Annotated Example: A Study on Business Owners’
Entrepreneurial Competencies and Business Growth
Harman’s Single-Factor Test
It is the most common test that is carried out by the researchers to examine the CMV in their studies. A Harman one-factor analysis is a post hoc procedure that is conducted after data collection to check whether a single factor is accountable for variance in the data (Chang et al.,2010). In this method, all items from every construct are loaded into a factor analysis to check whether one single factor emerges or whether single general factor results to the majority of the covariance among the measures; if no single factor emerges and accounts for majority of the covariance, this means that CMV is not a pervasive issue in the study (Chang et al.,2010). This test is done by using principal component analysis in SPSS. The following steps are involved while conducting this test:
(1) Enter all items of understudy constructs into factor analysis and run the principal component analysis.
(2) Look at the unrotated factor solution and examine it to assess the number of factors that could cause the variance in the variables.
(3) The presence of substantial CMV is evident if a single factor will emerge from the factor analysis or one general factor will lead to the majority of the covariance among the measuresPodsakoff et al.(2003).
Illustration of Harman’s Single-Factor Test
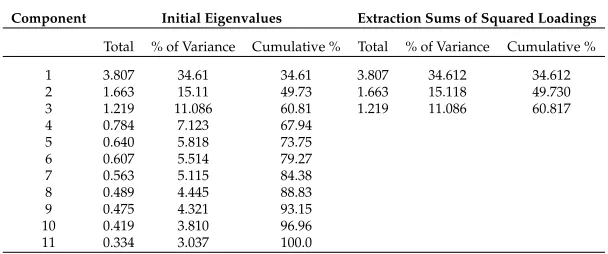
First of all, we entered all items of two exogenous latent constructs (strategic compe-tency and ethical compecompe-tency) and one endogenous latent construct (business growth) into SPSS file. Clicked on “Analyze” (Dimension Reduction Factor). Loaded all items into factor analysis, clicked Rotation (none) then continued and ok. The output generated (see table 1). The generated PCA output revealed 11 distinct factors accounting 60% of the total variance. The first unrotated factor captured only 34% of the variance in data. Thus, the two underlying assumptions did not meet, i.e. no single factor emerged and the first factor did not capture most of the variance. Therefore, these results suggested that CMV is not an issue in this study.
Disadvantages of Harman’s Single-Factor Test
Table 1
Harman’s single-Factor Test
Extraction Method: Principal Component Analysis
Component Initial Eigenvalues Extraction Sums of Squared Loadings
Total % of Variance Cumulative % Total % of Variance Cumulative %
1 3.807 34.61 34.61 3.807 34.612 34.612
2 1.663 15.11 49.73 1.663 15.118 49.730
3 1.219 11.086 60.81 1.219 11.086 60.817
4 0.784 7.123 67.94
5 0.640 5.818 73.75
6 0.607 5.514 79.27
7 0.563 5.115 84.38
8 0.489 4.445 88.83
9 0.475 4.321 93.15
10 0.419 3.810 96.96
11 0.334 3.037 100.0
Partial Correlation Procedures
bias. However, this paper has adopted shortened version (X1) of items to measure the social desirability factor that was provided byFischer and Fick(1993). We had included the 7 items of shortened version (X1) in our survey questionnaire during original data collection.
Partialling Out of General Factor
Podsakoff and Todor(1985) argued that the first unrotated factor that is driven from factor analysis extracts the great proportion of common bias across all variables. Thus, this factor describes the best estimate of method variance or respondent’s generalized set of responses. Therefore, the impact of this first common factor on the relationships among understudy variables can be assessed by partialling out this factor (Podsakoff & Todor, 1985). The common factor or general factor can be easily partiall out by utilizing SMART-PLS. Five steps are involved in the analyses of the first common factor. These steps are explained as below:
(1) The factor scores for all respondents are calculated on the first unrotated factor and are then transferred into a file of raw output data.
(2) These scores are then added as another variable “general factor” to the cases’ file on existing data set and this file is transferred into the smart-PLS software.
(3) The whole research model is constructed andR2value of endogenous construct is observed.
(4) Then the general factor is added to the endogenous construct, after adding this factor, theR2 value of endogenous construct is again observed and the difference between R2 value before adding the general factor and after adding the general factor is calculated.
(5) If there is a significant increase in the R2 value of endogenous construct after adding the general factor, then this means that there is a major issue of common method bias in the study. On the other hand, if addition of this general factor re-sults into small increase inR2value of endogenous construct, then this reveals that common method bias is not a threat in the study.
Note: In the case of more than one endogenous constructs in a given model, the general factor has to be added to all endogenous constructs and theirR2values are then observed before and after adding the general factor to assess the CMV in the study.
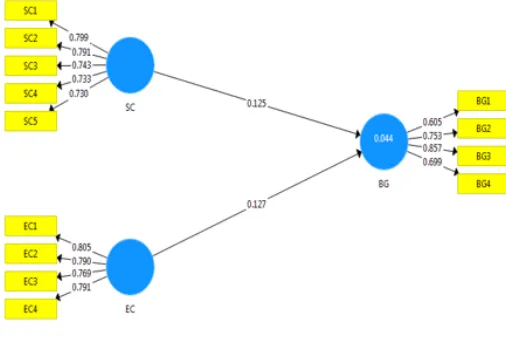
Illustration of Partialling Out of General Factor in PLS Model
and ethical competency) and one dependent latent variable (endogenous construct; i.e. business growth). TheR2value of the endogenous construct before and after adding the general factor was observed. The figure 1 shows that theR2 value of business growth was 0.044 before adding the general factor. After adding the general factor, theR2value of business growth was slightly increased to 0.046 (see figure 2). Thus, adding to this factor does not lead any significant change inR2value of the endogenous construct, this suggests no substantial common method bias in this study.
Figure 1
R2Value of Endogenous Construct before Adding General Factor
Figure 2
Disadvantages of Partialling Out of General Factor
Although this procedure is easy to use as researchers do not have to identify the specific source of CMV before collecting data. But it has disadvantages as well. For instance, it neglects measurement error; this method may reflect variance because of true causal relationships among the constructs and also shows CMV among the constructs’ measures. Therefore, it is not possible to separate the two sources of variations by using this method. As a result, the general factor may act as another variable that produces bias estimates of parameters among the constructs of main interest (Podsakoff et al.,2003). Moreover, we have also noted that like Harman’s Single-Factor Test, it only tests whether common method bias is present or absent in a study but cannot control or correct it.
Partialling Out of a Marker Variable (Lindell and Whitney (2001) Method)
This method was introduced byLindell and Whitney(2001). A marker variable is par-tialled out in a PLS model to assess the common method bias by determining the correla-tion among the marker variable and latent variables. There would be an issue of common method bias if the correlation between any of the latent variable and marker is greater than 0.3 (r>0.3). This procedure can be carried out in PLS software by taking following steps:(1) A model is constructed by using Smart PLS software and a marker variable (us-ing social desirability items) is partialled out (added to the endogenous latent vari-able).
(2) Then the latent variable correlation is examined through PLS-Algorithm to assess the common method bias.
(3) If the correlation among any latent variables and marker variable if found to be greater than 0.3 then it means that common method bias exists in the study.
Illustration of Partialling Out of Marker Variable in PLS Model
Table 2
Correlations among Latent Variables and Marker Variable
Business Growth Ethical Competency Marker Strategic Competency
Business Growth 1
Ethical Competency 0.174 1
Marker -0.139 -0.025 1
Strategic Competency 0.174 0.391 -0.015 1
Figure 3
Partialling Out of Marker VariableLindell and Whitney(2001) Approach
Partialling Out a “Marker” Variable (Podsakoff, Mackenzie, and
Pod-sakoff (2003) Method)
The partial correlation method utilizing the theoretically unrelated marker variable was recommended byPodsakoff et al.(2003) to examine the common method bias in the study. AlthoughPodsakoff et al.(2003) described two approaches of partial correlation methods by partialling out of social desirability items and by partialling out of unrelated marker variable. Since both approaches are similar because unrelated marker variable may com-pose of social desirability items as well. Partialling out a “Marker” Variable is similar to the partialling out of general factor. The only difference is the partiall out of latent marker variable instead of the general factor. This can be done by applying the following steps:
(1) Draw the hypothesized model using Smart PLS software and observe the R2 values of all endogenous latent variables in the model.
(2) Introduce the marker variable on all endogenous constructs.
(4) Compare theR2 values of the endogenous constructs before and after adding the marker variable, if the significant difference is observed in theR2 value of any endogenous construct, then is the evidence of substantial common method bias.
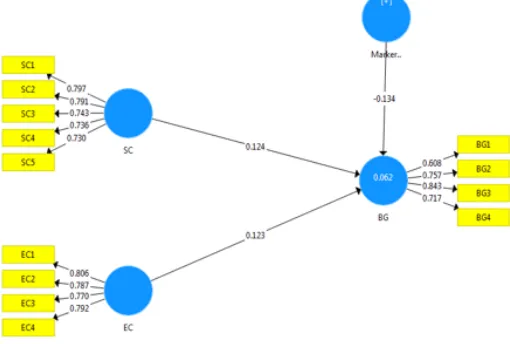
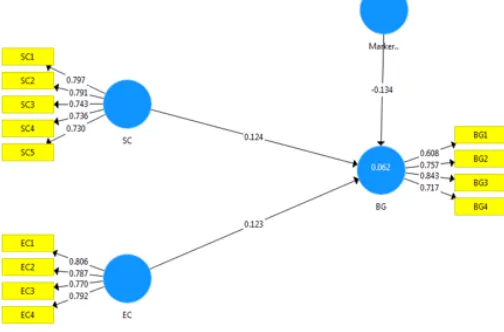
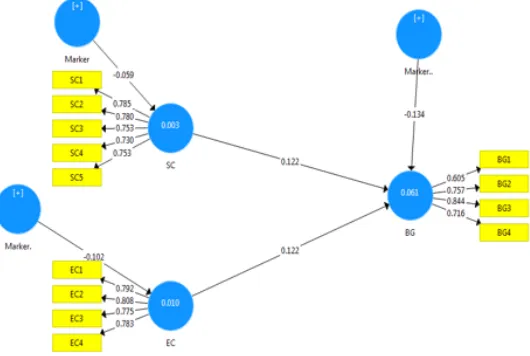
Illustration of Partialling Out a “Marker” Variable (Podsakoff, Mackenzie, and Pod-sakoff (2003) Method)
After applying all above steps we drew a hypothesized model using Smart PLS software and observed theR2value of endogenous construct (see figure 1). Then we partialled out the marker variable on endogenous
Figure 4
Partialling Out a “Marker” VariablePodsakoff et al.(2003) Approach
construct and again observed it’sR2value (see figure 4). We then compared the difference betweenR2value of endogenous construct before and after adding the marker variable (e.g. 0.062-0.044 = 0.018). Thus, the difference of 0.018 was found in the R2 value of endogenous construct after partialling out the marker variable which is not a significant difference. This result has provided another clue of no substantial common method bias in this example.
Disadvantages of Marker Variable Techniques
Correlation Matrix Procedure
Bagozzi, Yi, and Phillips(1991) have described the method of assessing the impact of CMV through latent variables’ correlations. The common method bias will be evident when a substantially large correlation is found among principal constructs (r>0.9). However, CMV will be not an issue in any study if the correlation among constructs is less than 0.9 (Bagozzi et al.,1991).
Illustration of Correlation Matrix Procedure
The research model was drawn using Smart PLS software. Then the latent variables’ cor-relation was observed through PLS Algorithm. The corcor-relation among all the constructs was found less than 0.9 (see table 3). Thus, CMV is not an issue in this study.
Table 3
Correlations among Latent Variables
Business Growth Ethical Competency Strategic Competency
Business Growth 1
Ethical Competency 0.176 1
Strategic Competency 0.175 0.391 1
Disadvantages of Correlation Matrix Procedure
Like previous approaches of Harman’s Single-Factor Test and Partial Correlation Proce-dures, this procedure only examines the presence or absence of common method bias in a study but cannot control and correct it.
The Measured Latent Marker Variable Approach
Chin et al.(2013) introduced a measured latent marker variable (MLMV) method to detect and correct CMV while utilizing partial least squares. This approach can remove the im-pact of CMV on structural paths. To carry out this process, multiple unrelated measures are required to be collected at the same time of data collection for primary research model. The items of Measured Latent Marker Variable (MLMV) should have no nomological re-lationship with other study questions while using the same scale and survey format to reflect the impacts of the common method (Chin et al.,2013). These unrelated measures are labeled as MLMV and are modeled to capture an unrevealed CMV in the data. More-over,Chin et al.(2013) have provided some guidelines in order to select MLMV indicators to include in their data collection. These guidelines are summarized as follows:
(1) Each indicator should not belong to the same domain of constructs.
(2) Different unit of analysis should be used to draw each indicator
(4) MLMV should be included at the end of the well-designed survey because it is not the main purpose of the study.
Chin et al.(2013) have strongly recommended two approaches to detect and minimize the impact of CMV. The first approach is known as construct level correction (CLC). The same number of CMV control constructs as to the model’s constructs are created while using CLC approach. However, each CMV control variable uses the same set of MLMV items and CMV control constructs are modeled as influencing each construct of the model. The second recommended approach is known as item level correction (ILC). ILC in-volves partialling out of MLMV items in order to partial out the impacts of CMV at the level of each measurement item of the construct. In this approach, each item measure has to be regressed on all set of MLMV items. The resulted residuals for each item actu-ally represent the construct items with the removed impact of CMV. However, the CMV should be replaced with the random error in order to assess the reliability of original items in capturing the hidden construct of interest. Therefore,R2is used which is obtained from each item to MLMV regression. Then the square root of theR2is then multiplied with spe-cific random error of each measured item and is then added to each item residual. Then these final ILC items are used in a PLS analyses of the model.
Chin et al.(2013) claimed that second approach is more tedious but it accurately esti-mates the item’s loading. Moreover, structural paths can be accurately estimated by using both approaches relative to other methods of detecting and minimizing CMV.
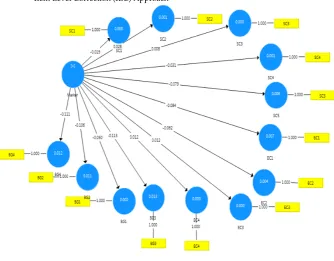
Illustration of Construct Level Correction (CLC) Approach
estimation and PLS estimation, this means that there is no potential impact of CMV on the study’s results, thus, researchers can safely report PLS estimates. Table 4 and Table 5 also show the CLC as well as PLS estimates of path coefficients andR2value respectively.
Table 4
Comparison of Path Coefficients and t-Values by CLC Approach and Original PLS Models
Relationships CLC Estimation Original PLS Estimates CLC Estimation Original PLS Estimates (Path coefficients) (Path coefficients) (t-value) (t-value)
Ethical Competency ->Business Growth 0.122 0.127 **2.498 ***2.646
Strategic Competency ->Business Growth 0.122 0.125 **2.399 ***2.673
Note: Critical t-values **1.96 (significance level= 5%), and ***2.57 (significance level= 1%)
Table 5
Comparison ofR2Values by CLC Approach and Original PLS Models
Endogenous Construct CLC Estimation (R2) Original PLS Estimates (R2)
Business Growth 0.061 0.044
Figure 5
Construct Level Correction (CLC) Approach (PLS Algorithm Estimations)
Illustration of Item Level Correction (ILC) Approach
using excel function.
Figure 6
Construct Level Correction (CLC) Approach (Bootstrapping Estimations)
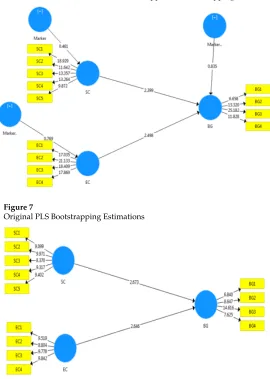
Figure 7
Original PLS Bootstrapping Estimations
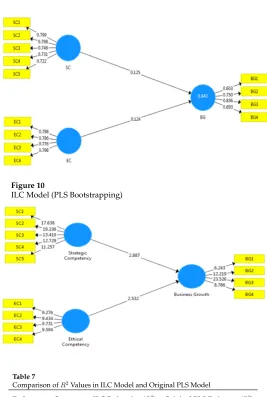
de-creased from 0.127 to 0.124 in ILC model. Similarly, t-values of SC dede-creased from 2.646 to 2.532 and EC increased from 2.673 to 2.887 in ILC model (see table 6). Whereas,R2
value of endogenous construct decreased from 0.044 to 0.043 in ILC model (see table 7). Thus, these non-significant changes show that common method bias did not influence significantly on the relationships among variables, on variance explained by exogenous constructs, and also on the significance of the relationships among constructs. Therefore, CMV is not considered an issue for this study. However, it is important to note that any significant difference between the ILC estimation and PLS estimation would be the indica-tion of CMV in the study. In such a case, researchers are advised to report ILC estimaindica-tion instead PLS estimation to present reliable and valid estimates without any CMV affects. Moreover, if no significant difference is found between ILC estimation and PLS estima-tion, this means that there is no potential impact of CMV on the study’s results, thus, researchers can safely report PLS estimates.
Figure 8
Item Level Correction (ILC) Approach
Table 6
Comparison of Path Coefficients and t-Values in ILC Model and Original PLS Model
Relationships ILC Estimation Original PLS Estimates ILC Estimation Original PLS Estimates (Path coefficients) (Path coefficients) (t-value) (t-value)
Ethical Competency ->Business Growth 0.124 0.127 **2.532 ***2.646
Strategic Competency ->Business Growth 0.125 0.125 ***2.887 ***2.673
Figure 9
ILC Model (PLS Algorithm)
Figure 10
ILC Model (PLS Bootstrapping)
Table 7
Comparison ofR2Values in ILC Model and Original PLS Model
Endogenous Construct ILC Estimation (R2) Original PLS Estimates (R2)
Business Growth 0.043 0.044
Discussion and Conclusion
same respondents to obtain information on both independent and dependent variables, then, the concern over common method variance or same-source bias arises. Because the single source responses may create the problem of common method bias while esti-mating the correlation among the variables. Furthermore, CMV has been considered as a key source of bias especially while analyzing the survey studies, and is continuously aggravating attention among PLS researchers. However, the several tools that exist to control CMV in SEM are mostly developed for CB-SEM that cannot be applied for PLS models. This study has introduced various methods for controlling CMV in the context of PLS path modeling. In addition, the results suggest that the proposed statistical ap-proaches can detect the bias caused by common method variance in PLS estimates as well as can correct the CMV bias. The common method bias is a serious issue that has attracted great attention as a topic in the organizational research. Since at the organizational level researches, it is difficult to get multiple sources to collected data, thus, it is crucial for re-searchers to take all essential steps/remedies to control and remove the common method bias while collecting data from a single source. Moreover, organizational level research has become important in the field of entrepreneurship, where researchers are used to col-lect organizational level data usually from single respondent to represent his/her firm. Therefore, it is crucial to address the issue of common method bias.
then it becomes essential to use statistical remedies to control and remove the common method bias from data analysis. Furthermore, we have also observed that it is difficult for the researchers to follow all procedural remedies to control common method bias be-cause they are often more expensive and time consuming. Therefore, it becomes crucial to use statistical remedies to identify and then control common method bias. We have described step by step approach to conduct the most common statistical remedies to de-tect common method bias. The most of the statistical remedies discussed in this paper are more suitable for PLS models. In addition, we have noted that the most common statistical remedies are Single Harmon Factor Test, Partial Correlation Procedures, and Correlation Matrix Procedure that have been widely used by the researchers to address the issue of common method bias in their studies. Although these remedies have been extensively used in existing studies but they are not sufficient to control common method bias because they all can only test the presence or absence of CMV, but do not correct the common method bias from a given study. However, the two approaches suggested by Chin, Thatcher, Wright, and Steel (2013) namely Construct Level Correction (CLC) and Item Level Correction (ILC) approaches are more effective statistical remedies as they not only assess the common method bias in a given study but can also remove the common method biases from the study. Therefore, we strongly recommend the researchers to use these two approaches in their studies in order to address the issue of CMV. Particularly, if potential CMV is found in study then researchers have to report CLC estimations or ILC estimations to draw conclusion and managerial implications based on more reliable estimates without CMV impacts. However, researchers are suggested to report PLS es-timates for the purpose of drawing conclusion and managerial implications only when no potential impact of CMV is found in the study. Thus, using CLC and ILC techniques, researchers can present their findings with more confidence. On the other hand, the re-searchers have to recollect data if the common method bias is detected by using only commonly used statically remedies (i.e. Single Harmon Factor Test, Partial Correlation Procedures, and Correlation Matrix Procedure). Thus, it is risky to depend only on these common statistical remedies. Therefore, researchers can easily control common method biases by removing CMV through Construct Level Correction (CLC) and Item Level Cor-rection (ILC) approaches. The CLC approach is used primarily to correct estimates for structural paths while the ILC approach can correct estimates for structural paths as well as for item loading (Chin et al.,2013). These two approaches are more suitable for PLS models and are useful as compared to other statistical remedies because once the common method bias is detected from study then researchers can remove it by using these two ap-proaches. In such case, the researchers have to report CLC and ILC estimations which will be the true parameters, whereas, original PLS estimations will be false estimations of parameters if they involve common method bias.
References
Ahmad, N. H. (2007).A cross cultural study of entrepreneurial competencies and entrepreneurial success in SMEs in Australia and Malaysia.(Unpublished doctoral dissertation). Ahmad, N. H., Halim, H. A., & Zainal, S. R. M. (2010). Is entrepreneurial competency the
silver bullet for sme success in a developing nation? International Business Manage-ment,4(2), 67–75.
Antonakis, J., Bendahan, S., Jacquart, P., & Lalive, R. (2010). On making causal claims: A review and recommendations.The Leadership Quarterly,21(6), 1086–1120.
Bachman, J. G., & O’Malley, P. M. (1984). Yea-saying, nay-saying, and going to extremes: Black-white differences in response styles. Public Opinion Quarterly,48(2), 491–509. Bagozzi, R. P., Yi, Y., & Phillips, L. W. (1991). Assessing construct validity in organizational
research. Administrative Science Quarterly,36(3), 421–458.
Baumgartner, H., & Steenkamp, J. B. E. (2001). Response styles in marketing research: A cross-national investigation.Journal of Marketing Research,38(2), 143–156.
Bird, B. (1995). Towards a theory of entrepreneurial competency.Advances in Entrepreneur-ship, Firm Emergence and Growth,2(1), 51–72.
Burton-Jones, A. (2009). Minimizing method bias through programmatic research. MIS Quarterly,33(3), 445–471.
Campbell, D. T., & Fiske, D. W. (1959). Convergent and discriminant validation by the multitrait-multimethod matrix. Psychological Bulletin,56(2), 81–105.
Chang, S. J., Van Witteloostuijn, A., & Eden, L. (2010). From the editors: Common method variance in international business research. Journal of International Business Studies,
41(2), 178–184.
Chin, W. W., Thatcher, J. B., & Wright, R. T. (2012). Assessing common method bias: Problems with the ulmc technique. MIS Quarterly,36(3), 1003–1019.
Chin, W. W., Thatcher, J. B., Wright, R. T., & Steel, D. (2013). Controlling for common method variance in PLS analysis: The measured latent marker variable approach. Springer, Germany.
Crowne, D. P., & Marlowe, D. (1960). A new scale of social desirability independent of psychopathology.Journal of Consulting Psychology,24(4), 349–354.
Doty, D. H., & Glick, W. H. (1998). Common methods bias: Does common methods variance really bias results? Organizational Research Methods,1(4), 374–406.
Fischer, D. G., & Fick, C. (1993). Measuring social desirability: Short forms of the Marlowe-Crowne social desirability scale.Educational and Psychological Measurement,
53(2), 417–424.
Ganster, D. C., Hennessey, H. W., & Luthans, F. (1983). Social desirability response effects: Three alternative models. Academy of Management Journal,26(2), 321–331.
Gefen, D., Straub, D. W., & Rigdon, E. E. (2011). An update and extension to SEM lines for admnistrative and social science research.Management Information Systems Quar-terly,35(2), 3–14.
Jakobsen, M., & Jensen, R. (2015). Common method bias in public management studies.
International Public Management Journal,18(1), 3–30.
Liang, H., Saraf, N., Hu, Q., & Xue, Y. (2007). Assimilation of enterprise systems: The effect of institutional pressures and the mediating role of top management. MIS Quarterly,31(1), 59–87.
Lindell, M. K., & Whitney, D. J. (2001). Accounting for common method variance in cross-sectional research designs. Journal of Applied Psychology,86(1), 114–121. MacKenzie, S. B., & Podsakoff, P. M. (2012). Common method bias in marketing: Causes,
mechanisms, and procedural remedies.Journal of Retailing,88(4), 542–555.
Nederhof, A. J. (1985). Methods of coping with social desirability bias: A review.European Journal of Social Psychology,15(3), 263–280.
Palmatier, R. W. (2016). Improving publishing success at JAMS: Contribution and positioning.
Springer, Germany.
Paulhus, D. L. (1991). Measurement and control of response bias. Academic Press, USA. Perry, J. L. (1996). Measuring public service motivation: An assessment of construct
reliability and validity. Journal of Public Administration Research and Theory,6(1), 5– 22.
Podsakoff, P. M., MacKenzie, S. B., Lee, J. Y., & Podsakoff, N. P. (2003). Common method biases in behavioral research: A critical review of the literature and recommended remedies. Journal of Applied Psychology,88(5), 879–903.
Podsakoff, P. M., MacKenzie, S. B., & Podsakoff, N. P. (2012). Sources of method bias in social science research and recommendations on how to control it. Annual Review of Psychology,63(1), 539–569.
Podsakoff, P. M., & Todor, W. D. (1985). Relationships between leader reward and punish-ment behavior and group processes and productivity. Journal of Management,11(1), 55–73.
Ramanaiah, N. V., Schill, T., & Leung, L. S. (1977). A test of the hypothesis about the two-dimensional nature of the Marlowe-Crowne social desirability scale. Journal of Research in Personality,11(2), 251–259.
Reio, T. G. (2010). The threat of common method variance bias to theory building.Human Resource Development Review,9(4), 405–411.
Reynolds, W. M. (1982). Development of reliable and valid short forms of the Marlowe-Crowne social desirability scale.Journal of Clinical Psychology,38(1), 119–125. Richardson, H. A., Simmering, M. J., & Sturman, M. C. (2009). A tale of three perspectives:
Examining post hoc statistical techniques for detection and correction of common method variance. Organizational Research Methods,12(4), 762–800.
Richter, N. F., Cepeda, G., Rold´an, J. L., & Ringle, C. M. (2015). European management research using partial least squares structural equation modeling (PLS-SEM). Euro-pean Management Journal,33(1), 1–3.
R ¨onkk ¨o, M., & Ylitalo, J. (2011). PLS marker variable approach to diagnosing and con-trolling for method variance. Thirty Second International Conference on Information Systems, Shanghai 2011.
performance in the Malaysian hospitality and tourism industry.Review of Integrative Business and Economics Research,5(2), 47–61.
Strahan, R., & Gerbasi, K. C. (1972). Short, homogeneous versions of the Marlow-Crowne social desirability scale. Journal of Clinical Psychology,28(2), 191–193.
Tehseen, S., & Ramayah, T. (2015). Entrepreneurial competencies and SMEs business success: The contingent role of external integration. Mediterranean Journal of Social Sciences,6(1), 50–61.
Tehseen, S., Sajilan, S., Ramayah, T., & Gadar, K. (2015). An intra-cultural study of en-trepreneurial competencies and SMEs business success in whole sale and retail in-dustries of Malaysia: A conceptual model. Review of Integrative Business and Eco-nomics Research,4(3), 33–48.
Tourangeau, R., Rips, L. J., & Rasinski, K. (2000). The psychology of survey response. Cam-bridge University Press.
Watson, D., & Clark, L. A. (1984). Negative affectivity: The disposition to experience aversive emotional states. Psychological Bulletin,96(3), 465–490.
Williams, L. J., Hartman, N., & Cavazotte, F. (2010). Method variance and marker vari-ables: A review and comprehensive CFA marker technique. Organizational Research Methods,13(3), 477–514.
Appendix
Fischer & Fick’s social desirability scale (Form X1)
• I like to gossip at times.
• There have been occasions when I took advantage of someone.
• I’m always willing to admit it when I make a mistake.
• I sometimes try to get even rather than forgive and forget.
• At times I have really insisted on having things my own way.
• I have never been irked when people expressed ideas very different from my own.
• I have never deliberately said something that hurt someone’s feelings.