A Method for Detecting Damage of Traffic Marks
by Half Celestial Camera Attached to Cars
Takafumi Kawasaki
†1, Takeshi Iwamoto
†2, Michito Matsumoto
†2, Takuro Yonezawa
†1,
Jin Nakazawa
†1, Kazunori Takashio
†1, Hideyuki Tokuda
†1†1
Keio University
5322, Endo, Fujisawa city, Kanagawa, 252-0882 Japan
{drgnman, takuro, jin, kaz, hxt} @ht.sfc.keio.ac.jp
†2
Toyama Prefectural University
5180, Kurokawa, Imizu city, Toyama, 939-0398 Japan
{iwamoto, michito}@pu-toyama.ac.jp
ABSTRACT
Roads are becoming deterioration in everywhere. In some places, traffic marks painted on roads are damaged thus needed to be updated. Municipalities must manage road condition and traffic marks (road painting). It is the municipalities task to manage those roads using, for example, special inspection cars and human eyes. However, the management cost is high if a city contains many roads. This paper proposes a mechanism that automates this management. Our idea is to leverage cameras attached to garbage trucks, which run through the entire city almost everyday. The mechanism collects road images and detects damaged traffic marks using an image recognition algorithm. This paper shows the algorithm and reports the benchmark results. The benchmark showed that the mechanism can detect the damaged traffic marks with 76.6% precision.
Categories and Subject Descriptors
H.4 [Information System Application]: Miscellaneous
General Terms
Experimentation
Keywords
Smart Sensing, Car, Camera, Image Processing
1.
!
INTRODUCTION
Roads are an important property for traffic environments. They are becoming deterioration that in some places traffic marks are scratched due to, for example, a heavy traffic. Roads are also damaged with, furrows and small holes. It is thus a municipality's task to keep the roads updated, checking the traffic marks and road damages continuously. Roads can be checked by either human eyes or special cars equipped with dedicated sensors. The problems are, however, in case of using human eyes, the municipality needs so many people to cover the entire city that it's unpractical. And in the other case using the special cars, they are so expensive that the municipality cannot accommodate an enough number of them to check all the roads frequently. Therefore, we need a mechanism that can automate the road checking with lower cost.
One of such mechanism is participatory sensing [1][2][3][4][5]. In Smart Santander [1][2], citizens are provided with a smart phone application that enables them to report pictures of their findings, including road damages, to the local government. Chiba Repo[3], leverages a similar mechanism. The participatory sensing mechanism like them is good if local citizens are supportive enough. However, they cannot guarantee the enough amount of and fine-grained-enough data to come both spatially and temporally. For example, in Chiba Repo, the most reports are on major streets lacking those for local narrower pathways. The other mechanism is to attach common-off-the-shelf (COTS) sensors, such as an accelerometer and a camera, to cars [6][7]. This is more reliable than the participatory sensing mechanism, however, to the best of the authors knowledge, there is no work that can cover entire city exhaustively.
Based on the above observations, we leverage COTS sensors attached under garbage trucks in this work. The major features of this work are the following three-fold. First, we show an image recognition algorithm to detect damages on traffic marks. The algorithm is simple and can use pictures taken by various cameras. Second, we cover the entire city using garbage trucks. Use of garbage trucks enables us use wide angle cameras and attached under garbage trucks to protect pedestrian’s privacies. We should not capture any pedestrian’s figure with HCC. Third, we estimate our system and describing future works.
The rest of the paper is organized as follows. Section 2 shows Motivation. Section 3 describes traffic marks collection method and damaged traffic marks detection method. Section 4 shows
MOBIQUITOUS 2015, July 22-24, Coimbra, Portugal Copyright © 2015 ICST
implement. Section 5, Section 6, and Section 7 show evaluation, the results, and discussions. Finally, section8 shows the conclusion.
2.
!
MOTIVATION
2.1
!
Management Roads and Traffic Marks
In England, roads are managed by enterprises. Enterprises contract municipalities and this contract is updated every five years. For example, In EU and USA, the rate of roads managed by enterprises is higher than Japan. This management system named PBMC (Performance Based Maintenance Contracting). A reward is paid by a management state of roads in PBMC. This management state is evaluated only by current roads condition. The maintenance limitation is kindly because a frequency in maintenance and processing are decided by enterprises. In fact, the management cost decreases 10%~40% in countries adopt PBMC. However, it is difficult for Japan to adopt PBMC by legal regulations.
In Japan, municipalities must manage road and traffic marks. The both managements are operated as following.
2.1.1
!
Road condition management
Road condition management cost is high. Roads condition are checked by using special inspection cars or human eyes. A special inspection car has a line camera and several sensors. This car uses these sensors to check road condition. A money cost is high, nevertheless this car can check road condition quickly and exactly in a wide area. A money cost is low if roads condition is checked by city employees better than using special inspection cars. Although, road condition is checked by human eyes is inefficient because this method waste much time to city employees. Therefore, it is a hard task for municipalities to check in the wide area and frequently.
2.1.2
!
Traffic marks management
Traffic marks are checked by only human eyes. In Japan, a patrol car of a municipality running several regular routes in a city almost every day, and look at a place when checking and repairing request suggested by citizens in a city. This method may cause a problem that fade out traffic marks are unnoticed so a driver of this car checks traffic marks because this evaluation has a subjectivity. In 2014, in Fujisawa city, traffic marks were checked all roads the entire city first time by city employees. It is a hard task for the municipality to check fixed intervals because the municipality has over 1300 km roads in Fujisawa city. All roads will be checked next 4 years or 5 years after. This interval is not suitable because traffic marks easy to fade out.
We focus to garbage trucks so a garbage truck running the entire city to collect garbage. City employees do not need to go to a spot and check the details. In addition, requisite management cost decrease because this method does not need many employees and patrol cars.
2.2
!
Related Work
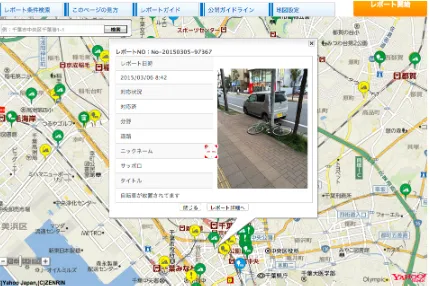
A management of roads needs high cost to repair and check. Some municipality think about a way to solve this problem. One of the solutions is a check method. One of such mechanism is participatory sensing. For example, Smart Santander, City SDK, Chiba Repo (see Figure 1) and Box of Traffic Marks (Web Pages) [4].
Chiba Repo is an application for citizens in Chiba city. Citizens can contribute various opinions and problems in this city through this application. For example, contributed problems are roads, traffic marks, unlawful dumping of garbage and more. There were the most contributions about roads and traffic marks. This system is a valid method for checking them. However, almost all contents are problems of main streets. Problems of suburbs were few. Therefore, it requires to way to check the wide area. This research focuses public garbage trucks because this car runs almost all streets in a city.
Figure 1: Chiba Repo. This is the screen of application. Green icons and yellow icons indicate uploaded place. A window of center indicates date and a request and condition.
Also, Smart Santander is an application. This application purveys people various useful information in Santander. This information is temperature, transports information, brightness, and more. This information is collected by many sensors which were installed in Santander. In addition, infrastructure facilities are attached sensors. These data are purveyed engineers, scholars and citizens. Therefore, they can create various services by these data.
City SDK [5] is service developer kit for cities. This project purposes development of this kit and converts various information of cities into digital data. This project focuses Smart Participation, Smart Mobility and Smart Tourism development now. Smart Participation is developed a system to contribute and sharing problems of about city. Smart Mobility and Smart Tourism are developed a system to develop various mobile services for citizens and tourists. This project tested in 8 cities in EU. Many information convert digital data and various APIs and tools are developed. Participatory sensing is excellent so collecting many and various data nevertheless collection data scale depend on participated user scale. For example, Chiba repo, a least data is uploaded in suburb nevertheless many data are uploaded around the main station. We have to check traffic marks something all over so its exist a very wide area. Therefore, participatory sensing is not enough to check roads and traffic marks condition.
Next, “An Effective Surface Inspection Method of Urban Roads According to The Pavement Management Situation of A municipality” [7]. This method focuses on irregularities of roads. This method used only accelerator sensors. Therefore, this method protects privacies. However, this method cannot detect very small damage. These works are management roads condition. We verify many works to manage roads condition, however, can not verify works to manage traffic marks. Therefore, we focus on traffic marks management.
Figure 2: Capturing people and number plates. Drive recorder capture front view of the car. This capture range include people and other car number around this car.
2.3
!
Design Consideration
This subsection shows requirements to construct our system. We use cameras to analysis traffic marks because it is difficult for traffic marks condition to analysis by accelerometer and pressure sensor. In addition, we use garbage trucks to collect many traffic marks condition in a wide area. We think requirements are Privacy, Spatial Coverage, Frequency and Low Cost.
2.3.1
!
Privacy
Privacies have to be protected when pictures are taken by a camera, because this data is managed by a municipality. Privacies mean personal information such as human faces and number plates. If many data are stolen, it will cause dangerous issues such as criminals. Therefore, it is important to capture only necessary road photos without privacy information.
2.3.2
!
Spatial Coverage
Spatial Coverage means a checking range. Spatial Coverage must be large because traffic marks are installed everywhere. In addition, a damaged traffic mark is found immediately by people in main streets. Although, it is found difficult in suburbs. Therefore, Traffic marks must be checked in every corner of a city.
2.3.3
!
Frequency
Frequency must be high because traffic marks are scratched everyday by heavy traffic. Also, an algorism can guess the road which is easy to be damaged by much data. In addition, the algorism can guess how many days must roads be repaired later by this data. In the result, roads must be checked almost everyday.
2.3.4
!
Low cost
The management cost must be decrease because the cost is burden for municipalities. It is necessary that many employees and patrol cars are not used to check traffic marks condition.
3.
!
DETCTING DAMAGE OF TRAFFIC
MARKS
This section shows traffic marks collection method and traffic marks damage detecting method satisfied to requirement.
3.1
!
Traffic Marks Collection Method
First, garbage trucks are used to collect traffic marks by our system. This car must run everywhere in the city almost every day to collect garbage. Therefore, we think garbage trucks are suitable to satisfy Spatial Coverage and Frequency.
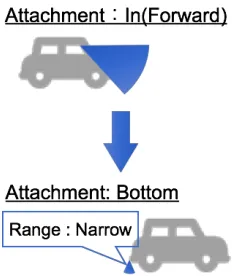
Next, the collecting method is necessary for privacies because data are managed by municipalities. Therefore, cameras take pictures of traffic marks which do not involve people and cars. When taking pictures of traffic marks by the camera, privacy must be protected. Traffic marks are painted on the road, so the camera takes pictures of roads only. Therefore, the camera is attached bottom of a car. If the camera was attached on that position, it is very near to roads. Cameras can take pictures clearly by this situation. Therefore, anyone can check traffic marks condition easily. In addition, cameras take the only road, so it protects privacy. Although, a general camera cannot assure enough range because the camera is very near to roads (see Figure 3). We uses wide range cameras to solve this problem. The camera is a half-celestial camera(HCC).
Figure 3: Attached to bottom of a Car. Capturing range is wide angle when a camera attached front glass. Although, Capturing range is narrow when a camera attached bottom because camera is very near to a road.
We define camera position. When a HCC attached this car, it takes traffic marks. Camera position is defined by checking the picture. In this is case, we use NISSAN JUKE.
Figure 4. Image of attached HCC. A HCC is attached the rear bumper and the center bottom.
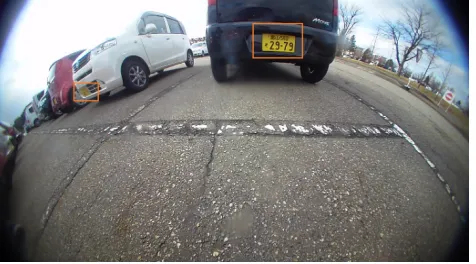
Figure 5: A picture taken by a HCC attached the rear bumper. Figure 5 indicates a picture taken by HCC. Look to number plates of other cars.
Figure 6: A picture taken by a HCC attached the center bottom. This picture cannot be look to people and other cars. In addition, a traffic mark condition are verifed clearly.
3.2
!
Traffic Mark Damage Detection Method
This subsection shows a traffic mark damage detection method.
3.2.1
!
Overview
A damage is detected from pictures by image processing. The method of detecting a traffic mark is processed as following: 1.! Remove noise (rough surface and reflecting brightness) 2.! Set up detecting area in the picture.
3.! Detect traffic marks (by brightness).
Figure7 shows a picture taken by a HCC. White objects of Figure7 are only traffic marks. In addition, white pixels are brighter than
other colors. Therefore, traffic marks can be detected from the picture by specific brightness. In addition, we think some methods to detect a traffic mark damage.
1.! Focusing feature outlines of traffic marks. 2.! Comparing two pictures.
3.! Focusing A change occurs by anti-aliasing. 4.! Machine leaning
We evaluate method 1 and method 2 in this paper. Method 3 cannot verify good evaluation. Method 4 is not implemented yet. Next subsections show about two detecting method. “To focus on outline to traffic marks” (Method 1) and “Compare a traffic image and a processed image” (Method 2).
Figure 7: A picture taken by a HCC. White object only traffic marks in this picture and white pixel is very brightness. Therefore, traffic mark is detected by brightness level.
3.2.2
!
Method1. to Focus on Outline to Traffic Marks
Method1 of detecting a traffic mark damage is processed as following:1.! Remove noise (by smoothing). 2.! Detect traffic mark (by brightness). 3.! Detect outline of traffic marks.
4.! Measure “Sharp pixels” and “White pixels”. 5.! Measure “Outline Percentage”
6.! Detect damage
Measure Outline Percentage:
Outline((Percentage % /ℎ123(345678(/3)
;ℎ4<6(345678(;3)×100
(1)
This percentage name is “Outline Percentage”. The damaged traffic mark is detected by this percentage.
Figure 8: Undamaged traffic marks and damaged traffic marks (Left: UnDamaged, Right: Damaged). Damaged traffic mark has many white objects although undamaged traffic marks has one white object. Damaged traffic mark has many pixels of constructing outline (orange lines) more than undamaged it.
3.2.3
!
Method2. Compare A Traffic mark and A
Processed Image
Method 2 of detecting a traffic mark damage is processed as following:
1.! Remove noises (by smoothing). 2.! Detect traffic mark (by brightness).
3.! Detect a start point and an end point each lines. 4.! Make a processed image.
5.! Measure “Damage percentage”. 6.! Detect damage.
Measure Detect Percentage
Damage((Percentage % 100 − (;ℎ4<6(345678(;3)
CD1E6(345678(C3)×100
(2)
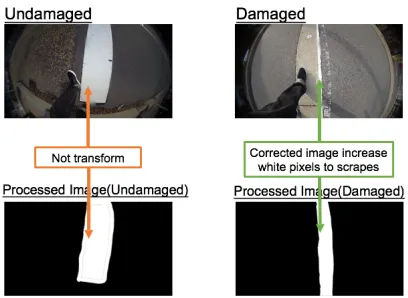
Method2 shows detected a damage by comparing two pictures. First, an image is made from traffic marks of a picture by a processing. This image named processed image. Figure9 showed various images of some traffic marks. On comparing the undamaged traffic marks and the processed image. Two pictures are very similar (see Figure9's left). Although, if it compares the damaged traffic mark and the processed image, two pictures are not similar (see Figure9’s right). The right processed image has white pixels more than the damaged traffic mark. A traffic mark and a processed image different a number of white pixels if a traffic mark has damage.
The white pixels of processed image named “Image pixels (Ip)”. The traffic marks pixels named “White pixels (Wp)”. It measures the ratio that Wp for Ip. This percentage name is “Damage Percentage”. The damaged traffic mark is detected by this percentage.
Figure9. Two traffic marks and two processed images (Left: Undamaged Right: Damaged). The top pictures are traffic marks taken by HCC. The lower pictures are example processed images. Right pictures are completely different although left pictures are not different.
The Method of Making Processed Image
This paragraph describes a way to make a processed image. First, traffic marks are taken from a picture by a processing. A shape of this traffic marks is similar to a thick line. A leftmost point and a rightmost point are connected each column by white pixels. In the result, an image like a thick line is made by this process. This image is a processed image. Figure10 shows the process.
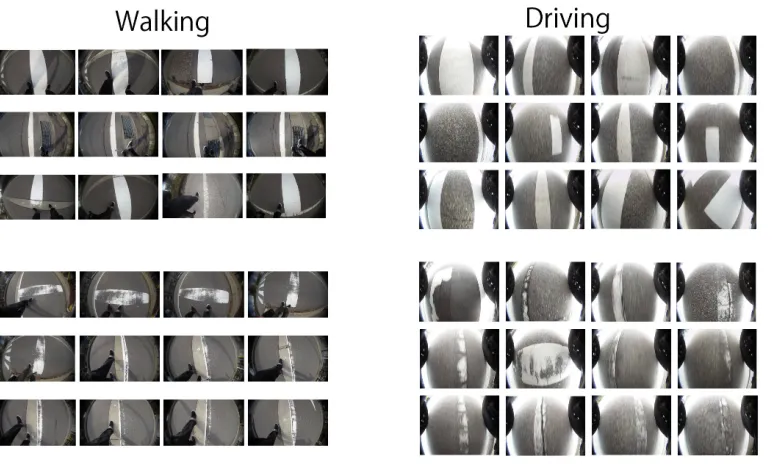
Figure 11: Picture taken when walking and driving. This figure indicates pictures each situation and groups.
4.
!
IMPLEMENTION: DEFINING
THRESHOLD
We have to define thresholds so damaged or undamaged is judged by a threshold in both methods. We think dangerous a car stops high frequency to a public road. In this experiment, using many pictures were taken by a camera when a subject walked.
First, many pictures were divided in two groups. They are “Undamaged” group and “Damaged” group. Each average of pictures is measured by two methods. Next, the threshold is defined by compared average of two groups. Table 1 showed the taking pictures situation. Figure 11 shows pictures.
Table 1: Taking pictures situation. Pictures are 289, undamaged pictures are 80 and damaged pictures are 209.
Road Type Weather Time Pictures (HCC)
Paved Fine The Daytime 289
4.1
!
Method1’s Threshold
Figure 12 shows pictures distribution of each percentage by HCC. The vertical axis is pictures, and the cross axle is outline percentage. Undamaged pictures decrease when outline percentage is bigger than 3% from figure 12. On the other hand, damaged pictures increase when outline percentage is bigger than 4%. Therefore, it defines if outline percentage of the picture is bigger than 3%, a picture has damage.
Figure 12: Pictures distribution of each percentage. This graph indicates how many pictures when each percentage. Undamaged group has the most pictures when 1% and pictures decrease when the percentage bigger than 1%. Damaged group has the most pictures when 8% and pictures increase when the percentage bigger than 1%.
4.2
!
Method2’s Threshold
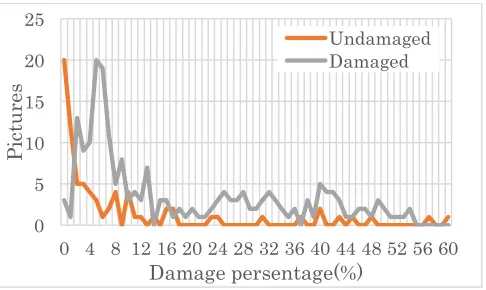
Figure 13 shows pictures distribution of each percentage. The vertical axis is pictures, and the cross axle is damage percentage. There are most no damage pictures at the time of 1% and undamaged pictures decrease when damage percentage is bigger than 3%. On the other hand, there are most damaged pictures at the time of 6%. This cross point is appeared nearby 3%. Damaged pictures are more than undamaged pictures when damage percentage is bigger than 3%. Therefore, it defines if damage percentage of a picture is bigger than 3%, the picture has damage.
0 5 10 15 20 25
1 3 5 7 9 11 13 15 17 19
P
ic
tu
res
Outline Persentage(%)
Figure 13: Pictures distribution of each percentage. This graph indicates how many pictures when each percentage. Undamaged group has the most pictures when 1% and pictures decrease when the percentage bigger than 1%. Damaged group has the most pictures when 6% and pictures increase when the percentage bigger than 2%.
5.
!
EVALUATION
We evaluated two methods in terms of their detecting accuracy.
5.1
!
Evaluation Setting
The HCC is attached car. The HCC takes pictures when the car runs. Attached place of a HCC is mentioned in section 3. Table 2 describes situation when pictures were taken. The running speed of a car supposes under 30km/h. This reason is because garbage trucks often runs under 30km/h. Detecting damage do not process real time. Table 3 indicates operated situation. Figure 11 shows pictures.
Table 2: Took Pictures Situation. Picture taken by a HCC to this situation. Pictures are 242, damaged picture are 164, undamaged pictures are 78.
Road Type Weather Time Pictures (HCC)
Paved Fine The Daytime 242
Table 3: Operated situation. Processing situation.
CPU Intel(R)Corei7-4510
@2.00GHz 2.60GHz
OS Windows8.1
Programing Language Visual Studio2013 C++
Library OpenCV2.4.9
Half Celestial Camera(HCC) QBiC D1
Car NISSAN JUKE
5.2
!
Method1’s Evaluation
Method1’s threshold is 3%. Damaged is detected if outline percentage is bigger than 3%. Table 4 shows the result. The right detecting pictures are 138 and the true positive is 84.1%. This is a high score. On the other hand, the miss detecting pictures are 20.
The false positive is 25.6%. This is the low score. In the result, this precision is 76.6%.
Table 4: Detect accuracy of Method1. This table is detecting accuracy. Tp indicates true positive and Fp indicates false positive. This table does not indicate false negative. False negative score is 15.9%
Group Ground Truth
Right Detect
Tp (%)
Miss Detect
Fp (%)
Precision (%)
Damaged 164 138 84.1 20 25.6 76.6
5.3
!
Method2’s Evaluation
Method2’s threshold is 3%. Damaged is detected if outline percentage is bigger than 3%. Table 5 shows the result. The right detecting pictures are 164 and the true positive is 99.4%. This is a high score. However, the miss detecting pictures are 72. The false positive is 92.3%. This is a very high score. This score is showed almost all pictures are detected damaged. In the result, this precision is 51.8%, this is the low accuracy.
Table 5: Detect accuracy of Method2. This table is detecting accuracy. Tp indicates true positive and Fp indicates false positive. This table does not indicate false negative. False negative score is 0.06%.
Group Ground Truth
Right Detect
Tp (%)
Miss Detect
Fp (%)
precision (%)
Damaged 164 163 99.4 72 92.3 51.8
6.
!
DISCUSSION
The detecting accuracies of two methods are mentioned in section5. The precision of Method1 is better than Method2. In the result, Method1 is the best detecting method. A cause of miss detecting is a way to define a threshold. Pictures are detected false so the threshold is not suitable. Therefore, we have to think a way to define the threshold. In addition, Method2 has another problem. This problem is how to make a processed image. This method makes lines by connecting two points. Figure14 shows a based traffic mark and Figure15 shows a processed image from figure14. Figure15’s shows image is imperfect. If it is made a perfectly processed image, it is the shape and size such as an orange line. However, this image is not much orange lines. The cause of methods is how to takes points. As you can see figure15, if a traffic image damaged outline, this method cannot take right two points. Also, if it never takes white pixel, it cannot connect points. In the result, Figure15's image is imperfection. Therefore, it thinks a new method of making a processed image.
0 5 10 15 20 25
0 4 8 12 16 20 24 28 32 36 40 44 48 52 56 60
P
ic
tu
res
Damage persentage(%)
Figure14: Based Traffic Mark. This picture indicates detecting traffic mark. Traffic marks shape is not clearly so this traffic mark has many damage.
Figure15: Making Processed Image to Figure14. This picture is not completely. The shape of orange lines is completely.
7.
!
CONCLUSION
This paper shows methods of collecting traffic marks and detecting damage. We use garbage trucks to collect in a wide area and use HCC to take pictures. A HCC is attached a body bottom of a car to protect privacy when takes pictures. Two detecting methods are implemented. In Method1’s result, the true positive is 84.1% and the precision is 76.6%. The true positive of Method2 is 99.4%. It is better than Method1. Although, this precision is 51.8% because false positive is very high. In the result, Method1 shows the best score. However, both methods have several imitations. For example, complex traffic marks cannot be detected by both methods. We have to think a way to define suitable threshold. In addition, evaluation of this paper was done in sunny daytime. In the future works, we have to evaluate our system with various weather condition.
REFERENCES
[1].! J. Hernández-Muñoz, J. Vercher, L. Muñoz, J. Galache, M. Presser, L. Gómez, J. Pettersson, "Smart cities at the forefront of the future Internet", J. Domingue, A. Galis, A. Gavras, T. Zahariadis, D. Lambert (Eds.), The Future Internet, Springer-Verlag, Berlin, Heidelberg (2011), pp. 447–462
[2].! Smart Santander http://www.smartsantander.eu/ [3].! Chiba Repo. http://chibarepo.force.com/
[4].! Box of Traffic Marks.
http://www.keishicho.metro.tokyo.jp/kotu/traffic_box/sign. htm
[5].! City SDK http://www.citysdk.eu/
[6].! Tetsuya.K, Hiroaki.S, Junichi.Y “Detection of Road Condition with CCD Cameras Mounted on a Vehicle”, The IEICE Transactions Vol.124 No.3, P.753-760
[7].! Kazuya.T, Shun.F, Tateki.I “An Effective Surface Inspection Method of Urban Roads According to The Pavement Management Situation of A municipality”, Japan Society of Civil Engineers Ser.F3 69(2)
[8].! Muneo.Y, Tetsuyam.T Koji.U, Isao.H, Sadayuki.T, Shin.Y “A Study of the Road Surface Condition Detection Technique based on the Image Information for
Development on a Vehicle” The transactions of the Institute of Electrical Engineers of Japan. C, A publication of Electronics, Information and System Society(2004) 124(3), pp.753-760
[9].! Tomohiro.N, Tomoya.M, YOH.S “A Method of detecting changes of road surface condition with smartphone” Multimedia, Distributed, Cooperative, and Mobile Symposium(2013) pp.131-138
[10].! Michio.T, Takashi.M, Satoru.M, Koji.I, Yasunori.Y “Dry/Wet Judgment of Road Surface Using Gabor Filtering of Vehicle Camera Images”, The IEICE Transactions (2011) Vol.35, No.9, pp.263-267
[11].! Keisuke.U “Sensing network: Probe Vehicle System: Getting Environmental Information Using Vehicle Sensors” IPSJ Journal (2010) pp.1144- 1149
[12].! Masafumi.N, Tomokazu.T, Daisuke.D, Ichiro.I, Hiroshi.M, Yoshiko.K, Takashi.N “Detection of Road Markings Recorded in In-Vehicle Camera Images by Using Position-Dependent Classifiers”, IEEJ Transactions on Sensors and Micromachines (2011) 131(4), pp.466-474
[13].! Sho.S, Satoshi.Y “Road Sign Recognition with Color and Edge based features”, ITS(2009) 108, pp23-28