Food Consumption Tracker with Health Advises
by Food Photos and Labels
Wai-Man Pang
1,∗, Vane-Ing Tian
2,
Geoffrey
Poon
11School of Computing and Information Sciences, Caritas Institute of Higher Education
2The Open University of Hong Kong
Abstract
Obesity, overweight, allergy and additives related disease are common health problems worldwide nowadays. Many of these problems directly relate to food consumption and dietary habits. Hence keep tracking food intake and knowing the consumed food ingredients are essential for a healthy life. However, tracking daily consumption is tedious, and seldom be kept for long. This paper presented a mobile solution to leverage these problems and provide health advices on food consumption adaptively. Users can simply take photos of their meals as they usually do for dietary record. Our system then automatically recognizes the food type and provides useful statistics for analysis. We can know the packaged food better with barcode scanning and text recognition of food labels. All captured information provide basis for proper alert on allergen, suggestions to achieve health and balanced dietary. A preliminary study reveals that this is welcomed by most users who care about their dietary.
1. Introduction
According to WHO, there are more than 1.9 billion adults suffering from overweight, while 650 million are even obese in 2016. Similarly, a recent study reported that there are about 5% of children and 4% of adults allergic to one or more kinds of food. 90% of their allergic responses are caused by common foods such as cow’s milk, peanuts, and eggs. Some studies also believe that food additives and preservatives can increase hyperactive behavior in young children. According to the literature [4,7,21], we can find that many of these health problems are related to our daily dietary habits and food consumed. For example, long term consumption of high calorie food, like fast food, causes overweight more easily; allergy to food may even cause fatal consequences instantly when the dietary include the allergic ingredient. However, understanding and keep tracking daily dietary intake can be tedious and require specific knowledge in
HPlease ensure that you use the most up to date class file, available from EAI at http://doc.eai.eu/publications/transactions/ latex/
∗Corresponding author. Email:wmpang@ieee.org
judging whether certain food had positive or negative effects to our health. That is almost impossible for most people with a busy life in big cities nowadays.
In this paper, we will introduce a novel mobile solution to facilitate the food consumption tracking with minimal efforts from users. A mobile app is developed with capability of food category recognition and food label reading which speed up the data collection of dietary records. Users only require to take photos of every consumed food or scanning ingredient labels on packaged food in order to collect and record information of their daily dietary. With proper collection of dietary information of user, our system can provide short term reminders and long term analysis related to healthy dietary.
According to Kao and Liebovitz [12], the top two categories of mHealth apps are wellness management and chronic disease management. Wellness management app allow consumers to keep track of their diets, personal food and exercise diaries, so that they can manage their weights and therefore health better. It is also preferable for these apps to contain a substantial food database, provide personalized advice and use social network to
1
EAI Endorsed Transactions
on Ambient Systems
Research Article
Receivedon 19 December 2017;acceptedon 21 March 2018;publishedon 23 March 2018 Keywords:classfile,LATEX2ε,EAIEndorsedTransactions
Copyright © 2018 Wai-Man Pangetal.,licensedto EAI.Thisisanopenaccessarticledistributedunderthetermsofthe CreativeCommonsAttributionlicense(http://creativecommons.org/licenses/by/3.0/),whichpermitsunlimited use,distributionandreproductioninanymediumsolongastheoriginalworkisproperlycited.
doi:10.4108/eai.23-3-2018.154374
EAI Endorsed Transactions on Ambient Systems
further motivate the consumers to achieve their goals. Thus, apart from convenient ways in identifying food type or the ingredients of food products from barcode scanning or text recognition of ingredient label, our system maintains an ingredient database as well as pool of health suggestions going to support automatic advices via cloud services.
Figure 1 shows two use cases or scenarios of our
mobile application. User takes a food photo as record of his/her dietary similar to Figure1(a). Our mobile app is able to categorize the food consumed and provides healthy diet suggestion in the following days. Another use case is for the consumption of packaged food, he/she scan the barcode or the text printed on the package to understand and record detail ingredient list as in Figure 1(b). Both scenarios demonstrate the novelty in our mobile application: using vision technologies to leverage the tedious input of daily dietary records.
The advantages are two folds. First, we can quickly analyze our food ubiquitously. People with food allergies can thus avoid allergens from packaged food with a simple scan. Moreover, we can understand the food additives and preservatives intake, and potentially decrease related risk that causes to health. Second, collected with enough daily dietary intake data, one can observe pattern of the food consumption of a particular user. Further analysis can be done to understand whether a balance diet is achieved. Hence, personalized dietary suggestions can be provided even in a daily manner.
Several major technical challenges are involved in this project: food recognition, text recognition in ingredient label and automatic health suggestion. Food recognition by photography is a relatively new area of research in computer vision. This also brings novelty to our application, so that a fast user input is incorporated. With the use of the Food-11 dataset [29], our deep learning based solution can automatically categorize food contained in an image into 11 categories, including Bread, Soup, Dessert, Vegetable/Fruit and etc. Therefore, we can have a full record of the food intake of user in order to provide suggestion on balance of dietary based on the food guide pyramid. We perform the food category prediction on the server-side instead of the mobile client, as the process require many computations which can be slow on a mobile device. In contrast to Singla et al. [29], we tested against three CNN models of their performances in recognition. We found that ResNet outperforms GoogLeNet with an accuracy of about 93% which is the best out of other trained deep learning models.
The second technical challenges being the text recognition on packaged food labels. Although text recognition or optical character recognition (OCR) had reported many successful results from the literature, existing mobile OCR engines may not perform well especially when the recognition is done under poor
(a) (b)
Figure 1. Usage scenario of our mobile app: (a) a user can keep track of his/her dietary by simply taking photo, our system understands the type of food consumed automatically, (b) a user can easily understand more on the ingredients of a food product by simple scanning.
lighting conditions. Thus, we employed several image processing techniques to reduce effect caused by poor lighting, and incorporating approximate matching to our ingredient database in order to improve the recognition outcome. Moreover, providing health related suggestions purely based on the elements listed on the ingredient list is insufficient. It is because some ingredients are correlated and contains similar effects after consumption. Na¨ıvely providing suggestions may generate tons of duplicated messages and easily overwhelm users. So, we proposed a method to consolidate and better organize the suggestions.
A number of users are invited for testing our app. Most of them are satisfactory to the functionality provided and think the health suggestion are helpful for choosing food products. With our system, the ingredient label becomes more meaningful to everyone. The public can understand more about what they eat and eat wisely. We believe that this application will promote the awareness of healthy eating habits as well as to help people with food allergy to regain certain pleasures of eating in their life.
The reminding of this paper is organized as follow.
Section 2 will review the literature of wellness
management with mobile solution and technical
approaches of food recognition from photos. Section 3
presents a system overview of our food consumption tracker. Then, we describe in detail of our food
recognition module and related improvements in
Section 4. Section 5 discuss our food label scanning functionality. Experimental results and user studies related to our core modules are presented in Section 6. Finally, we have our conclusion in Section7.
2. Related Works
2.1. mHealth for Dietary Management
In recent years, many systems for mobile
health (mHealth) have been developed and widely accepted by the public and healthcare professionals [34].
Most of them are common in exploiting the
ubiquitous nature of mobile applications in order
2 EAI Endorsed Transactions Ambient Systemson
to provide monitoring or tracking of physiological status [22,24, 26, 28].
Among all these examples, food monitoring or logging system is a popular kind of mHealth applications. These food monitoring systems mainly target to analyze the food habit of users and provide suggestions or alert for the diet program of the users. SapoFitness [27] is a mHealth application for dietary assessment. This application provides a list of food for user to input the calories intake. ˚Arsand [3] developed a set of useful functionalities for mHealth application for diabetes. This application require the user to take photos of the food intake, and send to their medical provider. Unlike our system, this kind of application usually cannot help the users in choosing a new product before they make a purchase. Moreover, the understanding of dietary had to be performed offline manually, so a few amount of supported users can be supported and is expected to involve high costs.
MyFitnessPal [25] obtains the nutritional values of food by scanning the barcode and suggests users how to keep fit. Image-based food monitoring systems [2,14] recognize the foods by analyzing food photos. This allows the user to learn the food ingredients or nutrition by simply taking photo. Available works for people with food allergy [1, 8] allow the user to check the existence of food allergens by barcode scan of package labels. Leidinger et al. [16] have a similar idea to ours. They presented a mobile user interface to read the ingredients label using OCR. However, they did not provide health advice to people with food allergy. Moreover, these systems all require the products to be registered in the database for their system. In contrast, our system can read the ingredients label and find out food allergens even if the product is not found in the database.
2.2. Food Image Recognition
Food recognition from photo is to classify major food category based on the visual appearance. Joutou et al. [11] collected a Japanese food dataset with a total of 50 classes and classify them with classical machine learning approaches. The UEC-FOOD100 [20]
and ETHZFood-101 datasets [5] are also famous
comprehensive datasets which contain near 100 types of food as well as food photos over ten thousands. UEC-Food256 [13] contains even more kinds of food and number of photos while mostly Japanese dishes. Matsuda et al. [20] experimented with the UEC-FOOD100 and UEC-FOOD256 achieved top-1 accuracy up to about 70%. Later, Liu et al. [19] proposed a modified inception based network inspired by the Network-in-Network idea from Lin et al. [18] to arrive an even higher recognition rate of the UEC-FOOD datasets. Hassannejad et al. [9] attempted using a deeper model than prior works, and based on inception-v3 [32] to obtain a better accuracy.
Recently, Food-11 dataset [29] is developed based photos from UEC-FOOD datasets, but re-categorizes food according to the taxonomy defined by United States Department of Agriculture (USDA) [23]. Eleven kinds of food are identified containing bread, dairy products, dessert, egg, fried food, meat, noodles, rice, seafood, soup and vegetable/fruit. The authors also experimented using a pretrained GoogLeNet to train a classifier for food photo with satisfactory results. Following their idea and the Food-11 dataset, which we found to be more useful for an automatic review of balanced dietary consumption, we further investigated the employment of Residual Network (ResNet) [10] to obtain even better results.
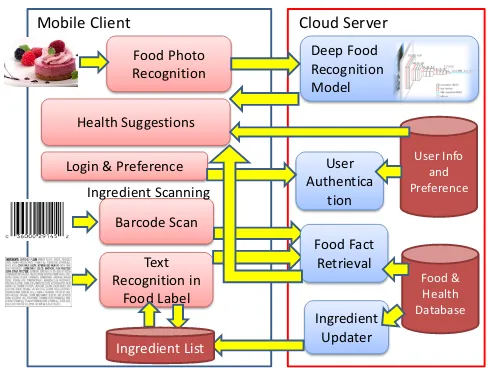
3. System Overview
Our system is mainly divided into three major
components, they are the food recognition module, ingredient scanning module, and health suggestion & repository module. Figure2depicts the relations between components in the system.
At top of the figure shows the food recognition module which is responsible for receiving food photo taken from the mobile client and through a deep learned model on the server side for analyzing the food category. We can find that the recognized result is sent back to the client as reference for further health suggestions, like balanced dietary recommendation.
The ingredient scanning module enables the user to identify food product and related ingredient quickly with barcode scanning, as well as text recognition of ingredient label when the food product is not available in the food database.
The health suggestion module relies on the food & health database on the server, together with the user’s preferences stored with his/her user account which is managed by the user authentication module. Finally, the food & health database stores updated information about food products including its product name, ingredient, manufacturer, health suggestion, and etc.
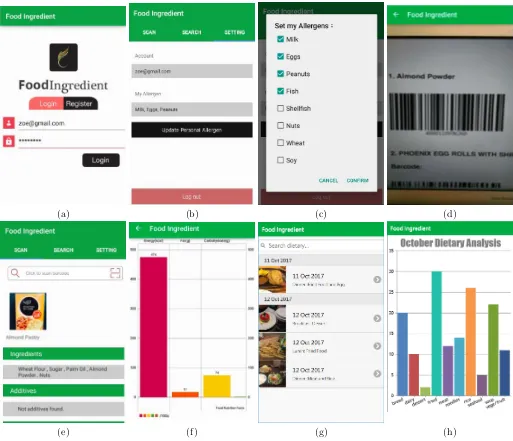
Following the standard of mobile apps nowadays, the interface is designed to be simple and user
friendly enough for daily use. Figure 3 shows a
number of screenshots of our mobile app. To enable personalization and support user preferences, user has to login (Figure 3(a)) to our system. The user preferences include selection of allergic ingredients to give alert (Figure3(b) and (c)).
4. Food Recognition
Our food recognition module consists of a learning based recognition method which can differentiate the type of food within a given image. Most of the recent food recognition methods are based on deep learning
3 EAI Endorsed Transactions Ambient Systemson
Text Recognition in
Food Label Barcode Scan
Ingredient Updater Mobile Client
Food & Health Database
Food Fact Retrieval Ingredient Scanning
Ingredient List
Cloud Server
Health Suggestions
User Info and Preference
Login & Preference User
Authentica tion Food Photo
Recognition
Deep Food Recognition Model
Figure 2. System Overview
technologies which commonly required large amount of tagged data for the purpose of training. There are couple of food photo recognition datasets available, the most comprehensive ones include ETH Food-101 [5],
UEC-FOOD100 [20] and UEC-FOOD256 [13]. While most
of the existing ones involved only cooked dishes but omitting fresh raw food materials. Until recently, the Food-11 dataset [29] is created by collecting 11 categories of food, including bread, dessert, vegetable, fruit and etc. This fits our needs well, as it is common to have a larger varieties in our daily meal.
4.1. Deep Network Architecture and Training
As proposed by Singla et al. [29], a pretrained
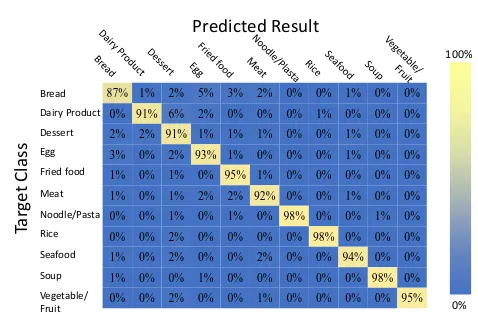
GoogLeNet [31] is employed to the Food-11 dataset to achieve a satisfactory result. While we further investigate if any other alternatives will work better in the success rate of recognition, and finally pretrained Residual Network (ResNet50) [10] is found to achieve a higher accuracy than GoogLeNet. Thus, ResNet50 is chosen as our network architecture used in our food recognition module. Figure4shows the confusion matrix in recognizing the food-11 dataset. It is obvious to find a majority in the diagonal of the confusion matrix. Most of the classes reach over 90% of accuracy except for Bread category. More detailed experimental results and comparisons can refer to section4
4.2. Distributed Implementation
Our food recognition is for the use in a mobile environment. As mentioned in Section3, we implement this function in a distributed system whereas the server will complete most of the recognition task. The mobile client captures the food photo and send via the network by RESTful web services. Finally, server returns with
the top-5 recognized results and their corresponding confidence scores back to the mobile client for dietary record.
In our current implementation, our mobile client will take the top-2 categories as the major ingredients in a certain diet, if these food category received a confidence score over 5%. Figure3(g) shows a list of dietary history with food photos taken and food type recognized. Based on the time the photo is taken, our client application determines the meal is breakfast, lunch or dinner. User can review the monthly food in-taken as in Figure3(h). With the collected counts of the 11 food categories within the review period, we can analyze whether the user had a biased diet and provide related suggestion.
5. Food Label Scanning
For packaged food, it is usual that the package contains more detail information about the food. Almost all packaged food products are printed with barcode labels, but it is designed for sale purposes. It is seldom for the barcode to associate with food ingredient information or even health related suggestions. Thus, many databases are developed to include barcode-ingredient relation. However, most of these databases are proprietary, except the open food facts [33], or they do not fully cover enough food product entries.
Taking open food facts as an example, it contains 50,000 entries of food products from 134 countries, but most of them are from Europe. The database stores many useful product related data, including the generic name, category, list of ingredients, nutrition facts and etc. Thus, we directly make use of these existing entries for a preliminary retrieval of ingredients. While, we also have our own database which is built to tailor for local food products. Thus, whenever an entry does not exist in the open database, we will rely on our own. Figure 3(e) shows the food ingredient retrieval result by scanning the barcode. Our database also contains nutrition facts information like the amount (in g) of energy, fat, carbohydrate and etc (see Figure3(f)).
However, most of the food database contains only manufacturing and nutrition information of the food product. No health related information is included. Our food & health database therefore serves this purpose by associating health recommendations to ingredients. The major effective component in the ingredients are factored out so as to produce useful and tidy suggestions in time. For example, many food ingredients like gluten, wheat, and rye, may cause the same gluten allergy, because all of them contains gluten which is the actual source of allergy. Thus, the recommendations are associated with the actual source gluten only but not the ingredient as in Figure5(a).
Similarly, some additives are made of other ingredients which further causes other health problems. Like
4 EAI Endorsed Transactions on
Ambient Systems
(a) (b) (c) (d)
(e) (f) (g) (h)
Figure 3. The user interface of our mobile application, including a) user login page, b) account settings, c) allergen selection, d) scanning of barcode or photo taking, e) food ingredient details, f) nutrition details, g) list of dietary records and h) dietary statistics.
Figure 5(b), additive E322 is made from soybeans and egg yolk. Thus, additive E322 should produce similar health suggestions to soybeans and egg yolk. This decomposition of ingredient to effective components can avoid repeated suggestions which overwhelm the user.
5.1. Text Recognition in Ingredient Labels
One way to identify the food ingredient is to read the ingredient list printed on the package of food. This ingredient list can be easily found on many packaged food products as it is required by the safety regulation of many countries. However, reading all the ingredient lists of every food one-by-one is tedious and sometimes
difficult. Some ingredients, like additives, are either not well-known to the general public or written in scientific names. For instance, not many people know that “Mandelona” and “Enchilada sauce” are two ingredients which contain peanuts.
As a result, our mobile app allows users to scan the label, and analyze the ingredients. To accomplish this, we rely on OCR techniques with improvements in speed and accuracy by means of text region extraction, adaptive thresholding, and approximate matching.
Text Region Extraction Before recognition, our
method tries to locate text regions in image. Thus, we employ MSER (Maximally Stable Extremal Regions) [6]
5 EAI Endorsed Transactions Ambient Systemson
Bread Dessert Meat Seafood Dairy Product Fried food Rice Vegetable/ Fruit Egg Noodle/Pasta Soup Tar ge t Cl ass Predicted Result 100% 0%
87% 1% 2% 5% 3% 2% 0% 0% 1% 0% 0%
0% 91% 6% 2% 0% 0% 0% 1% 0% 0% 0%
2% 2% 91% 1% 1% 1% 0% 0% 1% 0% 0%
3% 0% 2% 93% 1% 0% 0% 0% 1% 0% 0%
1% 0% 1% 0% 95% 1% 0% 0% 0% 0% 0%
1% 0% 1% 2% 2% 92% 0% 0% 1% 0% 0%
0% 0% 1% 0% 1% 0% 98% 0% 0% 1% 0%
0% 0% 2% 0% 0% 0% 0% 98% 0% 0% 0%
1% 0% 2% 0% 0% 2% 0% 0% 94% 0% 0%
1% 0% 0% 1% 0% 0% 0% 0% 0% 98% 0%
0% 0% 2% 0% 0% 1% 0% 0% 0% 0% 95%
Figure 4. Confusion Matrix of our trained food recognition module.
(a) (b)
Figure 5. Relationship between food ingredients and health suggestions.
algorithm for fast region detection as shown in Figure7. It will extract regions (in red) which have high chance containing text. Hence, later processing like image enhancement and OCR will only involve these extracted regions. This speeds up a lot as irrelevant regions are ignored. Moreover, we can effectively reduce noise generated from OCR as non-text parts are filtered out before the recognition.
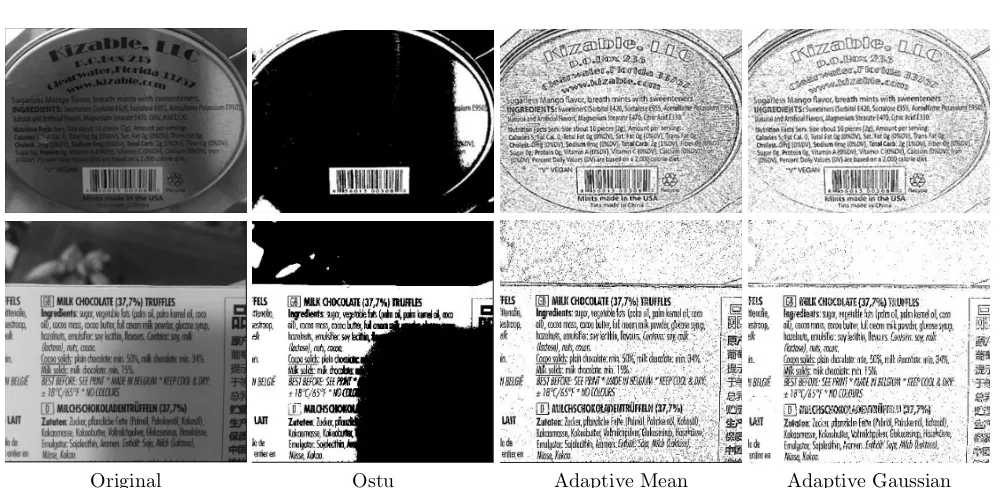
Adaptive Thresholding Most of the text recognition
engines begin with a gray-scale conversion of image and followed by a thresholding to produce a binary image. In our implementation, we use Tesseract-OCR engine [30] which preforms thresholding with Otsu approach. However, the Otsu method does not work well under extreme lighting conditions, like environment containing regions that are too bright and too dark.
We, therefore, try to improve thresholding with the use of adaptive approaches, including the Adaptive Mean and Adaptive Gaussian Thresholding. Figure6shows the results with different methods. Otsu thresholding always fails to handle changes of brightness across text regions. Shadow regions will completely turn into black, seriously ruins the recognition. Both adaptive methods generate more reasonable binary results useful for subsequent recognitions.
Approximate Matching Directly performing
recog-nition with Tesseract-OCR engine does not always pro-vide acceptable results in practice. One reason is that the thresholding result always contains noise. Thus, the recognized text outcome usually looks scrambled or incorrect as shown in Figure 7 or Figure 8(b). It often returns paragraphs of text with extra punctuations or irrelevant digits (Figure 7) and some spelling of words are wrong (underlined in Figure8(b) in red). Moreover, we would like to extract only words that are ingredients, and remove those irrelevant like product name, weight or manufacturer name.
To tidy up the results, our idea is to remove or correct them based on our ingredient list. That means only words that are certain or likely to be ingredient will be extracted. Currently, we have implemented a full text search with criteria to approximate match strings that are smaller than half word length of the ingredient name. A simple approximate string distance measure based on the Levenshtein algorithm [17] is employed with a quick pruning when the word length difference is more than double. Figure8(c) demonstrates an example of applying approximate matching after OCR. We can find that many of the wrongly recognized words in Figure 8(b) are now corrected with the use of ingredient list.
6. Preliminary Results
6.1. Accuracy of Food Recognition
To better understand the strength of our food
recognition module, we compare our results with other state-of-the-art deep CNN models including AlexNet [15] and GoogLeNet [31].
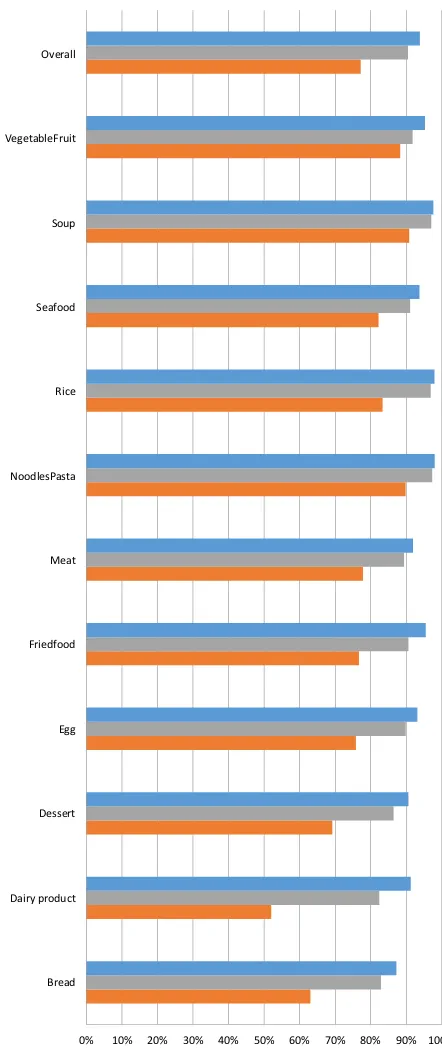
Table 1 shows the overall accuracy, recall and F1-score of using three conventional CNN models for training and recognizing the Food-11 dataset. Our model (ResNet) received the highest scores in all three metrics and achieved over 93%. We can also find per-category accuracy in Figure9. Across all the eleven categories, it is very consistent that our trained ResNet outperforms both GoogLeNet and AlexNet results. Bread and dessert are the two food categories which recognized poorest among all eleven food types, while they are still close to 90% accuracy.
Apart from quantitative analysis, we tested against a number of food photos contributed by our users when using our mobile application. Figure10listed the tested sample images and the corresponding top-2 recognized food categories from the three trained models. For all shown cases, our deep learned classifier performs reasonably well; all top confidence class are correctly identifying the main food kind appearing inside the image. Despite the original pre-trained GoogLeNet used in [29] obtained most of the results same as ours, we can find that it misclassified the Japanese pork set in Figure10(d) as Egg.
6 EAI Endorsed Transactions
on Ambient Systems
Original Ostu Adaptive Mean Adaptive Gaussian
Figure 6. Comparison of different thresholding methods.
Figure 7. left: Text region detection. The red colored box indicates the detected regions containing character. right: the corresponding scrambled OCR results.
(a) (b) (c)
Figure 8. Recognition accuracy improved with use of approximate matching with the ingredient list. (a) Original food label, (b) result directly from OCR, (c) result tidied up.
6.2. User Study
To evaluate the effectiveness of the developed mobile application and obtain useful user opinions for further improvements, a small scale user study is carried out. A total of 20 subjects are asked to make a trial to our app using an Android phone with Qualcomm snapdragon
Methods
Accuracy
Recall
F1-score
AlexNet [
15
]
77.18%
78.09%
77.53%
GoogleNet [
31
]
90.50%
90.21%
90.31%
ResNet50 [
10
]
93.82%
93.30%
93.53%
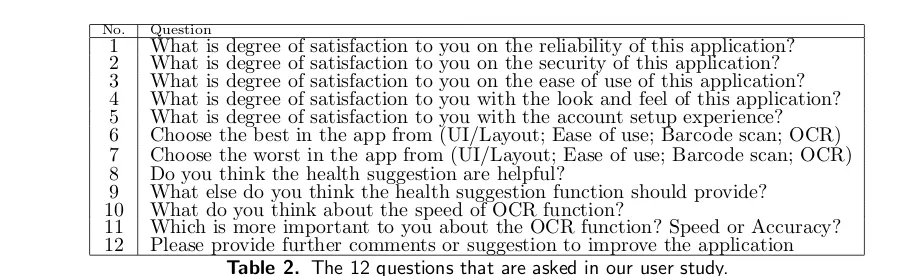
Table 1. Overall accuracy, recall and F1 scores of the trained CNN models for food category recognition with photos with the Food-11 dataset.615 CPU and 2GB RAM, followed by completing 12 questions listed in Table2.
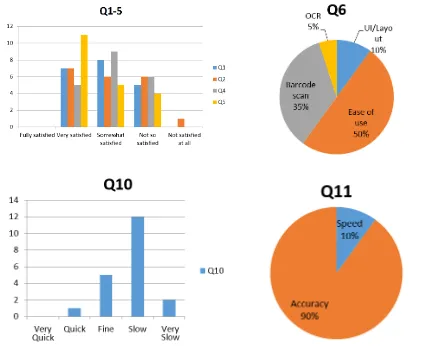
Some of the responses to the questions are shown in Figure11. We can find that the satisfactions to different aspects of our application are slightly satisfied in general, with nearly no unsatisfied or totally satisfied. Most of the users think ease of use is one of the best parts in our application, while barcode scan is also another part which they like most. Regarding to the speed of OCR, over half of them think it is slow, this may be caused by the low-end android device and the preprocessing is not optimized yet. It is also the reason why only 5% of them think OCR is the best part in the mobile app. In contrast to speed of OCR, over 90% of the users will prefer to have better accuracy in the text recognition which is the focus of enhancement we made in the current prototype.
Besides the above responses, the interviewees further provide us some useful suggestions. For example, they suggest that the app should support more languages and localization. They also suggest that we can extend to other allergens such as metal, animal skin tissue, dust mites etc. Some of them want the app to include
7 EAI Endorsed Transactions Ambient Systemson
No. Question
1 What is degree of satisfaction to you on the reliability of this application? 2 What is degree of satisfaction to you on the security of this application? 3 What is degree of satisfaction to you on the ease of use of this application? 4 What is degree of satisfaction to you with the look and feel of this application? 5 What is degree of satisfaction to you with the account setup experience? 6 Choose the best in the app from (UI/Layout; Ease of use; Barcode scan; OCR) 7 Choose the worst in the app from (UI/Layout; Ease of use; Barcode scan; OCR) 8 Do you think the health suggestion are helpful?
9 What else do you think the health suggestion function should provide?
10 What do you think about the speed of OCR function?
11 Which is more important to you about the OCR function? Speed or Accuracy?
12 Please provide further comments or suggestion to improve the application
Table 2. The 12 questions that are asked in our user study.
additional information to the users; for instance, the first aid guide about suffered from allergen by mistake.
7. Conclusions
We presented a prototype of a mobile food consumption tracking application which is useful for monitoring daily dietary in a long term manner. With the capability of recognizing food photos taken by user, our system can manage to understand if the user have a balanced dietary. In addition, to further understand food ingredient intake, our app allows scanning of the barcode or ingredients labels on packaged food products to obtain included ingredients and provide proper health suggestions. A preliminary user study reveals that our application is ease to use and potentially helpful to promote healthy dietary to the general public. The current food recognition method identify only one type of food in a photo, however, it is common that there are multiple kinds of food within a single photo. Similar to Figure reffig:foodphotos (b), (d) and (e), there are various food in a set or a meal. A possible extension is to incorporate the current deep trained network into a RCNN model so that the bounding boxes of the food can also be identified. We prepare to implement this functionality in our next version of the mobile application. In addition, the speed of scanning ingredient labels should be further improved, and multiple languages should be supported to enable users in identifying the potential allergens and additive for imported food with ingredient labels written in foreign languages.
Acknowledgment
The work described in this paper was fully supported by a grant from the Research Grants Council of the Hong Kong SAR, China (Ref. No. UGC/FDS11/E03/15). The Titan Xp used for this research was donated by the NVIDIA Corporation.
References
[1] Robert Adelmann. Mobile phone based interaction with everyday products-on the go. InThe 2007 International
Conference on Next Generation Mobile Applications, Services and Technologies (NGMAST 2007), pages 63– 69. IEEE, 2007.
[2] Ziad Ahmad, Nitin Khanna, Deborah A Kerr, Carol J
Boushey, and Edward J Delp. A mobile phone
user interface for image-based dietary assessment. In IS&T/SPIE Electronic Imaging, pages 903007–903007– 9. International Society for Optics and Photonics, 2014. [3] Eirik ˚Arsand, Dag Helge Frøisland, Stein Olav Skrøvseth, Taridzo Chomutare, Naoe Tatara, Gunnar
Hartvigsen, and James T Tufano. Mobile health
applications to assist patients with diabetes: lessons learned and design implications. Journal of diabetes science and technology, 6(5):1197–1206, 2012.
[4] J. L. Bachman, S. Phelan, R. R. Wing, and H. A. Raynor. Eating frequency is higher in weight loss maintainers and normal weight individuals as compared to overweight individuals. Journal of the American Dietetic Association, 111(11):17301734, 2011.
[5] Lukas Bossard, Matthieu Guillaumin, and Luc Van Gool. Food-101 – mining discriminative components with random forests. In European Conference on Computer Vision, 2014.
[6] M. Donoser and H. Bischof. Efficient maximally stable extremal region (mser) tracking. In 2006 IEEE Computer Society Conference on Computer Vision and Pattern Recognition (CVPR’06), volume 1, pages 553– 560, June 2006.
[7] V. Garcia-Larsen, S. R. Del Giacco, A. Moreira, M. Bonini, D. Charles, T. Reeves, K.-H. Carlsen, T. Haahtela, S. Bonini, J. Fonseca, I. Agache, N. G. Papadopoulos, and L. Delgado. Asthma and dietary intake: an overview of systematic reviews. Allergy, 71(4):433–442, 2016.
[8] Katrin Gaßner, B Vollmer, Mirko Prehn, Martin Fiedler, and Sebastian Ssmoller. Smart food: mobile guidance for food-allergic people. In Seventh IEEE International Conference on E-Commerce Technology (CEC’05), pages 531–534, 2005.
[9] Hamid Hassannejad, Guido Matrella, Paolo Ciampolini, Ilaria De Munari, Monica Mordonini, and Stefano Cagnoni. Food image recognition using very deep convolutional networks. In Proceedings of the 2Nd International Workshop on Multimedia Assisted Dietary Management, MADiMa ’16, pages 41–49, New York, NY, USA, 2016. ACM.
8 EAI Endorsed Transactions
on Ambient Systems
0% 10% 20% 30% 40% 50% 60% 70% 80% 90% 100% Bread
Dairy product Dessert Egg Friedfood Meat NoodlesPasta Rice Seafood Soup VegetableFruit Overall
ResNet GoogLeNet AlexNet
Figure 9. Accuracy with other existing deep CNN models.
[10] Kaiming He, Xiangyu Zhang, Shaoqing Ren, and Jian Sun. Deep residual learning for image recognition. In arXiv prepring arXiv:1506.01497, 2015.
Photo Input Models and Top2 Predictions
ResNet
Vege: 73.02% Rice: 17.61%
GoogLeNet
Vege: 42.55% Dess: 38.34%
AlexNet
Egg: 66.69% Dess: 20.64%
(a) Pineapple Salad
ResNet
Frie: 64.00% Egg: 18.83%
GoogLeNet
Frie: 98.11% Egg : 1.24%
AlexNet
Brea: 34.88% Meat: 32.54%
(b) Grilled Duck Leg
ResNet
Dess: 99.63% Egg : 0.14%
GoogLeNet
Dess: 99.94% Egg : 0.04%
AlexNet
Dess: 99.05% Soup: 0.43%
(c) Mousse Cake
ResNet
Meat: 51.38% Rice : 10.28%
GoogLeNet
Egg: 65.51% Seaf: 27.7%
AlexNet
Seaf: 84.71% Dess: 6.76%
(d) Japanese pork set
ResNet
Frie: 97.83% Brea : 0.55% GoogLeNet
Frie: 94.88% Brea: 3.4%
AlexNet
Egg: 46.21% Brea: 33.88%
(e) Hotdog with french fries
Figure 10. Sample results using our own users’ contributed photos. We indicate some of the classes in short due to space limit. E.g. Brea: Bread, Frie: Fried Food, Seaf: Seafood.
[11] Taichi Joutou and Keiji Yanai. A food image recognition system with multiple kernel learning. In2009 16th IEEE International Conference on Image Processing (ICIP), pages 285–288, Nov 2009.
[12] Cheng-Kai Kao and David M Liebovitz. Consumer
mobile health apps: Current state, barriers, and future directions. PM&R, 9(5):S106–S115, 2017.
[13] Y. Kawano and K. Yanai. Automatic expansion of a food image dataset leveraging existing categories with
domain adaptation. In Proc. of ECCV Workshop
on Transferring and Adapting Source Knowledge in Computer Vision (TASK-CV), 2014.
[14] Yoshiyuki Kawano and Keiji Yanai. Foodcam: A real-time mobile food recognition system employing fisher
9 EAI Endorsed Transactions Ambient Systemson
Figure 11. Responses from our user study.
vector. In International Conference on Multimedia Modeling, pages 369–373. Springer, 2014.
[15] Alex Krizhevsky, Ilya Sutskever, and Geoffrey E Hinton. Imagenet classification with deep convolutional neural networks. In F. Pereira, C. J. C. Burges, L. Bottou, and K. Q. Weinberger, editors, Advances in Neural Information Processing Systems 25, pages 1097–1105. Curran Associates, Inc., 2012.
[16] Tobias Leidinger, L¨ubomira Spassova, Andreas Arens, and Norbert R¨osch. Mofis: a mobile user interface for semi-automatic extraction of food product ingredient lists. In Proceedings of the companion publication of the 2013 international conference on Intelligent user interfaces companion, pages 49–50. ACM, 2013. [17] VI Levenshtein. Binary Codes Capable of Correcting
Deletions, Insertions and Reversals. Soviet Physics Doklady, 10:707, 1966.
[18] Min Lin, Qiang Chen, and Shuicheng Yan. Network in network. CoRR, abs/1312.4400, 2013.
[19] Chang Liu, Yu Cao, Yan Luo, Guanling Chen, Vinod Vokkarane, and Yunsheng Ma. Deepfood: Deep learning-based food image recognition for computer-aided dietary assessment. In Proceedings of the 14th International Conference on Inclusive Smart Cities and Digital Health - Volume 9677, ICOST 2016, pages 37–48, New York,
NY, USA, 2016. Springer-Verlag New York, Inc. [20] Y. Matsuda, H. Hoashi, and K. Yanai. Recognition of
multiple-food images by detecting candidate regions. In 2012 IEEE International Conference on Multimedia and Expo, pages 25–30, July 2012.
[21] M. MU, L.-F. XU, D. HU, J. WU, and M.-J. BAI. Dietary patterns and overweight/obesity: A review article. Iranian Journal of Public Health, 46(7):869876, 2017.
[22] Yunyoung Nam, Yeesock Kim, and Jinseok Lee. Sleep monitoring based on a tri-axial accelerometer and a pressure sensor. Sensors, 16(5):750, 2016.
[23] Marion Nestle. volume 3. Univ of California Press, 2013. [24] G. Poon, K. C. Kwan, W. M. Pang, and K. S. Choi. Towards using tiny multi-sensors unit for child care reminders. In 2016 IEEE Second International Conference on Multimedia Big Data (BigMM), pages 372–376, April 2016.
[25] David Rebedew. Myfitnesspal. Family practice
management, 22(2):31–31, 2014.
[26] Preethi R Sama, Zubin J Eapen, Kevin P Weinfurt, Bimal R Shah, and Kevin A Schulman. An evaluation of mobile health application tools. JMIR mHealth and uHealth, 2(2):e19, 2014.
10 EAI Endorsed Transactions on
Ambient Systems
[27] Bruno M Silva, Ivo M Lopes, Joel JPC Rodrigues, and Pradeep Ray. Sapofitness: A mobile health application for dietary evaluation. In2011 13th IEEE International Conference on e-Health Networking Applications and Services (Healthcom), pages 375–380. IEEE, 2011. [28] Bruno MC Silva, Joel JPC Rodrigues, Isabel de la
Torre D´ıez, Miguel L´opez-Coronado, and Kashif Saleem. Mobile-health: a review of current state in 2015.Journal of biomedical informatics, 56:265–272, 2015.
[29] Ashutosh Singla, Lin Yuan, and Touradj Ebrahimi. Food/non-food image classification and food categoriza-tion using pre-trained googlenet model. InProceedings of the 2Nd International Workshop on Multimedia Assisted Dietary Management, MADiMa ’16, pages 3–11, New York, NY, USA, 2016. ACM.
[30] Ray Smith. An overview of the tesseract ocr engine. In Proc. Ninth Int. Conference on Document Analysis and
Recognition (ICDAR), pages 629–633, 2007.
[31] Christian Szegedy, Wei Liu, Yangqing Jia, Pierre Sermanet, Scott Reed, Dragomir Anguelov, Dumitru Erhan, Vincent Vanhoucke, and Andrew Rabinovich. Going deeper with convolutions. In Computer Vision and Pattern Recognition (CVPR), 2015.
[32] Christian Szegedy, Vincent Vanhoucke, Sergey Ioffe, Jonathon Shlens, and Zbigniew Wojna. Rethinking the inception architecture for computer vision. CoRR, abs/1512.00567, 2015.
[33] The Open Food Facts Team. The open food facts (open food products database).
[34] C. Lee Ventola. Mobile devices and apps for health care professionals: Uses and benefits. Pharmacy and Therapeutics, 39(5):356–364, 2014.
11 EAI Endorsed Transactions
on Ambient Systems