©2015 JNAS Journal-2014-4-3/351-359 ISSN 2322-5149 ©2015 JNAS
Review of developments underground economy
developments in IRAN
Asra Hosseini
1, Zahra Nasrollahi
2*and Syed Yahya Abtahi
11- Department of Economic, Yazd Science and Research Branch, Islamic Azad University, Yazd, Iran 2- Department of Economic, Yazd Branch, Islamic Azad University, Yazd, Iran .and Associate Professor
Yazd University, Yazd, Iran
Corresponding author
:
Zahra NasrollahiABSTRACT: The underground economy is a part of the economy of all countries, particularly developing countries and has serious repercussion on the economy performance and can cause deviations from correct detecting the state of economy and administrating wrong policies. So, detecting the size of this sector is a challenge for the policy-makers. Therefore, the present study was to estimate the size of the underground economy in the years 1973-2010. In order to estimate the size of the underground economy, the structural equation modeling and multiple causes- multiple effects method was applied using Amos Graphic software. Our results suggest that the average size ratio of underground economy to gross domestic product (GDP) during the period under study (1973-2010) was 16.16%.
Keywords: Underground economy, MIMIC model, Amos Graphics Software. INTRODUCTION
Being confronted with some economic activities that generally remained away from official observers, referred as underground sector is one of the main concerns of many countries. The presence of underground sector reflects a desire to conceal economic activities either caused by low-income activities in formal sector or due to the illegality of these activities. This is the source of many social and economic disorders and lead to libertinage in social and economic programs, emergence of fiscal and monetary problems, administration of inappropriate economic policies and social strategies failure.
Available evidences strengthen the likelihood of emerging this phenomenon in IRAN economy. Consequently, understanding the nature, size, trend, causes and effects of this phenomenon can be useful in determining how to deal with it, especially with regard to its illegal nature.
The paper is organized as follow, the implications of the underground economy and conducted studies will be discussed, respectively. In the next section, the causes and indicators of the underground economy is mentioned in addition to the introduction of the model and methodology. Then, we estimate the time-series size of the underground economy during the years 1973-2010 in Iran. The conclusion and suggestions are given in the final section.
General concepts of the underground economy
Planning for economic development requires awareness of the general performance of a country's economy, however in all countries, almost a part of the economic activities are carried out in secret in order to escape from the constraints imposed by the laws and regulations of the country. This type of activities in developing countries has more size and variety rather than in the developed countries. The underground economy is a clear example of this type of economic activities (Arab Mazar Yazdi, 2001).
Shadow economy includes the production and distribution of all goods and services which are hidden from view of the authorities, consciously or in other reasons. The reasons of such hiding are:
352
3. The refusal of some constraints, such as production standards, rules relating to minimum wages, maximum working hours, job security, etc. (Schneider, Buehn and Montenegro, 2010).Underground economy includes those economic activities that are carried out legally or illegally and are not booked anywhere (Esfandiyari and Jamal Manesh, 2002). The studied scope within this paper is based on this definition. The history of measuring underground economy with latent variable approach
The Studies conducted in the Iran
In a study, Yazdi Arab Mazar (2001) used the literature on non-observed variables in the econometric modeling for the first time in IRAN (structural equation modeling) to estimate the size of the black economy during the years 1968-1998. The variables tax burden, trade restrictions, the growth of consumer prices, unemployment and per capita income are considered as the causes of black economy and the variables per capita household expenditure, the difference between the exchange rate, the demand for money and energy consumption are considered as the effects of black economy. The results indicate an increase in the trafficking process, especially during the years 1988-1998.
In a study, Shakibaei and Reis Pour (2007) studied the time series of the shadow economy over the period of years 1971-2001 using a dynamic approach in the multiple causes- multiple indicators model. The variables tax burden, government consumptions, unemployment rate, self-employment share of total labor and illegality indicator has been considered as the causes of the shadow economy and the variables gross domestic product (GDP) and liquidity in circulation outside banks are considered as indicators of the shadow economy.
In this study, the studied period was divided into three decades. The results show that the average size of shadow economy in Iran was 21.10% in the first decade, 10.06% in the second decade and 40.16% of GROSS DOMESTIC PRODUCT in the last decade. Generally, the mean was 36.12% of GROSS DOMESTIC PRODUCT in the entire period under study. Generally, the results confirm the growth in shadow economy.
In another study, Sameti . (2009) studied the time series of underground economy in the period 1965-2005 using multiple causes- multiple indicators method. The variables tax burden, resource revenues, unemployment, government size, per capita income, inflation and trade restrictions are considered as causes and the variables GROSS DOMESTIC PRODUCT, energy consumption and the demand for money are intended as the effects of underground economy. The results showed that the average relative size of the underground economy during this 41-year period has been 54.17% of the formal economy.
In a study, Farzanegan (2009) examined the time series of illegal trade in Iran during the period 1970-2002. The variables penalties for trafficking, differences between exchange rates in formal and informal market, tariff barriers, GROSS DOMESTIC PRODUCT per capita and GROSS DOMESTIC PRODUCT per capita growth rate, unemployment rate, degree of openness in economy, the literacy rate and the quality of institutions measures are considered as causes of illegal trade and the variables real income of the state, the index of import prices and consumption growth rates of petrochemical products are considered as the effects of the illegal trade in the economy. The results show that the average trafficking during the above-mentioned period is almost 13% of the total trade in Iran.
The Studies abroad
In a study, Schneider (2004) studied the underground economy in 110 countries using the dynamic multiple indicators- multiple causes method. According to his calculations, the average size of the underground economy as a portion of official GROSS DOMESTIC PRODUCT over the period 1999-2000 was 41% in developing countries, 38% in countries in transition and17% in developed countries. Schneider has estimated the size of the underground economy in Iran during 1999-2000 as 18.9% of GROSS DOMESTIC PRODUCT, in his study.
In a study, Han-Min Wang (2006) studied the underground economy in Taiwan during 1961-2003 with the Structural Equation Modeling approach. They showed that the underground economy of Taiwan has increased from 11% to 13.1% of GROSS DOMESTIC PRODUCT during 1961-1988 and from 10.6% to 11.8% of GROSS DOMESTIC PRODUCT during the period 1989-2003.
353
MATERIALS AND METHODSLatent variable approach allows the researcher to evaluate multiple causes and multiple effects of the underground economy in a model (Nasrallahi, Farzanegan and Tale'i Ardekani, 2011).This model is discussed later. The model of multiple indicators - multiple causes which is a particular form of structural equation modeling; enables us to use simultaneously multiple causes and multiple indicators for modeling to estimate the latent variable with time-series data. In this method, the underlying causes of the underground economy size and the indicators, that can be used to measure this type of economy, are connected by an econometric model.
This model implies matrix structure of the experimental covariance (based on data) that is compared to the covariance matrix, which is resulted by the selected model after parameters estimation and presents information about the relationships between observed variables and latent variables by minimizing the difference between the sample covariance matrix and the predicted matrix by the model. If the two matrices are stable compared to each other, then the structural equation model can be considered as a presumptive description for relationships between tested variables. MIMIC models (Multip Indicators-Multip Causes) typically consist of two parts of structural equation modeling and measuring model. Structural part of the model reveals the effect of cause variables on latent variables and the measuring part of the model shows the effect of latent variables on the indicators. Therefore, the mathematical formulation of the multiple indicators- multiple causes model that consists of observed variables of the model, named as causal variables (indicators) and the underground economy latent variable, takes place in the equation in two forms: in the first equation, the consequential relationship between underground economy and its causes are described and how the indicators are influence by the size of the underground economy is explained in the second equation.
If we consider η as latent variable of underground economy, y as a vector (P×1) of indicators of the underground economy effects in various fields, x as a vector (q × 1) of the underground economy causes, and λ and γ as vectors of the coefficients, respectively (p × 1) and (q × 1) the mentioned pattern will be as follows, respectively (Farzanegan, 2009):
η = γ1 x1 + γ2 x2 + ⋯ . +γq xq + ξ (1)
Y1=λ1 η + ε1 , y2 = λ2 η+ε2,… . , yp= λp η + εp (2)
Where ξ is structural error and є is measurement error. Equations (1) and (2) can be written as follows:
𝜼=γ´x + ξ (3)
y = λ 𝜼+ ε (4)
In this equation, random errors ε and ξ are respectively, (p×1) and scalar and all are normally distributed and expectation hope in all the variables is zero. Therefore, the equations (3) and (4) it is assumed that E(ξε′)=0, E(εε′)= θ2 and E(ξ) = σ2 . By substituting equation (3) in equation (4), the above pattern is in the form of a regression equation model as follows:
y= λ(γ´ x + ξ)+ ε= ᴨx + v (5)
The summarized coefficients matrix and vector forms and disturbing sentences are as follows, respectively: ᴨ= γλ´, v = λ ξ + ε (6)
The covariance matrix can be obtained as follows:
Σ̂ =COV(v)=E(vv́)=E(λξ + ε)( λ ξ + ε)′] = λ λ´σ2+ θ2 (7)
The system of equations is facing to identification problem in order to estimate the model but by constraining a factor of λ to a predetermined value, its coefficients can be estimated and the model parameters are estimated by minimizing the following function (ibid.).
354
To identify the model by software, the value of one of the elements must be predetermined. However, in this case only the relative value of the coefficient is estimated. Therefore using vector estimation and above- mentioned eq. (3), a time series of ranked numbers (Ordinal Numbers) can be obtained for the size of underground economy. If we use other subsidiary information to estimate the size of underground economy in one or more points of the sample, the cardinal time series of the size of underground economy in the studied period can be estimated with the help of the mentioned time series. In the present study, the maximum likelihood method, multiple causes- multiple effects model and Amos graphics software package has been used to estimate the mentioned model.Causes and indicators of the underground economy
In the model described in the previous section, now we introduce the determinants of the size of the underground economy in Iran and also the indicators of underground economy that reflect the impact of this phenomenon and its trend on different sectors and processes.
The causes of the underground economy The effective tax rate
In the economic literature, the most common indicators of tax evasion are tax rates. In the proposed model it is expected that increased tax rates have a significantly positive effect on the underground economy. With the increase in the effective tax rates, the tax evasion rate and the size of the underground economy is further increased (Khajavi ., 2010). In the presented model, the ratio of tax revenues to GROSS DOMESTIC PRODUCT is used to calculate the effective tax rate.
Degree of urbanization
With increasing rural to urban migration, marginalization is increased and since people are not able to be interested in formal economy, they entered the informal economy. Thus by increasing the degree of urbanization, the underground economy increases. In the presented pattern, logarithm of the variable proportion of the urban population to rural population has been proposed as a measure to indicate the degree of urbanization.
Human Development Index
Human Development Index (HDI) is an indicator of the level of development of countries. The higher the index indicates that the country has grown in terms of education, health and income growth which implicitly causes the people proceed to live in a more modern and professional business space. As a result, the rates of people household production and self- consumption process get more modern and the underground economy related to household sector will decrease (Shakibaei & Shademani, 2012).
Government regulation index
Increase in the intensity of regulations (often measured by the number of laws and regulations) are a major cause of loss of freedom and individual choices in the formal economy. Labor market regulations, trade restrictions and other limitations can be considered as examples of regulatory intensity. Excessive regulation may lead to significant increases in the costs of working in the informal economy. Since most of these costs are passed to employees and workers, it would increase the incentive to work in the underground sector (Bouev, 2002). In this study, the ratio of government consumptive costs to GROSS DOMESTIC PRODUCT is used to calculate the degree of government regulation index.
Unemployment
355
Effects of underground economy Energy Consumption
Increased or decreased production of goods and services in the whole economy (official and underground) affects the rate of means consumption, given the requirements of production means (including energy input) and is reflected in the related information. The reason that this index is used as an indicator of increased or decreased size of the underground economy is the fact that since manufacturing and service firms profit by the raw material and production means to produce goods and services, an increase in the use of energy is considered as production means to increase the production of goods and services in the informal and underground economy. Therefore, increased energy consumption may show an increased production of goods and services in the underground economy (Sameti, and Sameti & Delaei Milan, 2009).
Demand for money
The basis of using this variable is the monetary estimating methods of the underground economy. The cash ratio method supposed that all transactions in the informal economy are in cash. Therefore it is undeniable that due to the low risk in cash transactions, these are done in cash exchanges at high volume. Accordingly, the demand for money is expected to increase by increasing underground economy (Nasrollahi and Tale'ei Ardekani, 2012).
Distribution of income
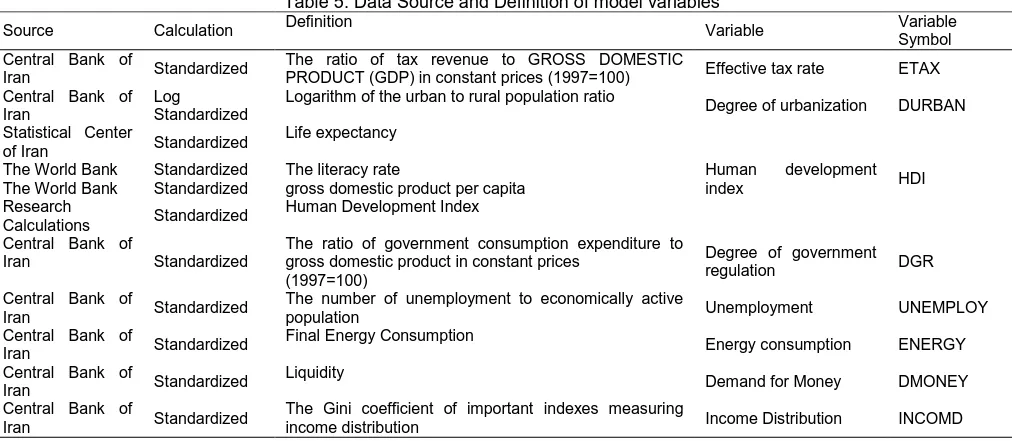
The informal activities influence on income distribution is the most important issues that should be considered. Income distribution is affected by underlying factors of household income, social and economic conditions in a country and government policies in the field of income distribution. It may be argued that the growth of informal activities will have a negative effect by reducing government revenues (failure to pay tax) for redistribution, and by creating a class distinction between the formal and informal factors on income distribution (Bakhtiari & Khoobkhahit, 2011). A list of variables used in the model, their definition and references are provided in the Appendix table (5).
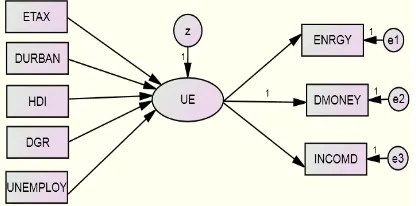
Introduction of the studied pattern
The assumed model of underground economy is shown in the following figure.
Figure 1. Track chart of the underground economy model
The tests of unit root and co-integration variables used in the model
Using econometric methods is based on the stationary assumption of time series variables in the model. In the present study, the test Zandrews and Stata 10 software is used to investigate the stasis of variables in the model.
Table 1. The results of unit root test and structural break
Symbol Structural break point
t-statistic Critical value: 1%
Critical value: 5% Lag No.
Results
Effective tax rate 1375
-3/33 -5/57
-5/08 0
I(1)
Degree of urbanization 1366
-5/34 -5/57
-5/08 1
I(0)
Human development index 1370
-6/39 -5/57
-5/08 0
I(0)
Degree of government regulation 1383
-6/58 -5/57
-5/08 0
I(0)
Unemployment 1367
-2/47 -5/57
-5/08 0
I(1)
Energy consumption 1374
-4 -5/57
-5/08 2
I(1)
Demand for money 1382
-1/72 -5/57
-5/08 2
I(1)
Income distribution 1379
-5/78 -5/57
-5/08 0
I(0)
Source: research calculations by StataSE 10 software
356
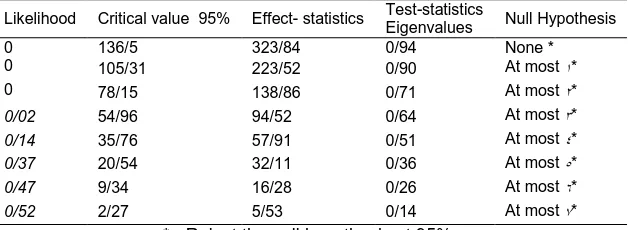
Co-integration test
According to the Johansen co-integration test, the existence of co-integration vector between a set of economic variables used in the model has been verified. The test results are provided in Appendix Table (4).
The results of estimating the model
Table 2. The estimated values of the structural equation
Variable Non-standard estimation
Standard estimation Prob
Effective tax rate ←
Underground Economy 0/59
0/73 ***
Degree of urbanization ←
Underground Economy 0/43
0/54 ***
Human development index ←
Underground Economy -0/20
0/24 ***
Degree of government regulation ← Underground Economy 0/03 0/04 *** Unemployment ← Underground Economy -0/08 -0/10 *** Underground Economy ← Energy Consumption 1/22 1/04 *** Underground Economy ←
Demand for money 1/00 0/83 *** Underground Economy ← Income Distribution -0/48 -0/39 ***
Source: research calculations by Amos Graphic software
According to the results of model estimation, the signs of the variables coefficients the in the studied model is consistent with the expected predictions and the variables are statistically significant. As in Table 2, in the studied model the variables effective tax rate, degree of urbanization, human development index, degree of government regulation, unemployment are statistically significant and the signs of the coefficients are consistent with theoretical predictions.
The estimated value of the parameters in the studied model showed that among the mentioned indicators, the effect of underground economy is positive on the energy consumption and money demand and negative on income distribution (consistent with theoretical predictions).
A researcher always needs criteria to evaluate the model developed based on the theoretical framework and the empirical literature by interpreting them. These criteria, often called as fit indexes, can be divided into two general groups of goodness of fit indexes (the higher the amount of which, the more support and stronger data from the developed model) and badness of fit indexes (the less the amount of which, the more support and stronger data from the developed model) (Ghasemi, 2010).
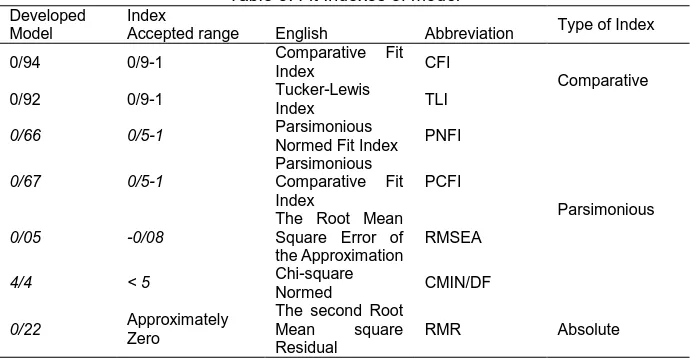
Accepted scientific criteria to verify the theoretical model developed using the collected data forms the primary focus in the model's fit indexes which are sometimes called goodness of fit and sometimes referred to as badness of fit indexes. More than 30 fit indexes are reported in Amos Output. Some of them are presented in Table (3):
Table 3. Fit Indexes of model
Type of Index Index
Developed
Model Accepted range English Abbreviation
Comparative CFI
Comparative Fit Index 0/9-1 0/94 TLI Tucker-Lewis Index 0/9-1 0/92 Parsimonious PNFI Parsimonious Normed Fit Index 0/5-1
0/66
PCFI Parsimonious
Comparative Fit Index
0/5-1 0/67
RMSEA The Root Mean
Square Error of the Approximation -0/08 0/05 CMIN/DF Chi-square Normed < 5 4/4 Absolute RMR
The second Root
Mean square
Residual Approximately
Zero 0/22
Source: research calculations by Amos Graphic software
357
0.92, respectively which indicates that the model is acceptable. Among the Parsimonious indexes, PCFI and PNFI were goodness of fit indexes and RMSEA and CMIN / DF indexes were badness of fit indexes (the less the value, must be interpreted as a sign of the more supporting and stronger data from the developed model) which in studied model PNFI and PCFI were 0.66 and 0.67, respectively and RMSEA and CMIN / DF were 0.05 and 4.4, respectively which indicates that the model is acceptable. The RMR index of absolute fit index were also of badness fit indexes and its lower values indicated a better fit to the data.As you can see, the selected model fits well in terms of fit criteria. The proposed approach is a form of regression model as below:
UE=0.59ETAX+0.43DURBAN-0.20HDI+0.03DGR- 0.08UNEMPLOY (9)
In this model, the variables effective tax rate, degree of urbanization, human development index, degree of government regulation and unemployment are present as cause variables of the underground economy.
Estimating the size of the underground economy
Now in order to obtain the size index of the underground economy of each year, numerical values of the explanatory variables must be placed in equation (9) to obtain the numerical values for the size of the underground economy in that year. In this way, the time series of underground economy size can be found.
As mentioned in the pattern description and methodology in order to convert ordinal time series of underground economy to Cardinal time-series, other subsidiary information should be used. Therefore in this paper, the data from Sameti . (2009) have been used. According to the mentioned study results, the average size of the underground economy during the period 1965-2005 has been 42339.07 billion Rials. This value is very close to the one calculated as the size of the underground economy for the year 1993. Based on the results of this study, the size of the underground economy in 1993 was equivalent to 15.98% of GROSS DOMESTIC PRODUCT. This value was used as the basis for estimating the size of the underground economy in the years 1973-2010 in the present thesis. Obviously, choosing a different basis results in a different time series but the trend of computational series developments will be the same.
Chart 1. Underground economy to GROSS DOMESTIC PRODUCT (GDP) ratio (percent) Source: Research Calculation
Appendix
Table 4. Tests to determine the number of Convergence vectors
Null Hypothesis Test-statistics
Eigenvalues Effect- statistics
Critical value 95% Likelihood None * 0/94 323/84 136/5 0
At most ١* 0/90
223/52 105/31
0
At most ٢* 0/71
138/86 78/15
0
At most ٣* 0/64
94/52 54/96
0/02
At most ٤* 0/51
57/91 35/76
0/14
At most ٥* 0/36
32/11 20/54
0/37
At most ٦* 0/26
16/28 9/34
0/47
At most ٧* 0/14
5/53 2/27
0/52
* - Reject the null hypothesis at 95%; Source: Research Calculation
358
Table 5. Data Source and Definition of model variablesVariable Symbol Variable
Definition Calculation
Source
ETAX Effective tax rate
The ratio of tax revenue to GROSS DOMESTIC PRODUCT (GDP) in constant prices (1997=100) Standardized
Central Bank of Iran
DURBAN Degree of urbanization
Logarithm of the urban to rural population ratio Log
Standardized Central Bank of
Iran
HDI
Human development
index Life expectancy
Standardized Statistical Center
of Iran
The literacy rate Standardized
The World Bank
gross domestic product per capita Standardized
The World Bank
Human Development Index Standardized
Research Calculations
DGR Degree of government regulation
The ratio of government consumption expenditure to gross domestic product in constant prices
(1997=100) Standardized
Central Bank of Iran
UNEMPLOY Unemployment
The number of unemployment to economically active population
Standardized Central Bank of
Iran
ENERGY Energy consumption
Final Energy Consumption Standardized
Central Bank of Iran
DMONEY Demand for Money
Liquidity Standardized
Central Bank of Iran
INCOMD Income Distribution
The Gini coefficient of important indexes measuring income distribution
Standardized Central Bank of
Iran
CONCLUSION
Conclusions and Recommendations
This paper has studied the size of the underground economy in the period 1973-2010 using Amos graphics software. The software results indicate the significance of the effective tax rate as the most important influencing variable in the formation of underground activities. According to the results of tables, the variables degree of urbanization, human development index, unemployment and the degree of government regulation are of next significances to influence the size of the underground economy activities, respectively. According to these findings, we recommend the followings to reduce the size of the underground economy and its share in GROSS DOMESTIC PRODUCT (GDP):
- Improve the tax system
- Development and Institutionalization of tax culture
- Employment policies, attracting foreign investment to reduce unemployment - Increasing the Human Development Index
- Reduce the amount of provisions and regulations for the firm registration
- Motivation to work in the formal sector and reduce the prohibitions and penalties.
REFERENCES
Bakhtiari S and Khubkhahi KH. 2011. ” employment in the informal labor market and its influential factors in Iran (2006-2001)”, Journal of Economic Essays, Vol. VIII, No. XV, spring and summer, 138-117.
Bittencourt M, Gupta R, Stander L. 2014. Tax evasion, financial development and inflation: Theory and empirical Evidence. Journal of Banking & Finance 41,194-208.
Blackburn K, Bose N and Capasso S. 2012. Tax evasion, the underground economy and financial development. Journal of Economic Behavior and Organization 83,243-253.
Bose N, Capasso S and Wurm M. 2012. The Impact of Banking Development on the Size of the Shadow Economy. Journal of Economic Studies 39 (6), 620–628.
Capasso S and Jappelli T. 2013. Financial development and the underground economy, Journal of Development Economics, 167-178.
Calderon C and Liu L. 2003. The Direction of Causality between Financial Development and Economic Growth. Journal of Development Economics, 72: 321-334.
359
Ellul A, Jappelli T, Pagano M and Panunzi F. 2012. Transparency, Tax Pressure and Access to Finance. CEPR Discussion Papers8939.
Esfandiari A and Jmalmanesh A. 2002. “The underground economy and its impact on the national economy”. Journal of Planning and Budget. Year XIX, No. 77, 118-81.
Farzanegan MR. 2009. Illegal Trade in the Iranian economy: evidence fromstructural equation model; European Journal of Political Economy,25(4): 489-507.
Gatti R and Honorati M. 2008. Informality among Formal Firms: Firm-Level, Cross-Country Evidence on Tax Compliance and Access to Credit. World Bank Policy Research Working Paper N. 4476.
Jafari samimi A, Rostamzadeh S and Mehdi Zadeh M. 2009. “The impact of trade liberalization on financial development and economic growth in the country”, Economic Research Journal, Vol. IX, No. IV, winter, 21-1. Heshmati Molaei, H. (2004) “Factors affecting the banking system's financial development”. Economic Bulletin, No. 13, Summer, 88-55.
Khajavi M, Rezaei A and Khodaveisi H. 2010. ” estimated the underground economy and the tax gap in approach multiple causes”, Economic Journal, Vol. XI, No. III, Fall.