Y u t a k a I s h i m a r u 9 K a z u t o s h i A r a i 9 M a s a t o M i z u t a n i K a t s u h i t o O s h i m a 9 I k u h o I i d a
Physical and mechanical properties of wood after moisture conditioning
Received: March 22, 2000 / Accepted: May 22, 2000
A b s t r a e l Some properties of wood (hinoki: Charnaecyparis obtusa) moisture-conditioned by an adsorption process from a dry state and by two desorption processes (from a water-saturated state and from a state with a moisture con- tent slightly below the fiber saturation point) were investi- gated. The moisture contents of wood conditioned by the adsorption process and by the desorption process continued to approach to one another for the moisture-conditioning period of over 50 weeks. Accordingly, sorption hysteresis should be regarded as a transitional phenomenon that oc- curs during the process of approaching the true equilibrium, which requires a long time. The wood conditioned by the desorption process beginning from a water-saturated state showed slightly smaller dimensions than those conditioned by the adsorption process with the same moisture content; however, the wood conditioned by the desorption process from a moisture content below the fiber saturation point showed slightly larger dimensions than those conditioned by the adsorption process. The wood conditioned by the adsorption process from a dry state showed a higher modu- lus of elasticity and modulus of rupture than did the wood conditioned from a water-saturated state with the same moisture content. The mechanical properties of the wood also varied based on the states at which the desorption process was started. This is a notable characteristic of the relation between the drying condition and the mechanical properties of wood.
K e y w o r d s Moisture-conditioned wood - Sorption hyster- esis 9 Dimensional change 9 Modulus of elasticity 9 Modulus of rupture
Y. Ishimaru ([]) . K. Arai. M. Mizutani 9 K. Oshima 9 I. Iida Laboratory of Wood Technology, Faculty of Agriculture, Kyoto Prefectural University, Shimogamo Nakaragi-cho, Kyoto 606-8522, Japan
Tel. +81-75-703-5638; Fax +81-75-703-5639 e-mail: [email protected]
Introduction
Regarding the sorption hysteresis of wood and cellulosic materials, that the amount of moisture held by these mate- rials depends not only on the equilibrium of the relative humidity but on the direction from which the equilibrium is approached has been well known for many years. Summa- rizing the explanation by Urquhart 1 followed by those of Smith 2 and White and Eyring, 3 the sorption hysteresis of water by cellulosic materials can be attributed to irrevers- ible uncoupling and recoupling of hydroxyl groups in the cellulose structure; that is, the uncoupling occurs during adsorption, and the recoupling occurs at relatively delayed stages in the desorption process. These delayed stages are due to the rigid structure of the cellulose chains in which a hydroxyl group hardly recouples when a water molecule is desorbed. Consequently, the available sites for the adsorp- tion of water are larger during the desorption process than during the adsorption process. In other words, water mol- ecules bound directly to sites in the cellulose chain are larger during the desorption process than during the adsorption process.
Stature noted that hysteresis is not due to lack of attain- ing the true sorption equilibrium because greatly extending the sorption time shows no tendency to eliminate hyster- esis. 4 However, we have not found a study in which hyster- esis was traced for more than several weeks. The above-mentioned hysteresis theory implies the existence of a time lag for the response of cellulose chains during the desorption process. Furthermore, it has been observed that hysteresis becomes obscure with elevating temperatures. These findings suggest that hysteresis is not a phenomenon that occurs in an equilibrium state. Therefore, the possibil- ity that sorption hysteresis is a transitional state until true equilibrium is reached remains, even if a long time is neces- sary to attain true equilibrium.
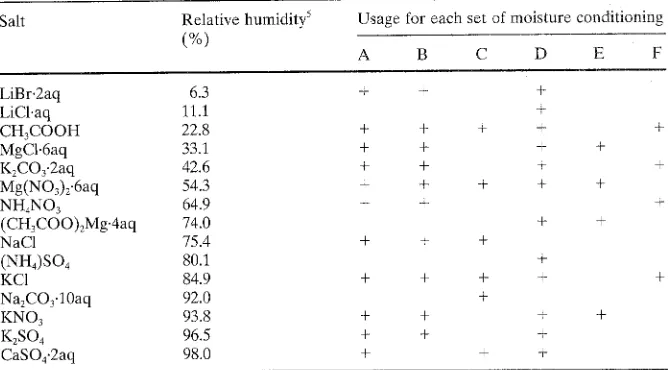
Table 1. Saturated salt solutions used to regulate relative humidities
Salt Relative humidity 5 Usage for each set of moisture conditioning
(%)
A B C D E F
LiBr.2aq 6.3 + + +
LiCl.aq 11.1 +
CH3COOH 22.8 + + t + +
MgC1.6aq 33.1 + + + +
K2COy2a q 42.6 + + ~ +
Mg(NO3)2.6aq 54.3 + + + + +
N H 4 N O 3 64.9 + + ~-
(CH3COO)2Mg.4aq 74.0 + +
NaC1 75.4 + + +
(NH4)SO 4 80.1 +
KC1 84.9 + + + + +
Na2COyl0a q 92.0 +
K N O 3 93.8 + + + +
K2SO4 96.5 + + +
CaSO4.2a q 98.0 + + +
A and B: long-term examinations of the moisture contents and the dimensions in the adsorpton process beginning from a dry state and in the desorption process beginning from a water- saturated state, respectively. C and D: examinations of static bending properties and the moisture contents and the dimensions in the adsorption and desorption processes from the water-saturated state, respectively. E and G: examinations of mechanical properties in bending and the moisture contents and dimensions in the adsorption and desorption processes beginning from a moisture content slightly below the fiber saturation point, respectively
aq, water
ture content. It is interesting how such a difference in the existing state of moisture affects various properties of wood. H e n c e the sorption hysteresis of wood was traced for 50 weeks, a n d differences in d i m e n s i o n a n d certain me- chanical properties of wood m o i s t u r e - c o n d i t i o n e d during the adsorption process and two different desorption pro- cesses were investigated.
Materials and methods
The present study consisted of six sets of moisture- c o n d i t i o n e d wood, as shown in T a b l e 1: A a n d B in T a b l e 1 are long-term m e a s u r e m e n t s of the moisture c o n t e n t a n d the dimensions of the wood samples c o n d i t i o n e d during the adsorption process from a dry state a n d during the desorp- tion process from the water-saturated state, respectively; C and D are evaluations of some mechanical properties in static b e n d i n g a n d the moisture contents a n d dimensions of the samples c o n d i t i o n e d from a dry state a n d from a water- saturated state, respectively; a n d E a n d F are evaluations of the static b e n d i n g properties and the moisture contents and dimensions of the samples c o n d i t i o n e d from a dry state and during the desorption process from a moisture c o n t e n t of a b o u t 25 %, which is slightly below the fiber s a t u r a t i o n point (FSP), respectively.
W o o d samples
W o o d samples were o b t a i n e d from the outer region of heartwood with a straight grain in a log of Japanese cypress (hinoki: Chamaecyparis obtusa). F o r m e a s u r i n g moisture
contents and dimensions, a b o u t 70 cross-sectiona! wood pieces [40 radial (RI • 20 tangential (Tt x 4 longitudinal (L) mm] were successively cut from three wood sticks having cross sections of 40 (R) x 20 (T) ram. Their dimen- sions were m e a s u r e d in the tangential and radial directions with a precision of 0.01 m m using a screw m i c r o m e t e r after
swelling in water (1 week at 30~ Their weights and
dimensions (dry weights a n d dimensions) were m e a s u r e d after v a c u u m drying (more t h a n 50h at r o o m temperature). A f t e r oven-drying for 15 h at 105 ~ C. their dimensions (oven- dried dimensions) were m e a s u r e d again: t h e n the samples that appeared to have dried i n a d e q u a t e l y or a b n o r m a l l y were discarded, judging from the dry a n d oven-dried dimensions.
F o r e x a m i n a t i o n s A a n d B. 105 wood pieces o b t a i n e d from two wood sticks were divided into 21 groups of five pieces each by selecting five pieces, o n e by one. for 21 Limes. Each group was m o i s t u r e - c o n d i t i o n e d using 2 t different methods. F o r e x a m i n a t i o n s E a n d G. the wood pieces o b t a i n e d from a single stick were divided into eight groups of five each in a m a n n e r similar to tha~ described above. Each group was m o i s t u r e - c o n d i t i o n e d using eight different methods.
F o r the static b e n d i n g tests, cross-sectional wood pieces [100 (R) • 15 ~T) • 4 (L} mm] were successively cul from three wood sticks having cross sections of 100 (R) x 15 (T) ram. Each wood stick was m a r k e d along an a n n u a l ring n e a r the central part of the radial direction, a n d the loading poinl for the static b e n d i n g test was at the m a r k e d position. T h e wood pieces were g r o u p e d in a m a n n e r similar to that described above.
Moisture conditioning
For moisture-conditioning during the adsorption process from a dry state, each sample to be measured for moisture content and dimension (examinations A and E) was placed in a separate weighing bottle and dried at 105~ for 15h in an oven to ensure that it was moisture-free. Then each group of five wood pieces was separately placed in different desiccators containing a saturated aqueous solution of the various salts listed in Table 1. The desiccators were placed in a room regulated at 20~ for 50 weeks for examination A and for 9 weeks for examination E. Changes in the weight and the tangential and radial dimensions of the samples with conditioning time were traced. For the static bending test, each group of samples was placed separately into dif- ferent desiccators containing a saturated aqueous solution of the various salts listed in Table 1 (examinations C and E) immediately after drying at 105~ for 15h. The moisture- conditioning periods were 4 weeks for examination C and 9 weeks for examination E.
For moisture-conditioning during the desorption process from a water-saturated state (examinations B and D), the wood samples were soaked in water under vacuum for a period of less than 10min, and water was wiped off the surface of the samples with a paper towel. Then each group of five samples to be measured for the moisture content and dimension (examination B) and for measurement of the static bending properties (examination D) was placed sepa- rately into different desiccators containing a saturated aqueous solution of the various salts listed in Table 1 in a manner similar to that described above. The moisture- conditioning periods were 50 weeks for examination B and 4 weeks for examination D.
For moisture-conditioning during the desorption process from slightly below the FSP (examination F), all the samples were placed in a desiccator containing a saturated aqueous solution of CaSO4.2aq (2H20) until the moisture content of the samples reached about 25%. The samples were then moisture-conditioned for 4 weeks in a manner similar to that described above.
Static bending test
187
Dry and water-saturated samples for examination C and dry samples for examination D were prepared in addition to the moisture-conditioned samples for the static bending test. The prepared test samples were sealed using a polyethylene film prior to the test to avoid changes in moisture content. A testing machine (Tensilon UTM-4L; Toyo Sokki, Japan) was used for the static bending test in the radial direction under the following conditions: span 80ram of central loading, down-speed of a cross-head 4mm/min. The tests were discontinued when the samples had broken down completely. Immediately after the test, the wood samples were unsealed, and their widths and thicknesses were mea- sured. The modulus of elasticity (MOE) and modulus of rupture (MOR) were calculated using the conventional method employing the obtained stress-strain diagrams and the dimensional data.
Results and discussion
Change in the sorption hysteresis with time
Figure i shows the sorption hysteresis for the wood samples moisture-conditioned for 50 weeks by the adsorption pro- cess and for those by the desorption process. These were no apparent differences from previous results. 46-7
Figure 2 shows the ratios of the moisture content of wood samples conditioned for 3, 10, and 50 weeks at 20~ by the adsorption process and those conditioned by the desorption process (adsorption/desorption ratios) as a func- tion of relative humidity (RH). The ratios of all the condi- tioning periods increased with increases in R H except the values of the samples conditioned for 3 weeks at high RH. It can also seen that the ratios increased with increases in the conditioning period over the entire R H range. This means that the width of the hysteresis loop narrowed with increases during the conditioning period.
Determination of moisture content and swelling
For moisture-conditioning during the adsorption processes and the desorption process from below the FSP, the mois- ture contents and swelling of the conditioned samples were determined using the dry weights and tangential and radial dimensions of the samples and those of moisture- conditioned samples. In the case of desorption from the water-saturated state, some extractives were leached from the samples, and they possibly affected the weights and dimensions of the samples. Therefore, the samples were dried at 105~ for more than 24h. Their dry weights and dimensions were then measured again. These dry weights and dimensions were used to determine the moisture con- tent and swelling of the samples. The degree of swelling was evaluated from the cross-sectional swelling relative to that in water to eliminate variations among wood samples.
3O 25
20 g
0
5
0 0
/
O / " " ~
I I I ~ I T f I t r
10 20 30 40 50 60 70 80 90 100
R e l a t i v e h u m i d i t y ( % )
Fig. 1. Adsorption (open symbols) and desorption (solid symbols)
1.0
. , a
~- 0,8
e-
0 6
9 " 0.4
t ~
0.2
.< 0.0
0
i
I
I
L
110 20 30 40 50 60 70 80
R e l a t i v e h u m i d i t y ( % )
\
90 100
Fig. 2. Adsorption/desorption ratios for wood moisture-conditioned for 3 weeks (circles), 10 weeks (triangles), and 50 weeks (squares)
Stamm and Woodruff found that the adsorption/desorp- tion ratios were 0.79-0.86 at 10%-90% R H for white spruce at 20~ 6 These values are significantly higher than the present values for the samples conditioned for 50 weeks, even though their conditioning times were only 24 h or less. The ratios calculated from the data of Kelsey were 0.64- 0.81 at 10%-90% R H for klinki pine at 25~ These values are comparable to the present values for the samples condi- tioned for 10 or 50 weeks, though Kelsey's conditioning times were described as 2 days at most. Considering the differences of the conditioning periods between present study and previous studies, the adsorption/desorption ratios in the studies referred to above are thought to be somewhat higher than those in the present study.
These differences cannot be attributed to the difference in the adsorption and desorption rate caused by the differ- ence in the sample shape or apparatus used for moisture- conditioning because the moisture-conditioning periods differed to such a degree. Another possible explanation for the difference may lie in the fluctuations of the R H or temperature (which could itself also cause fluctuations in the humidity level) in the apparatus used during moisture- conditioning periods in the previous studies. Stamm and Loughborough 8 proved that such fluctuations narrow the hysteresis loop. In light of this, the present study was per- formed by desiccators containing various saturated aqueous solutions of salts for moisture-conditioning. Moreover, the room in which the desiccators were placed was closely temperature-controlled based on the monitored record, which showed variations of temperature of less than 0.2~ over the conditioning period. Accordingly, the present re- sult should be highly reliable. In fact, this experiment was stopped after 50 weeks because a larger temperature varia- tion was found in the monitored record before the next measurement was planned.
The changes in the moisture contents of the samples conditioned during the adsorption and desorption processes at three R H s for 50 weeks are shown in Fig. 3. It was observed that the differences between the moisture con-
5 50 45 40 35 3 0 - 25 2 0 - - 15 - - 10
5 - - 0
1
\
A
-'l--"
\
=
\
\ I I
\ \
- I l l - I l l - I - - i - -
10 100 Moisture conditioning period (day)
i000
Fig. 3. Changes in moisture content during the adsorption a~d desorp- tion processes with an increasing moisture-conditioning period. Circles,
conditioned at 33% relative humidity (RHk triangles. 75,4% RH:
squares, 93.8% RH: open s 3 mbols, adsorption process, solid symbols.
desorption process
I00 = 80 > 60
40
O
20
0
0 5 10 15 20 25 Moisture content (%)
30
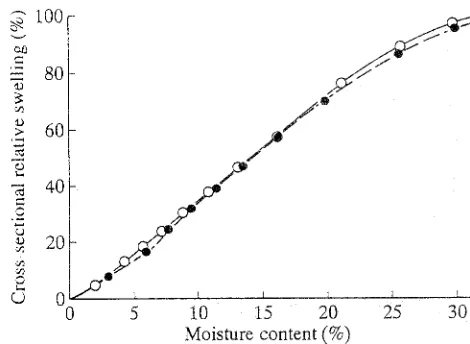
Fig. 4. Difference in cross-sectional relative swelling between wood moisture-conditioned for 50 weeks during the adsorption process
(open symbols) and that during the desorption process from a water- saturated state (solid symbols')
tents during the adsorption process and those during the desorption process decreased with increases in the condi- tioning period at all the RHs examined. Thus, true adsorp- tion and desorption equilibriums were obviously not attained even at 50 weeks. Accordingly, sorption hysteresis should be regarded as a transitional p h e n o m e n o n during the process of achieving true equilibrium, for which a long time is required.
Difference in dimensions of wood after different moisture-conditioning methods
100
..~ 80
6O
40
9 . ~
20
/_/.d
. f
. f
J
;r
I
00 ; 110 15 210 215 30 Moisture content (%)
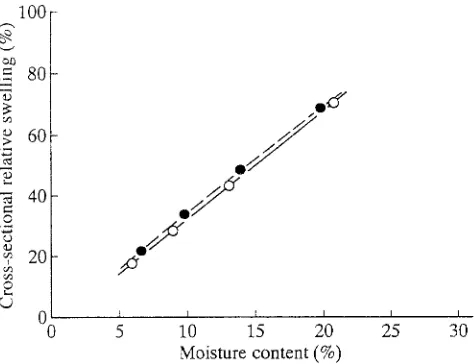
Fig. 5. Difference in cross-sectional relative swelling between wood moisture-conditioned for 9 weeks during the adsorption process (open symbols) and that during the desorption process from a moisture con- tent slightly below the fiber saturation point (FSP) (solid symbols)
cess from the water-saturated state for 50 weeks as a func- tion of their moisture content. Comparing the swelling pro- duced by the adsorption process with that produced by the desorption process, the former showed slightly more swell- ing than the latter in a range above 25% moisture content and in a range below 10% moisture content, though the difference in swelling for both processes was not apparent in the intermediate region. Similar results were found for all conditioning periods examined. The difference in the degree of swelling in the higher moisture content range was accounted for by the shrinkage of the samples due to the decrease in moisture content near the surface of the samples below the FSP despite the inner potion of the samples remaining above the FSP.
The cross-sectional relative swelling of samples condi- tioned for 9 weeks during the adsorption process beginning at a dry state and those during the desorption process from about 25% moisture content (which was less than the FSP) are compared in Fig. 5. The moisture contents of the samples after the adsorption process were slightly larger than those after the desorption process over the entire moisture content region. Similar results were obtained for the shorter conditioning periods, though the difference between the moisture contents for both processes de- creased with increased conditioning duration. These results are inconsistent with the results shown in Fig. 4. This dis- crepancy could be attributed to the difference in desorption processes in that the samples were conditioned from the water-saturated state in the case shown in Fig. 4, whereas the samples were conditioned from a moisture content be- low the FSP in the case shown in Fig. 5. In other words, the former samples included liquid water, whereas the latter samples did not.
Now, let us consider the difference between drying from a water-saturated state and drying from a moisture content below the FSP. The samples used in the present study had a length of 4 mm, which is somewhat longer than the 3.5 m m
189 average length of tracheid cells of Japanese cypress. 9 Hence, in the case of drying from a water-saturated state, the liquid water included in some of the tracheid cells, of which both ends were closed, had to evaporate through the pit m e m b r a n e pores. In this situation, the so-called liquid tension acted on the cell wall of the tracheid corresponding to the curvature of the largest meniscus in the pit m e m b r a n e pores; thus, the tracheid tends to contract toward its interior. 1~
On the other hand, for samples dried from a moisture content below the FSP, only moisture included in the cell walls evaporate. Even in this situation, so-called drying stress caused by a moisture gradient between an area near the surface and the interior of the samples develops. As a result, these wood samples shrink less than those that un- dergo stress-free drying. During the adsorption process, the wood samples are subjected to compressive stress, in con- trast to the drying process; however, the set caused by com- pressive stress during the wetting process should be much smaller than that caused by tensile stress during the drying process. Because wood samples used in the present study were thin cross sections with a thickness of 4 m m in the longitudinal direction, the stress and set that occurred dur- ing both process we deduced to be much smaller than those of a wood sample with larger dimensions. However, the possibility that similar stress and set occurred in microportions, such as portions between the surface and inner parts of cell walls, cannot be ignored.
Based on the above description, the result shown in Fig. 5 that the samples showed more swelling during the desorp- tion process than during the adsorption process is accounted for by the drying stress. On the other hand, the result shown in Fig. 4, in which the swelling was slightly more in the samples during the adsorption process than during the desorption process from a water-saturated state, is attributed to the fact that the liquid tension has a greater effect than the drying set.
Difference in mechanical properties of wood after different moisture-conditioning methods
9
>
-d 120 100{
80 60 40 20 0
- 00~
O -
I I I I I
120 100 80 O
60
>
-d 40 20
I I I l I
0 20 40 60 80 100
Cross-sectional relative swelling (%) Fig. 6. Difference in modulus of elasticity (MOE) and modulus of rupture (MOR) for wood moisture-conditioned for 4 weeks by the adsorption process (open symbols) and by the desorption process from a water-saturated state (solid symbols) as a function of the cross- sectional relative swelling
9 1400 1200 1000 800 600 400 200 0
-,%
18 16 14 ~ 1 2
8 O
N 6
4 2
, ~ " ~ \ \
I i • I - - J
20 40 60 80 100
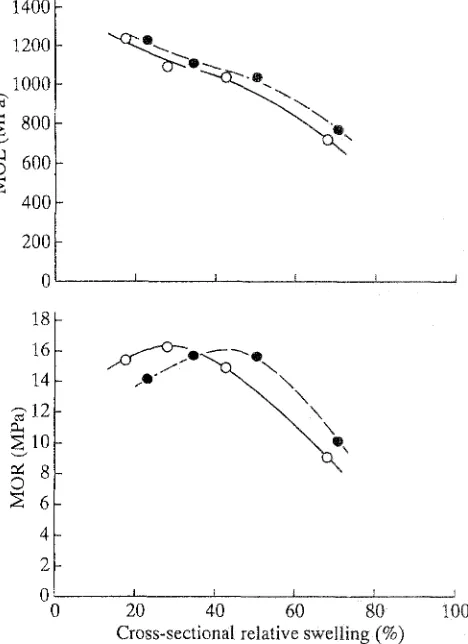
Cross-sectional relative swelling (%) Fig. 7. Difference in MOE and MOR for wood moisture-conditioned for 4 weeks by the adsorption process (open symbols) and by ~he desorption process from a moisture content below the FSP (solid sym- bols) as a function of cross-sectional relative swelling
In Fig. 7 the M O E and M O R of samples conditioned for 4 weeks by the desorption process beginning at 25% mois- ture content (below the FSP) are c o m p a r e d with those of samples conditioned by the adsorption process. T h e wood samples after the desorption process showed slightly larger M O E s than those after the adsorption process. The M O R reached a m a x i m u m with both processes, but the maximum percent of cross-sectional swelling differed for the two processes.
Summarizing the results shown in Figs. 6 and 7, the M O E s and M O R s of the samples conditioned by the des- orption process f r o m the water-saturated state were lower than those conditioned by the adsorption process over the whole swelling range, and the samples from the desorption process with a moisture content below the FSP showed slightly higher M O E s and M O R s than those from the ad- sorption process, though this was not the case for M O R s in the lower swelling regions. This indicates that the mechani- cal properties of the w o o d conditioned by the desorption process f r o m a water-saturated state are lower than those conditioned from a moisture content below the FSP, except the M O R in a lower swelling region.
This discrepancy regarding the mechanical properties of the two desorption processes could be due to the difference in the desorptiou processes; that is, the f o r m e r was the
desorption process used on samples that contained liquid water, and the latter was the desorption process used on samples that did not contain liquid water. As described above, the liquid tension acted locally on the cell walls of the tracheid, which were filled with liquid water: thus. the tracheid tends to contract toward its inside. Such local stress and deformation affected other parts of the samples, pro- ducing i n h o m o g e n e o u s stress and strain and decreasing the w o o d samples' resistance to an externa! force. This is thought to account for the finding that the w o o d moisture- conditioned by the desorption process from a water- saturated state showed lower M O E s and M O R s than those with a moisture content below the FSP.
1600 1400 1200
f ~
1000 800 9
6o0 400 200
18 16 14 ~ ' 1 2 N 1 0 r 8 O :~ 6
4 2 0 0
I I F I I
I r 1 L I
5 10 15 20 25
Moisture content (%)
Conclusions
A s o r p t i o n hysteresis l o o p of w o o d by m o i s t u r e n a r r o w e d c o n t i n u o u s l y o v e r a m o i s t u r e - c o n d i t i o n i n g p e r i o d of 50 weeks. B a s e d on this result, the s o r p t i o n hysteresis should b e r e g a r d e d as a t r a n s i t i o n a l p h e n o m e n o n that occurs dur- ing the process of achieving true equilibrium, which re- quires a long interval. T h e w o o d m o i s t u r e - c o n d i t i o n e d by the d e s o r p t i o n process from a w a t e r - s a t u r a t e d state s h o w e d slightly smaller d i m e n s i o n s than that c o n d i t i o n e d by the a d s o r p t i o n process; however, w o o d c o n d i t i o n e d by the des- o r p t i o n process f r o m a m o i s t u r e c o n t e n t b e l o w the F S P s h o w e d a slightly larger d i m e n s i o n t h a n that c o n d i t i o n e d by the a d s o r p t i o n process. T h e s e results are a t t r i b u t a b l e to the liquid tension and drying stress during the d e s o r p t i o n p r o - cesses. W o o d m o i s t u r e - c o n d i t i o n e d by the a d s o r p t i o n p r o - cess f r o m a dry state had h i g h e r M O E s and M O R s t h a n w o o d c o n d i t i o n e d b y the d e s o r p t i o n process from a w a t e r - s a t u r a t e d state with the s a m e m o i s t u r e content: T h e m e c h a n i c a l p r o p e r t i e s of the w o o d also v a r i e d with the difference in d e s o r p t i o n processes (i.e., the d e s o r p t i o n p r o - cesses beginning f r o m a w a t e r - s a t u r a t e d state o r f r o m a m o i s t u r e c o n t e n t b e l o w the FSP). This is n o t a b l e in terms of the r e l a t i o n b e t w e e n the drying c o n d i t i o n and the m e c h a n i - cal p r o p e r t i e s of wood. This r e l a t i o n should b e i n v e s t i g a t e d in m o r e d e t a i l in the n e a r future.
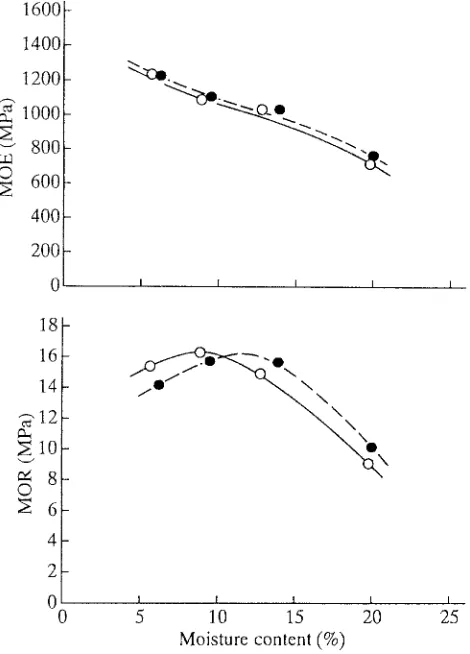
Fig. 8. Difference in MOE and MOR for wood moisture-conditioned for 4 weeks by the adsorption process (open symbols) and by the desorption process from a moisture content below the FSP (solid sym- bols) as a function of the moisture content
T h e difference in the M O E s in Fig. 8 was slight, although a difference in the m o i s t u r e c o n t e n t at which the M O R r e a c h e d a m a x i m u m was similar to that shown in Fig. 7. This suggests t h a t the effect of reinforcing a w e a k p o i n t due to inclusions of a p r o p e r a m o u n t of m o i s t u r e in the cell walls ha2 is reflected m o r e distinctly in the M O R t h a n in the M O E , and that the existing state of m o i s t u r e in the cell walls during the a d s o r p t i o n and d e s o r p t i o n processes dif- fers. M o r e o v e r , it is n o t a b l e t h a t the d e c r e a s e in the M O R during the d e s o r p t i o n process was seen at a m o i s t u r e con- t e n t b e l o w 10%. This suggests that g e n e r a t i o n of a w e a k p o i n t in the cell wall or, m o r e concretely, an i n c o m p l e t e r e a r r a n g e m e n t of m o l e c u l a r chains of cell wall constituents c a u s e d by d e s o r p t i o n of m o i s t u r e f r o m the cell walls occurs e x t e n s i v e l y at a m o i s t u r e c o n t e n t b e l o w 10%.
I n any event, the p r e s e n t results r e g a r d i n g these me- chanical p r o p e r t i e s suggest that w o o d c o n d i t i o n e d f r o m a dry state has h i g h e r elasticity a n d s t r e n g t h t h a n w o o d condi- t i o n e d f r o m a w a t e r - s a t u r a t e d state with c o m m o n m o i s t u r e contents, and that the m e c h a n i c a l p r o p e r t i e s of the w o o d v a r y in terms of the difference in d e s o r p t i o n processes, that is, in r e g a r d to e i t h e r a w a t e r - s a t u r a t e d state or a m o i s t u r e c o n t e n t b e l o w FSP.
References
1. Urquhart AR (1929) The mechanism of the adsorption of water by cotton. J Textile Inst 20:T125-134
2. Smith SE (1947) The sorption of water vapor by high polymers. J Am Chem Soc 69:646q551
3. White HJ, Eyring H (1947) The adsorption of water by swelling high polymeric materials. Textile Res J 10:523-553
4. Stamm AJ (1964) Wood and cellulose science. Ronald Press, New York, pp 145-149
5. Miyabe H (ed) (1968) In: Japan Society of Polymer Science: hand book of material and moisture [Zairyo to Mizu Handbook] (in Japanese). Kyoritu Shuppan, Tokyo, pp 240-262
6. Stamm A J, Woodruff SA (1941) A convenient six-tube vapor sorp- tion apparatus. J Ind Eng Chem 13:836-838
7. Kelsey KE (1957) The sorption of water vapor by wood. Aust J Appl Sci 8:42-54
8. Stamm AJ, Loughborough WK (1934) Thermodynamics of the swelling of wood. J Phys Chem 39:121-132
9. Shimaji K, Sudoh S, Harada H (1976) Wood histology (in Japanese). Morikita Shuppan, Tokyo, p 114
10. Stamm AJ (1964) Wood and cellulose science. Ronald Press, New York, pp 441-447
11. Kadita S, Yamada T, Suzuki M (1961) Study on rheological prop- erties of wood. I. Effect of moisture content on the dynamic Young's modulus of wood (in Japanese). Mokuzai Gakkaishi 7:29- 33