O R I G I N A L P A P E R
Open Access
On the variation of the crash risk with the
total number of bicyclists
Leonhard Lücken
Abstract
Introduction: A prominent policy, which has been proposed in many European municipalities over the last years is the promotion of cycling to decrease pollution and to increase public health. One important part of the assessment of this policy is the estimation of the induced change in bicycle crash numbers. Several recent works supported the ideas by reporting that cycling becomes safer if the number of cyclists increases, i.e., there seems to be a safety-in-numbers effect (SiN).
Methods: The problems related to the interpretation of bicycle crash and volume data are discussed and an
approach aiming at a better understanding of the SiN-phenomenon is presented. In particular it is proposed to adopt models with memory to pursue causal relations and to study SiN at different time scales. To estimate daily cyclist volumes from irregular counts, a weather based model for bicycle volumes is developed.
Results: We provide a proof of concept for the proposed memory model by testing it on synthesized data and apply the proposed techniques on data provided by Berlin authorities. The application on synthetic data shows that improved fits with memory models can indicate temporal correlations within data and, thus, can give hints for causal relations. Although such a temporal correlation could not be substantiated in the real data, a surprising ambiguity was found to exist on different time scales. Over the long term, individual risks decline with increased bicycle volumes, while on shorter terms the opposite seems to be present: The more bicyclists are on the roads, the more unsafe cycling becomes.
Conclusions: The paper concludes by considering possible interpretations for the observed ambiguity. Further, a discussion of the developed methodology and some thoughts for a role that the SiN effect can play for transportation planning are included.
Keywords: Safety in numbers, Memory model, Causal relation, Bicycle crashes, Bicycle volume model, Crash risk
1 Introduction
Each road crash is unique in its characteristics, which include the individual series of unfortunate circumstances finally leading to a collision. Nevertheless it is important to seek patterns within the diverse set of reported road crashes to identify common factors, which help to devise measures to reduce the number and severity of crashes. In this paper we study one of the most universal functional dependencies conceivable for bicycle crash frequencies, that is, their relation to the mere volume of bicycle traf-fic. Several previous works have addressed this topic, (see [6,7,10,13, 14, 17] and references therein). One of the
Correspondence:[email protected]
German Aerospace Center (DLR), Institute of Transportation Systems, Rutherfordstrasse 2, 12489 Berlin, Germany
main questions in this line of research has been whether the dependence of crash frequency on traffic volumes is linear or non-linear. Consider, for instance, a scenario with a constant amount of motorised traffic, where the aver-age individual risk for a bicyclist is not correlated to the amount of other bicyclists in the scenario. In this scenario a linear dependence of crashes on the bicycle volumes would be expected.
Interestingly, it was found frequently that an increased traffic volume is accompanied by a decreased individual risk or at least a decreased risk per kilometre travelled for the traffic participants [see the aforementioned works and also Smeed [19] as one of the first studies to recog-nize this]. This points towards a collective retroaction of the participants on the traffic system as a whole. Indeed, if the presence of an individual bicyclist has significant
non-local effects, which also affect situations not involv-ing him or her directly, this would lead to a non-linear relation of crashes and bicyclist volumes. Jacobsen [13] suggested that in case of one crash participant being a vulnerable road user (VRU) the decreased risk can be a consequence of the increased visibility of a VRU travelling in a group as well as an increased attentiveness or expe-rience of car drivers regarding the VRUs, which can be induced by more frequent encounters. More detailed dis-tinctions of possible mechanisms have been proposed also taking into account the adaptation of novice bicyclists, who may decrease their individual risk by gaining more experience, see for instance [11,18].
The hypothesis that an increased amount of interaction decreases the bicyclist’s risk due to an increased aware-ness specifically on the side of the drivers was supported by recent results of Fyhri et al. [10,12], who reported that a decreasing risk for a collision with a car can be observed for Oslo’s bicyclists during the warm season when more bicyclists are on the road while the risk for single bicycle accidents remains approximately constant throughout the whole year.
Other studies reported a negative correlation of risk and bicycle volumes on a larger time scale where the observed effect spans over various years. However, disre-garding other factors than the momentary traffic volume an equally justified explanatory model could describe ele-vated traffic volumes as a consequence of a decreased individual risk as was pointed out by Bhatia and Wier [5]. For instance, an increased individual safety accompa-nied by a larger volume of bicyclists could be the expected outcome of the construction of a new cycle path along an urban road with high volumes of motorized traffic. Thus, it is important to discriminate between situations where the individual risk is reduced due to factors occur-ring prior to the observed change in bicyclist volumes, e.g., infrastructure improvements, and situations, where the change in bicyclist volume precedes the change in risk. It should be noted though, that the latter observa-tion does not automatically support the above hypothesis on the driver’s increased awareness as in some cases the increased safety might also be mediated by infrastruc-tural improvements, which were implemented in response to increased bicyclist volumes. The situation where an increased safety is identified as the effect and an increased number of VRUs as the cause has been termed the Safety-in-Numbers (SiN) effect. To the opposite causative rela-tion we will refer as the Numbers-by-Safety (NbS) effect.
This question of causality is not treated satisfactory up to date [9] although it is of major importance for traf-fic planning since all derived practical implications for road safety (see Section 4) are subject to the condition that the observed effect is an SiN effect and not an NbS effect. Addressing an NbS effect in planning seems more
straightforward since increasing safety by infrastructural improvements is one important objective anyway.
Since both explanatory directions, corresponding to SiN and NbS, are reasonable from an a priori viewpoint it makes sense to assume that both effects can be present in a given data set. It is therefore desirable to develop a method, which allows us to differentiate between them or at least enables us to determine, which effect is stronger.
In the present work we propose a method for the iden-tification of this causative direction. This is achieved by including memory terms into the statistical models, which, under appropriate circumstances, may indicate a temporal succession of correlated events. This is one com-mon characteristic of cause and effect: that the cause does not lie in future of the effect. Apart from determining the dominant causative direction of the correlated phenom-ena, the size of the memory yielding an optimal fit can indicate the time scale of the effect. We illustrate the appli-cability of the method and its limits using synthetic data. A rigorous mathematical justification remains a work to be accomplished, though.
In Section 2 we develop a model, which theoretically allows to indicate non-linearities and temporally shifted correlations, and test it using synthesized data and real data on crashes and bicycle volumes in the city of Berlin in Section3. In our analysis we disregard any other factors concerning the specific circumstances of the individual crashes than an average bicycle flow quantity.
2 Methods
In this section we introduce a prediction model for the number of collisionsA(t)between bicyclists and motor-ized vehicles within a time frame t. The only predictor variable taken into account by the model is the variation of the total volumeXof bicyclists in the region under con-sideration. This can result in an appropriate model as long as the volume of motorized vehicles stays approximately constant within the considered time span.
For the analysis we consider a dependence of the current collisionsA(t)not only on the current bicyclist volumes X(t)but also on the average volumeXτ = 1τiτ=−01X(t−i) in the previousτ time frames. The corresponding model is introduced in Section2.1.
Furthermore, to apply the proposed models to empir-ical data on crashes and bicyclist volumes, we develop a model for the daily, weather-dependent variation of bicyclist volumes based on monthly counts at a few loca-tions in Section 2.2. In Section 2.3, we conceive a test for the proposed method for the recovery of temporal correlations.
2.1 Models with memory
the number of collisionsAon the traffic volumeXis not appropriate. Often a non-linear relation of the form
A∼αXγ (1)
is considered instead. The reported values of the exponent γ lie betweenγ =0.3 andγ =0.65 [7]. The case of linear dependence, i.e., γ = 1 in (1), corresponds to a phys-ical particle-model where entities of typesX and Y are assumed to collide randomly with a probabilityP∼X·Y. The SiN hypothesis sees the reason for an increased safety, i.e., a decreased risk R = A/X, in an increased traffic volumeX. The main reason to postulate a causal relation of this form (and not an NbS effect, see Introduc-tion) is that one may expect an elevated attentiveness or experience of motorists with regard to the VRUs under consideration. We introduce a measureE(t) for the cur-rent magnitude of attention, resp. experience, at time t. The value ofE(t)is allowed to depend on previousτ vol-umes, i.e.,X(t),X(t−1), ...,X(t−τ+1), which is indicated by adding a subscript as inEτ(t), where appropriate. Fur-ther, we stipulate that in absence of any experience, i.e., E=0, the “particle model” is correct.
This leads us to assume a model of the form
A∼αX/(1+Eτ). (2)
Below we assume that the experienceEis proportional to a powerηof the average volumeXτ within the lastτ time frames. That is, we consider
Eτ,η=Xτ(t)η=
1 τ
τ−1
k=0
X(t−k) η
. (3)
Note that, at least for large values of X, the resulting model captures (1) as a special case ifτ =1 andη=1−γ, because
αX
1+E1,1−γ =
αX
1+X1−γ ≈
αX
X1−γ =αX
γ. (4)
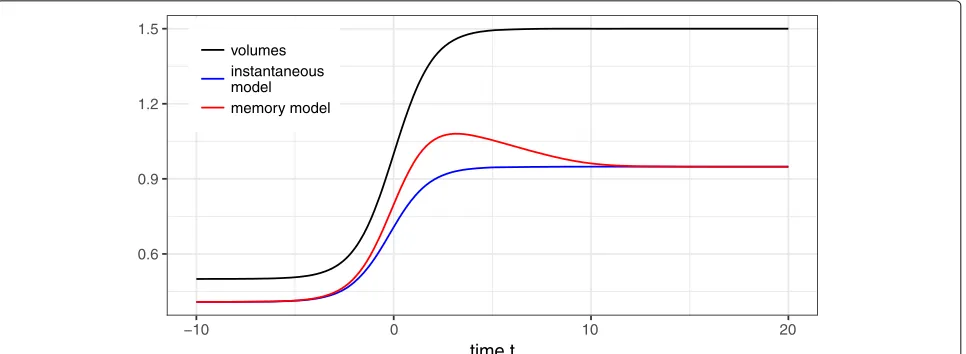
Figure1 illustrates the most important feature of the memory model, which is an inert reaction to changes in the bicycle volumes. It shows a hypothetical time line of bicycle volumes [black curve], which exhibits an increase aroundt = 0. The blue curve shows the behaviour of a model without memory (τ =1), which follows the bicycle volumes instantaneously, while the red curve illustrates the inertia of the system’s adaptation to the increased vol-umes in the presence of a memoryτ = 10. In both cases
γ =0.5.
It seems appropriate to differentiate between differ-ent time scales for the SiN effect. Firstly, an immediate appearance of the effect would correspond to an immedi-ately increased attention raised by the elevated presence of VRUs. For instance, an increased visibility of a group of pedestrians would have an immediate impact on their
individual safety. Note that for a purely immediate mech-anism a model with memory can not be expected to provide a significantly better fit.
On the other hand, if the SiN mechanism involved a longer time interval of conditioning or learning for the motorists, this would be indicated by improved model fits for the appropriate memory timespan. This equips us with a mean to deduce the time scale of the effect if it was present: It corresponds to the memory sizeτthat leads to the best model fit.
It seems adequate to distinguish at least between two non-immediate time scales for a possible SiN effect. The first is connected to a process of adjustment to an increased average number of VRUs due to seasonally changing conditions (on the first sunny days of spring a motorist might initially not expect many bicyclists since a longer period of low bicycle traffic volumes preceded that day). The related general behavioural adjustment, which might be hypothesized, is a change towards a more care-ful driving mode. This process would probably not take effect simultaneously and immediately on all drivers and therefore an inert, delayed adaptation of the traffic system as a whole would be visible in the risk if the mecha-nism had a significant influence on the collision frequency and no concurring factors were present neutralizing this influence.
As a process on an even slower time scale, a first famil-iarization with increasing numbers of VRUs due to shifts in societal mode choices would be conceivable and would express itself in the quality of models involving a larger memory.
Concerning the NbS effect, the modelling would rather aim at predicting the bicyclist volumes by past values of the individual risk, i.e.,
X(t)∼f τ−1
k=0
R(t−k)
. (5)
For the identification of the model parameters we assume a negative binomial distribution of crashes, which allows controlling for overdispersion often observed in crash frequencies [15,16].
2.2 A bicycle volume model
In order to study the dependence of collision frequen-cies on the overall bicycle traffic volumes on a level of high temporal resolution, a comprehensive record of daily bicycle volumes (usually available in the form of bicycle counts) is required.
0.6 0.9 1.2 1.5
−10 0 10 20
time t volumes
instantaneous model memory model
Fig. 1Schematic illustration of the memory model (2). Including a memoryτ >1 has the effect of an inert response [cf. red curve] to an increase in bicyclist volumes aroundt=0 [black curve]. The model’s output forτ=1 is shown as a reference [blue curve]
term factor for the variation of bicycle volumes, is much more abundant, though. Here we present an approach to reconstruct daily bicycle volumes for a region of inter-est from sparse count data with the aid of daily weather information.
To this end we decompose the total daily bicycle volume X(t)as
X(t)=P(t)(1+W(t)), (6)
whereP(t)is a slowly varying average volume andW(t)is the current deviation from the average, which is assumed to be determined predominantly by the weather.
The local values of P(t) at the count locations are extracted from the available time series for the reported counts,xj, j=1, 2, ..., by a local regression (LOESS)P∼X,
see Fig.3a. From this we obtain samples
wj=
xj
P(tj) −
1
for the weather induced deviation W(t), which should have a comparable magnitude across the different count locations. As predictors ofW(t)we considered the daily mean temperature T(t) (in deg C), the daily hours of sunshineS(t), and the daily height of precipitation N(t) (in mm). In this study the functional dependence was assumed to be of the form
W=α+βf(cNN)·f(cT(T−θ))·(1+aSf(cSS))/(1+aS),
(7)
wheref(x)=(1+exp(x))−1.
2.3 Recovering delayed correlations in synthetic data
In this section we describe a test for the capability of the proposed memory models to reveal temporal relations
in time series. For the purpose of evaluation we gener-ated samples z(t) synthetically, which were drawn from negative binomial distributionsr,m(t)with mean values
m(t)= αX(t) 1+Eτ,η(t)
, (8)
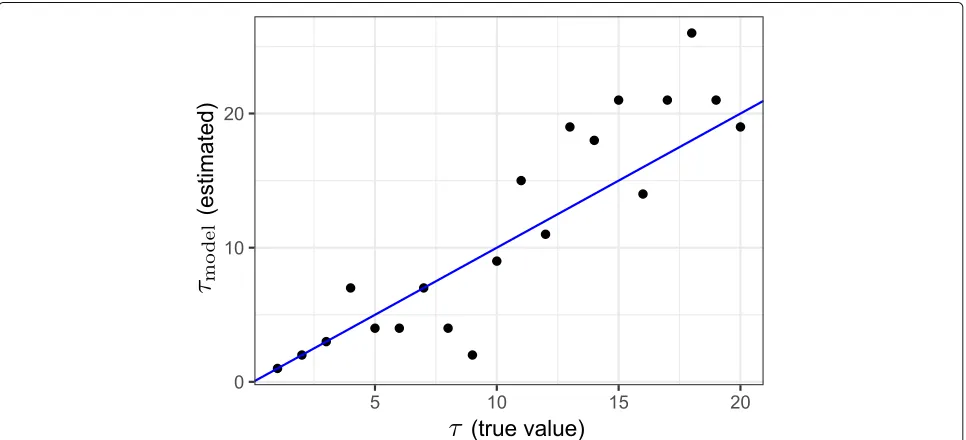
and shape r = 10 (parameter of the Gamma distribu-tion in the Gamma-Poisson mixture). For the evaluadistribu-tion we chose X(t)as the normalized (i.e.,X = 100) daily predicted bicycle volume in Berlin with t ranging over the years 2013 and 2014, and Eτ,η(t) denotes the corre-sponding measure of experience, see (3). The parameters α = 0.55 andη = 0.2 have been fixed as we were inter-ested in the abilities of the model to recoverτ. To this end, several sets of synthetic crash data were created, withτ ranging within 1,...,20 days of memory. Qualitatively, all synthetic data sets coincided well with the observed crash numbers, see Fig.2a-c.
As a next step, a model of the form (2) was fitted to the synthesized data with different values ofτ = τmodel in order to determine the capability of the modelling to recover the parameters from the data, in particular the chosen values for τ. The model fit was accomplished using a maximum likelihood estimation (MLE). Hence, we sought for the maximum of
(τmodel,η,r,α)→L(τmodel,η,r,α)=log
t
r,m(t)z(t)
.
(9)
Here, the predictorsm(t) for the mean were given in a non-standard form as in (8) with τ = τmodel and
a
b
c
Fig. 2Synthesized crash data [in (a) without memory and in (b) with memory] and real crash data [in (c)]. A smoothing local regression fit is shown to guide the eyes
The models usefulness for revealing temporal correla-tion may be assessed by its capability to recover the real value ofτ, which was estimated as the one leading to an optimal MLE. The results are reported in Section3.2.
3 Results
In this section we first present predictions obtained for the bicycle volume model (7) in Subsection3.1. The pre-dictions showed an overall match with the original data on the days where bicycle counts are available.
In Subsection3.2, we report results from the application of the memory model (2) on synthesized data, which sup-port its possible applicability for the recovery of temporal relations.
Finally, for the real crash data from Berlin we found that different effects can be observed at different temporal resolutions in Subsection3.3. On the annual aggregation level we observed a decrease in individual risk accompa-nied by an increase in bicycle volumes in Berlin during the years 2001-2014. For daily or monthly crash counts no indication of a possible SiN effect could be detected at all. Surprisingly, rather the opposite effect of increasing risk with increasing bicycle volumes seemed to prevail.
3.1 Predicted bicycle volumes
In this section we report on the results of an estimation of daily bicycle volumes in Berlin based on sparse count data and daily weather data.
3.1.1 Data sources
For Berlin, monthly bicycle counts were available from eight locations during the years 2007-2014 and less reg-ular counts for the same locations between the years 2001 and 2006, see [2]. Apart from these bicycle counts, a general official estimate for the development of the annual average bicycle volume in Berlin [2] and data on mean temperature, hours of sunshine, and precipitation,
obtained from the DWD-weather station in Berlin-Tempelhof [3] were used to predict the relative changes of the total bicycle volume in the whole city, see also Section2.2.
3.1.2 Reconstruction of daily bicycle volumes
The parameters for the weather-based bicycle volume model (7) were determined by a least squares fit on the combined data from all count locations utilizing weather data from the Climate Data Center of the DWD [3]. We obtained: α = −0.843, β = 2.766, cN = 0.063,
aS = 2.576, cS = −0.31, cT = −0.228, andθ = 3.19.
The maximalp-value was 3.42(10)−4foraS. The resulting
predictions (7) for the daily bicycle volumes were used to predict daily collision numbers in Section3.2.
Figure 3 shows exemplary results for the location of Kreuzberg, where actual count data is available for com-parison. The values for the normalized average bicycle volumeP(t)associated to the whole area of Berlin have been obtained by an interpolation of official estimates for the normalized annual volumes [2], see Fig.5a.
3.2 Evaluation of the memory concept
In the following, we describe the results the recovery of delayed correlation in synthetically generated data by a memory model of the form (2), see Section 2.3. To determine the optimal MLE, we used the negative bino-mial model ofR’s MASS-library [20] to find the param-eters α∗(τmodel,η) and r∗(τmodel,η) for fixed values of
τmodel andη. For the resulting functionL∗(τmodel,η) = L(τmodel,η,r∗(τmodel,η),α∗(τmodel,η)), maxima in η and
τmodelwere determined numerically.
b
a
Fig. 3 aSlowly varying average bicycle countP(t)obtained by local regression (solid black curve) and monthly bicycle counts (blue squares) for the location “Kreuzberg”;bPredictions of the bicycle volume model for the deviationW(tj)(red triangles at the monthly count dates and black crosses, otherwise) and the blue squares indicate the observed numberswjduring monthly bicycle counts
has a considerable variance with respect to the true value ofτ.
Thus, the value of the optimalτmodelseems to yield an indicator for the presence of a memory for the synthetic data although it has only limited suitability for a precise recovery of the true memory size. If a memory τ > 1 was used in (8) to generate the data the best estimation was also obtained for τmodel > 1. Especially for larger
τ the deviation of the maximizing τmodel from τ is not too surprising since for larger values of τ its influence
on the predictor (8) becomes weaker (the average inEτ,η
smooths its time series for longer memory times). Nev-ertheless, we conclude that the proposed method might bear some potential for the identification of temporal correlation in crash data if it is present to a sufficient degree.
3.3 Application on Berlin crash data
In this section, we report results from the application of the proposed models to crash data collected by the
Berlin Police Department throughout the years 2001– 2014 [1] and to data on the estimated bicycle volumes obtained from the model in Sections 2.2 and 3.1. We studied the relation between crash frequency and bicycle volumes for different levels of temporal aggregation and tested whether the models improve due to the inclusion of memory. Interestingly, different effects where found on different time scales. Over a longer period bicycle volumes increase and the individual risk decreases, while over short (seasonal) intervals the opposite effect, i.e., a pos-itive correlation of risk and bicycle volume, is observed. For this phenomenon the term Hazard-in-Numbers (HiN) was proposed by Elvik [8]. The following table summa-rizes the phenomena observed on different aggregation levels:
Annual Monthly/seasonal Daily
possible SiN yes no no
possible HiN no yes no
3.3.1 Data sources
The the crash database provided by the Berlin Police Department [1] reports on approximately 1.37 million crashes in Berlin for the years 2001–2014 including all classes of traffic participants. Besides the spatio-temporal reference for the single crashes the data contain informa-tion on participant types, crash types, severities, circum-stances, and causes. For this study we took into account 73,088 crashes between bicycles and motorized vehicles within the given period. This subset of the total crash database contains 143 fatalities, all of which are bicyclists, 5936 heavily injured (5347 bicyclists), and 54984 lightly injured (49268 bicyclists). Note that the dataset also con-tains information on crashes, where only material damage occurred. However, for the overall qualitative assessment in this study we disregarded any individual information on the crash type, severity, etc. We note that the volume of motorized traffic has probably varied much less than the bicycle volumes as indicated by the number of regis-tered vehicles reported in [4]. This lead us to disregard this factor in the following.
3.3.2 Data analysis on different time scales
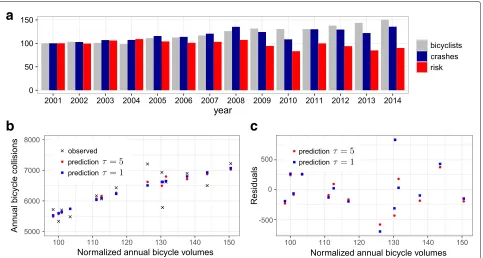
The variable quantities of risk and bicycle volumes have been normalized either to the year 2001 (in case of annual values) or to the mean over all samples (in the case of daily and monthly aggregation). For instance, a value of X(t) ≈ 130 for the yeart = 2011 indicates an increase of the bicycle volumes by thirty percent since 2001, see Fig.5a.
For the different aggregation levels, the variable’s values are to be considered as aggregated values over the corre-sponding period of time such thatX(t) may correspond
to the normalized average bicycle volumes over the entire year, month, or day, depending on the context.
Annual aggregation On an annual level the maximal likelihood was obtained by the inclusion of aτ = 5 year memory. Figure5bshows the data points and the regres-sion corresponding toτ = 1 andτ = 5. A closer look at the residuals of the predictions does not reveal a sys-tematic improvement of predictions for larger memories [cf Fig.5c] and an indication of temporal correlation of the hypothesized kind cannot be claimed.
However, the risks were declining within the considered period of time while the bicycle volumes were increasing, see Fig. 5a, and although no clear indication of tempo-ral correlation was found, this leaves the possibility of a SiN effect on a slow time scale, i.e., that the rising bicycle volumes during the last decade have lead to a better famil-iarization of Berlin’s drivers with the expectable behaviour of the bicyclists.
Monthly aggregation Figure6illustrates the results on a monthly time scale from several perspectives. In Panel (a) the normalized average monthly risks are plotted per month indicated by black crosses (14 values per month, i.e. one per month per year during the considered time span 2001–14). The mean values of the averages are indicated as blue squares and a local regression is added to guide the eye. One can observe that on average the risk seemed to be higher during the warm season. Since the estimated bicy-cle volumes were higher at that time as well, the relation between individual risk and bicycle volumes is reversed in comparison to the annual scale. This is also resembled by the positive slope of the risk in dependence of the volumes as shown in Fig.6c. This phenomenon points towards the opposite of an SiN effect, i.e., a Hazard-in-Numbers effect.
Daily aggregation As for the annual and the monthly aggregation the estimate on the daily crash numbers were not improved by a non-linear fit, i.e., using a model of the form (2). Independent of the size of the memoryτthe ML estimation gaveη≈ 0, which did effectively set the term Eτ,η constant equal to one and signifies that the relation between volumes and crashes was linear on average. Since Eτ,ηcontains the memory terms the ML estimation for the negative binomial model gave the same valuesα ≈ 0.295 andr≈4.77 for all choices ofτ.
b
a
c
Fig. 5 aDevelopment of normalized annual bicycle volumes (official estimate), crash numbers, and risk in Berlin (the reference for the normalization is the year 2001, where the number of accidents was 5332);bNormalized annual bike volumes versus the observed and predicted annual crash numbers. Predictions are obtained from a ML fit for (2) without memory, i.e.,τ=1, and withτ=5 years memory, which yielded the maximal likelyhood amongτ=1,. . ., 10;cNormalized annual bike volumes versus the residuals for the predictions shown in (b)
4 Discussion
Summary In the present work we have developed an approach to establish the existence of a SiN effect on the basis of temporally mapped data sets on bicycle volumes and crashes involving bicyclists and motorized vehicles.
Following the idea of attributing the SiN effect to an increased experience or attention of the motorists towards VRUs we introduced a model term to capture the evolution of this experience, see (2) and (3), and
we provided a proof of concept utilizing synthesized data.
This approach generalizes previous attempts to account for the nonlinearity of the relation of volumes and collisions via the inclusion of an exponentγ [cf. Eq. (4)]. Model (2) potentially permits to study a temporal relation between the first appearance of a change in the volume and a delayed response of the risk. Such a delayed corre-lation could give a significant hint to the causal recorre-lation
0.5 1.0 1.5
Jan Mar May Jul Sep Nov
nor
maliz
ed r
isk (monthly a
vg.)
a
0 250 500 750 1000
0 50 100 150
norm. monthly bicycle volumes
monthly bicycle collisions
b
0.5 1.0 1.5
60 90 120 150
normalized monthly bicycle volumes
nor
maliz
ed monthly r
isk
c
0 20 40 60
0 50 100 150 200
normalized predicted bicycle volumes
daily bicycle collisions
a
0 2 4
50 100 150 200
normalized predicted daily bicycle volumes
daily r
isk (rel. to mean)
b
Fig. 7Normalized, predicted daily bicycle volumes versus (a) the daily collisions involving bicyclists and motorised vehicles and (b) the corresponding daily risks
between the two quantities. The problem of determining the causality is of major importance to the identification of a true SiN effect because an NbS effect could likewise be responsible for a mere inverse correlation of volumes and risks [5,9]. Still a careful interpretation is needed even if the change of the risk is delayed with respect to the change of the bicycle volumes, since it does not ultimately prove the presence of an SiN effect. After all it might be caused by a delayed reaction of the responsible authorities in implementing a better infrastructure after increasing volumes have been recognised.
Empirical findings for Berlin We have tested the pro-posed memory model (2) on data sets for the city of Berlin leading to different results on different levels of temporal aggregation, see Section3.3. For a more thorough evalua-tion of the model’s usefulness it would certainly be helpful to apply it to different data, where a SiN-effect was sus-pected, since no clear indication was obtained for Berlin that delayed correlations were present between volumes and crash numbers. Despite of the rising numbers in last decades, Berlin has a long-standing tradition of bicycle traffic and for Berlin’s drivers an encounter with a bicy-clist is no rare event. Based on the proposed mechanism of developing correct expectations towards cyclist behaviour it may be expected that the largest SiN effect and thus the clearest statistical evidence could be found in areas where the amount of cyclists is very low at some point in time and increases in relation to this former state rather than in absolute numbers.
The application of the proposed model (2) on data from Berlin pointed out the interesting possibility that a SiN effect on a yearly scale could coexist with a HiN effect [8] on a seasonal scale. Indeed, on an annually aggregated
level we found that rising bicycle volumes over the past years have been accompanied by a decreasing individual risk. However, we advise caution in the interpretation as a SiN effect since other delayed effects, as for instance infrastructural adaptations, might interfere. On the con-trary, on a monthly time scale, higher bicycle volumes were accompanied by higher individual risks. A possible explanation for this finding could be an increased num-ber of inexperienced bicyclists occurring at better weather conditions although we do not know of any studies sup-porting this hypothesis. We note that our results stand in contrast to results of Fyhri et al. [12] who report on a SiN effect in the context of seasonal fluctuations of bicy-cle volumes in Oslo. A higher volume of bicyclists in the warm season was found to be correlated to a lower risk of suffering a traffic collision with a motorised vehicle there. For the careful interpretation of the results for Berlin one must also have in mind that the scarce knowl-edge of the volume of motorized vehicles in Berlin may exclude an important confounding factor from the model. On one hand, commuters are not regarded in the main source for the assumption of constant volumes [4]. Fur-ther, using numbers of registered vehicles as a proxy for exposure may fail if the average individual mileage did vary in the considered time span. Moreover, infrastruc-tural measures have not been accounted for, although they might as well play and important role as a time vary-ing factor. Thus, both factors represent possible unob-served heterogeneities, that may introduce an estimation bias [16,21].
an improvement of either the model itself or for the study of its properties. Possible alternatives to the term 1+Xτη
in (2) could be either (1+Xτ)η, which has the advantage of yielding the same linear model forγ =0 as forXτ =0, orexp(ηXτ), giving the same value forηindependent of the scaling forXτ. However, both alternatives do not yield a natural definition ofEη,τ with value zero for Xτ = 0. Another possible modification, replacing the averageXτ
by a weighted memory could result in improvements in case of an ML estimate [it does not for a non-linear LS fitting, see [17]]. It is also necessary to emphasize that the assessment of the result’s significance should be done on a more rigorous level. This is no trivial task due to the non-linearity on one hand and, on the other hand, due to the statistical dependence of the samples, which is introduced by the memory terms.
Bicycle volume model Since for Berlin there were bicy-cle counts available only at a few locations and at most once per month, a model for the daily and monthly vari-ation of the overall bicycle volume in Berlin was derived on the basis of weather data. Obviously, the suitability of this model is crucial for the correctness of the derived results on the overall shape of the functional dependence between volumes and crash frequency as well as for the recovery of temporal patterns. Some additional efforts might be invested into its verification. On one hand this seems advisable due to the relatively large deviation of its predictions from the actual counts [see Fig.3b] and also by the observation that the distribution of crashes in depen-dence of the bicycle volumes seems to be skewed such that a negative intercept provides a better fit [see Figs.6b and 7a]. A corresponding bias towards overestimating lower bicycle volumes, which might be conceivable in Fig.2aandbin comparison to Fig.2c, could also induce the obtained positive correlation of volumes and risks, see Figs. 6c and 7b. Further factors that may be taken into account in a more detailed model for bicycle volumes are for example holidays, construction sites or strikes in public transport.
Practical implications There is a high demand of clear guidelines on how to include SiN as a factor in practi-cal transportation planning. Especially in the context of policies that promote a shift to more sustainable trans-portation modes a SiN effect could serve as an argument for a shift towards cycling or walking. However, depend-ing on the strength of the effect the increased average severity of crashes between cars and bicycles could still be contraindicative.
Further, if the immediate reason of increased visibil-ity can be shown to be a major factor in an existing SiN effect it may be advantageous to seek the concen-tration of bicycle streams on major bicycle routes. In
that way a situation, where several bicyclists travel as a group, might be generated more frequently and thereby provoke the supposed increase in safety arising from this situation.
A possible way to exploit an assumed increase in safety due to an increased driver’s experience (even without altering the traffic volumes) could be the deliberate provo-cation of traffic situations, which can be considered rel-atively safe but require the interaction of drivers and bicyclists. For instance, the promotion of mixed traffic or shared spaces could represent adequate measures, if it can be assured that the increased number of encoun-ters does not adversely affect safety. After all, the fac-tor of perceived safety should not be neglected when considering such measures for increased interaction. In particular, because the alleged Numbers-by-Safety effect may in reality rather be a Numbers-by-Perceived-Safety effect.
As partly underlined by the data from Berlin presented in this work and by differing results in the literature, the SiN effect can not be assumed universal, i.e., it does not automatically arise if bicycle volumes are increased. The impact of an increasing number of bicyclists on the car driver’s attentiveness and experience may be differ-ent from situation to situation. For instance, the learning process may saturate at some level of bicycle volume, above which further increase does not lead to significant changes in the driver’s behaviour. Another important vari-able may be the variation of the average skill level of the bicyclists with the total volumes.
Up to date no definite method exists to predict for a given area whether a SiN effect could be expected – not to mention the prediction of its strength. Still, there is a qualitative argument for a shift towards cycling taking into account the decreasing numbers of motorized vehi-cles during this process: Assuming that the safety situation would improve if everybody exclusively uses the bicycle for his/her daily trips, i.e., when the shift is “complete”, a “tipping point” has to exist at some value of the propor-tion of traffic modes beyond which the safety situapropor-tion is better for the increased bicycle share. Elvik [7] has com-puted several values explicitly for a range of scenarios and for an assumed impact of a SiN effect.
Authors’ contributions
The author read and approved the final manuscript
Competing interests
The author declares that he has no competing interest.
Publisher’s Note
Springer Nature remains neutral with regard to jurisdictional claims in published maps and institutional affiliations.
References
1. (2001) Unfalldatenbank der Polizei Berlin. Road Crash Database of the Berlin Police Department (2001-2004). Tech. rep., Polizei Berlin, PPr St II 4
2. (2014) Fahrradverkehr-Pegelzählungen Berlin - Jahresbericht 2014. Tech. rep., Verkehrslenkung Berlin (VLB).http://www.stadtentwicklung.berlin. de/verkehr/lenkung/vlb/download/bericht_radverkehr_2014.pdf, (in German). Accessed 15 Aug 2017
3. (2015) Historische tägliche Stationsbeobachtungen, Station Berlin-Tempelhof. Tech. rep., Climate Data Center of the Deutscher Wetterdienst (DWD).ftp://ftp-cdc.dwd.de/pub/CDC/observations_ germany/climate/daily/kl/historical/tageswerte_00433_19480101_ 20151231_hist.zip, (in German). Accessed 15 Aug 2017
4. (2015) Statistisches Jahrbuch 2015. Tech. rep., Amt für Statistik Berlin-Brandenburg.https://www.statistik-berlin-brandenburg.de/produkte/ Jahrbuch/jb2015/JB_2015_BE.pdf, (in German). Accessed 15 Aug 2017 5. Bhatia R, Wier M (2011) Safety in Numbers re-examined: Can we make
valid or practical inferences from available evidence? Accid Anal Prev 43(1):235–240
6. Ekman L (1996) On the Treatment of Flow in Traffic Safety Analysis,-a non-parametric approach applied on vulnerable road users.
Bulletin/University of Lund, Lund Institute of Technology, Department of Traffic Planning and Engineering, Vol 136. Department of Traffic Planning and Engineering, Lund Institute of Technology
7. Elvik R (2009) The non-linearity of risk and the promotion of environmentally sustainable transport. Accid Anal Prev 41(4):849–855 8. Elvik R (2013) Can a safety-in-numbers effect and a hazard-in-numbers
effect co-exist in the same data? Accid Anal Prev 60:57–63
9. Elvik R, Bjørnskau T (2017) Safety-in-numbers: a systematic review and meta-analysis of evidence. Saf Sci 92:274–282
10. Fyhri A, Bjørnskau T, Laureshyn A, Sundfør HB, Ingebrigtsen R (2016) Safety in Numbers - uncovering the mechanisms of interplay in urban transport. Transportøkonomisk Institutt 2016., TØI Institure, Oslo. ISBN: 9788248012566.https://www.toi.no/getfile.php?mmfileid=42927 11. Fyhri A, Bjørnskau T, Backer-Grøndahl A (2012) Bicycle helmets - A case of
risk compensation? Transp Res F Traffic Psychol Behav 15(5):612–624 12. Fyhri A, Sundfør H, Bjørnskau T, Laureshyn A (2017) Safety in numbers for
cyclists-conclusions from a multidisciplinary study of seasonal change in interplay and conflicts. Accid Anal Prev 105:124–133
13. Jacobsen PL (2003) Safety in numbers: more walkers and bicyclists, safer walking and bicycling. Inj Prev 9(3):205–209
14. Jonsson T (2005) Predictive models for accidents on urban links-A focus on vulnerable road users. Bulletin/Lund Institute of Technology, Department of Technology and Society, Vol 226. Department of Technology and Society, Lund University
15. Liu P, Marker S (2016) Evaluation of contributory factors - effects on bicycle-car crash risk at signalized intersections, To appear in the Proceedings of the International Cycling Safety Conference 2016, Bologna 16. Lord D, Mannering F (2010) The statistical analysis of crash-frequency
data: a review and assessment of methodological alternatives. Transp Res A Policy Pract 44(5):291–305
17. Lücken L, Wagner P (2016) On the relation between bicycle volumes and individual risks for bicyclists in Berlin, To appear in the Proceedings of the International Cycling Safety Conference 2016, Bologna.https://elib.dlr.de/ 110827/1/Luecken_On%20the%20relation%20between%20bicycle %20volumes%20and%20individual%20risks%20for%20bicyclists%20in %20Berlin.pdf
18. Phillips RO, Bjornskau T, Hagman R, Sagberg F (2011) Reduction in car-bicycle conflict at a road-cycle path intersection: Evidence of road user adaptation? Transp Res F Traffic Psychol Behav 14(2):87–95.http:// doi.org/10.1016/j.trf.2010.11.003.http://www.sciencedirect.com/science/ article/pii/S1369847810000859
19. Smeed RJ (1949) Some statistical aspects of road safety research. J R Stat Soc Ser A (General) 112(1):1–34
20. Venables WN, Ripley BD (2013) Modern applied statistics with S-PLUS 21. Washington SP, Karlaftis MG, Mannering F (2010) Statistical and
![Fig. 2 Synthesized crash data [in (a) without memory and in (b) with memory] and real crash data [in (c)]](https://thumb-us.123doks.com/thumbv2/123dok_us/879605.1585422/5.595.62.542.87.245/fig-synthesized-crash-data-memory-memory-real-crash.webp)