S o n g - Y u n g W a n g • T s a i - Y u n g C h e n • J a n n - D e r F a n n
Comparison of internal bond strength and compression shear strength of
wood-based materials
Received: August 18, 1998 / Accepted: January 8, 1999
A b s t r a c t The purpose of this study was to design a com- pression shear device for easy and fast measurement of the bonded shear strength of wood-based materials to replace the conventional method used to evaluate internal bond strength (IB). To assess the performance of this device, five differently sized specimens, included group I (dimension 5 × 1 cm), group II (5 × 2 cm), group III (5 × 3 cm), group IV (5 × 4 cm), and group V (5 × 5 cm) cut from commercial particleboard and medium-density fiberboard (MDF) (1.8 cm thick) were tested in compression shear. Only group V (5 × 5 cm) was prepared for the IB test. Results indicated that the compression shear strengths (CS) of particleboard and MDF, loaded in the horizontal or the diagonal direc- tion, were greater than the IB, although a significant corre- lation existed between the two. This finding suggests that the IB of particleboard and M D F could be accurately esti- mated from the data collected by the CS test.
K e y w o r d s Compression shear device • Internal bond strength • Compression shear strength • Particleboard • Medium-density fiberboard
Introduction
It has been reported 14 that several fast, simple testing meth- ods have been developed to evaluate the internal bond (IB) strength of particleboard and to replace the conventional IB
S.-Y. Wang ( ~ )
Department of Forestry, College of Agriculture, National Taiwan University, No.1. Sect. 4, Roosevelt Road, Taipei, Taiwan, ROC Tel. +886-2-2363-1736; Fax +886-2-23631736 or 886-2-23654520 e-mail: sywang @ ccms. ntu. edu. tw
T.-Y. Chen. J-D. Fann
Department of Forestry, College of Agriculture, National Chung Hsing University, Taichung, Taiwan, ROC
Part of this report was presented at the Third Pacific Rim Bio-based Composites Symposium, Kyoto, December 2-5, 1996
methods, Although there was high correlation between the values collected from the proposed simple tests and the standard IB test, none of the new tests was sufficiently satisfactory to replace the latter.
In this study, a compression shear (CS) method was de- veloped for collecting shear strength data of wood-based materials, and the results were compared to the tensile strength perpendicular to the surface determined by the conventional IB method. The purpose of this study was not only to determine the relation between results determined by the CS method and the IB method for particleboard or medium-density fiberboard (MDF) but also to assess the applicability of the CS method to adhesives and bond qual- ity control as well as many other possible uses. Because of the heterogeneity of wood-based materials, special consid- eration must be taken into account when performing the tests using this device.
Materials and methods
Materials
The test specimens were taken from 18mm thick commer- cial particleboards (three-layer structure) and M D F bonded with urea-formaldehyde (UF) resin. Thirty-five specimens for each group (based on size) were prepared for IB and CS tests in which specimens were subjected to horizontal and diagonal loads. Five groups of specimens were prepared based on size as follows: group I (5 × i cm); group II (5 × 2cm); group I I I (5 × 3cm); group IV (5 × 4cm), and group V (5 × 5 cm); all were randomly selected. For the IB test, only group V (5 × 5 cm) was tested. Prior to the test, all specimens were conditioned in a controlled-environment chamber: 20°C and 65% relative humidity (RH).
Methods
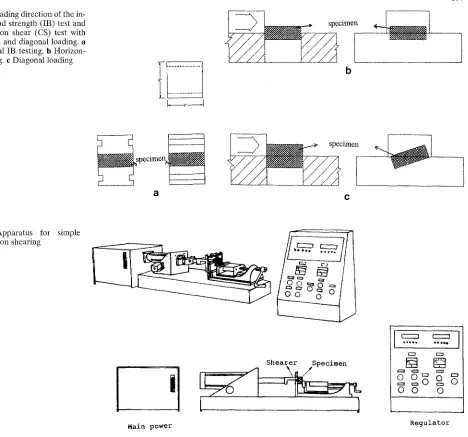
Fig. 1. Loading direction of the in- ternal bond strength (IB) test and compression shear (CS) test with horizontal and diagonal loading, a Traditional IB testing, b Horizon- tal loading, e Diagonal loading
~ e c i m e i
b
397
specimel~
a
specimen
C
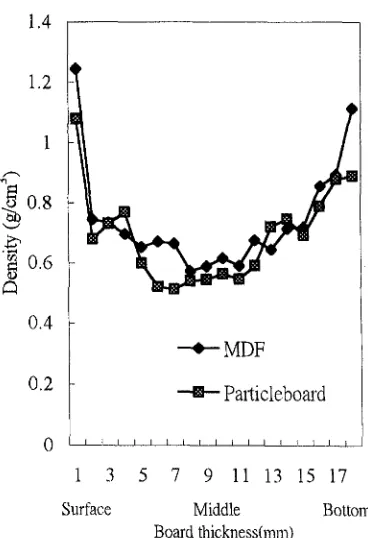
Fig. 2. Apparatus for simple compression shearing
- 1
~c'~ ~ ~'
Main
power
~
~
Sheax~
//Specimen
i
]
0 0 0
Regulator
standards such as DIN 52365, JISA 5908, CNS 2216, and ASTM D1037, as shown in Fig. la. The CS device is shown in Fig. 2. The specimen is subjected to compression-shear loading until failure occurs. The loading direction for hori- zontal specimens (Fig. lb) was set up to be parallel to the surface of the particleboard or MDF as closely as possible, and the cross-head of loading passed through the middle layer at l c m (group I), 2cm (group II), 3cm (group III), 4cm (group IV), or 5cm (group V) of the specimen. In addition, diagonal loading was positioned as shown in Fig. lc. The constant loading rate was set at 2mm/min, and the maximum load at failure was recorded.
specimens are shown in Fig. la-c. The tester holds the specimen tightly by hand-turning the fine-threaded rod in the CS device. The device can be adjusted to allow the loading of compression shear at a constant rate through the target layer of the specimen. The specimens also could be loaded in the horizontal or diagonal direction to meet the experimental design.
The stress concentrations and the interactions between the loading head of the CS device and the wood-based specimens were considered in the design of this CS device, which has proved to be one of the most efficient and easiest methods for determining shearing strength.
Results and discussion
Design of the compression shear device
The CS device developed in this study is different from other shear testing apparatuses. The testing device and the
Comparsion of the conventional IB test and the developed CS test
Table 1. Results of Duncan's new ranged analysis for compression shear strength among five groups of specimens
Group Compression shear strength (kgf/cm 2)
Particleboard Horizontal loading
IV 14.1 --
III 14.1 _+
II 15.3 -+
V 15.8 -+
I 16.8 -+
Diagonal loading
IV 18.2 _+
V 19.2 _+
III 20.5 +
II 25.3 -+
I 28.7 -+
Medium-density fiberboard Horizontal loading
I 9.2 +_
III 10.8 -+
IV 12.1 +-
II 13.9 +-
V 17.8 +
Diagonal loading
III 24.2 -+
IV 24.7 +-
V 25.7 _+
II 30.6 _+
I 37.8 -+
2.2 },NS 1.7 2.3 ] NS
1.6 }NS
2.7 NS
2.8 NS 1.2 2.5 2.7 3.2 2.9 2.1 NS 2.6 3.5 2.2 2.6 3.8 NS 2.2 4.9 4.3
Results are means _+ SD NS, not significant at P < 0.05
surface is made on specimens in the dry condition to deter- mine cohesion of the wood-based materials. The test was designed for quality control of wood-based panels. For ob- taining reliable data of IB strength, treatment of the test specimen was suggested in this A S T M D1037-965 as follows: A n y suitable adhesive that provides an adequate b o n d m a y be used for bonding the specimens to the loading blocks (steel or aluminum). E p o x y resins are r e c o m m e n d e d as satisfactory bonding agents. T h e pressure required to b o n d the blocks to the specimens depends on the density of the board and the adhesive used and should not be so great as to measurable damage the specimen. The resulting bond must be at least as strong as the cohesive strength of the material perpendicular to the plane of the panel. T h e bond- ing of specimens with two steel or aluminum blocks is time- consuming, so some time-saving shear testing methods were developed,l-4,6 10 and have been investigatedY 1-14 The com- m o n goal of these studies was to develop a simple, easy, fast shear testing m e t h o d that can be used for quality control of wood-based panels.
Shear properties of particleboard
The average (+-SD) value for the IB strength of particle- board obtained by the conventional testing m e t h o d as speci- fied by A S T M D1037-96 was 3.19 -+ 0.35 kgf/cm 2. However, the values of CS varied with the dimension of specimens and the loading direction. Results of D u n c a n ' s new ranged analysis a m o n g these five size groups are presented in Table 1. In the case of horizontal loading, because the three-layer
1.4
1.2
~
0.80.6
0,4
0.2
I I I I I
1 3 5
Surface
MDF
Pal~icleboard
t I I I i I I I I I ~
7 9 11 13 15 17
Middle Bottom
Board thickness(ram)
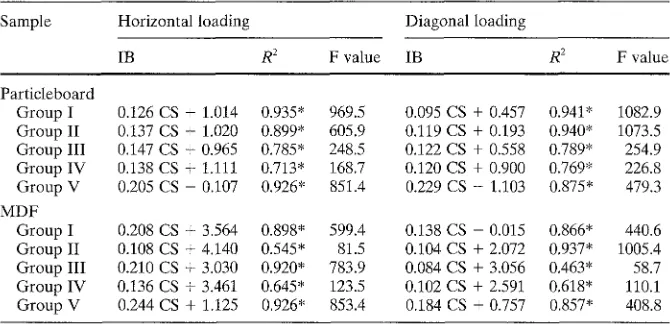
Fig. 3. Density distribution through the thickness of particleboard and medium-density fiberboard (MDF)
particleboard had a layered structure and the weakest area occurred near or at the center layer of the particleboard, the CS failure followed the center layer of the board. Note also in Table 1 that except for the group V specimen, the CS values for small specimens, such as group I, were signifi- cantly greater than those of larger specimens (group IV and III). This m a y be due to the fact that in the CS test the resulting shearing stress along the center face m a y vary with the area subjected to compression. Doubtlessly, the largest shearing stress occurred on the shearing face near the loading head; normal stress may also occur in that region. Therefore when shearing failure appears near the shearing contact surface, the resistant force in the specimen m a y be weakened. T h e shearing strength was calculated from the shearing force divided by the predicted failure area. There- fore, the specimens with a smaller face area (group I), al- though they had a smaller shearing failure area, showed larger shearing strength values. N o t e that the density distri- bution of particleboard varied along the thickness direction (surface-to-bottom), as shown in Fig. 3. The largest density values (1.078 g/cm 3) were observed at the surface layer and decreased inward, and the lowest values (0.512-0.545 g/cm 3) were found at distances 7-9 m m from the surface and then increased gradually to 0.889 g/cm ~ at the b o t t o m layer. The average (_+SD) density was 0.710 -+ 0.150g/cm 3, indicating that the weakest area should be at the low-density layer. However, the shearing strength obtained by this CS test was 4.4-5.3 times greater than the IB values. Figure 4 showed the horizontal loading condition and fractured shape of the specimen of particleboard in this CS test.
Fig. 4. Horizontal loading condi- tion (a) and the fractured shape of the particleboard specimen (b) in this CS test. Arrow indicates the compression shear direction
Fig. 5. Diagonal loading condi- tion (a) and the fractured shape of the particleboard specimen (b) in this CS test. Arrow in- dicates the compression shear direction
Table 2. Linear regression formulas for IB and CS of particleboard and MDF Sample Horizontal loading Diagonal loading
IB R 2 F value IB R 2 F value
Particleboard
Group I 0.126 CS + 1.014 0.935* 969.5 0.095 CS + 0.457 0.941" 1082.9 Group II 0.137 CS + 1.020 0.899* 605.9 0.119 CS + 0.193 0.940* 1073.5 Group III 0.147 CS + 0.965 0.785* 248.5 0.122 CS + 0.558 0.789* 254.9 Group IV 0.138 CS + 1.111 0.713' 168.7 0.120 CS + 0.900 0.769* 226.8 Group V 0.205 CS - 0.107 0.926* 851.4 0.229 CS - 1.103 0.875* 479.3 MDF
Group I 0.208 CS + 3.564 0.898* 599.4 0.138 CS - 0.015 0.866* 440.6 Group II 0.108 CS + 4.140 0.545* 81.5 0.104 CS + 2.072 0.937* 1005.4 Group III 0.210 CS + 3.030 0.920* 783.9 0.084 CS + 3.056 0.463* 58.7 Group IV 0.136 CS + 3.461 0.645* 123.5 0.102 CS + 2.591 0.618' 110.1 Group V 0.244 CS + 1.125 0.926* 853.4 0.184 CS + 0.757 0.857* 408.8
IB, internal bond strength; CS, compression shear strength * Significantly different at P < 0.01
shear failure m a y n o t develop along the center (weakest) layer of specimen. T h e CS values o b t a i n e d from diagonal loading were 1.2-1.7 times greater t h a n those o b t a i n e d from h o r i z o n t a l loading. T a b l e 1 shows that the CS values had a decreased t r e n d as follows: group I > group II > group III > group I V > group V. A significant difference was n o t observed b e t w e e n group I V a n d group V b u t was seen a m o n g other groups (I, II, a n d III). A g a i n smaller speci- m e n s had larger CS values, a n d the reasons for this t r e n d m a y be similar to those m e n t i o n e d above. T h e CS values of
the diagonal loading specimens also were 5.7-9.0 times greater t h a n the IB values. Figure 5 shows the diagonal loading c o n d i t i o n a n d fractured shape of the specimen of particleboard in this CS test.
4.50
4.00
3.50 E
3.00
2.50
2.00
1.50
1.00
0.00 5.00
+
z /
x Horizontal loading : group V specimens + Diagonal loading : group ~II specimens
10.00 15.00 20.00
CS(Kgf/cm 2)
25.00 30.00
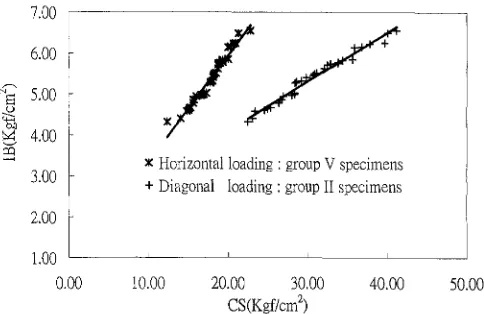
Fig. 6. Relations between IB and CS for particleboard
35.00
7.00
6.00
5.00
4.00
3.00
2.00
1.0o
0.00
x Horizontal loading : group V specimens + Diagonal loading : group II specimens
i i i i
10.00 20.00 30.00 40.00 50.00
CS(Kgf/cm 2)
Fig. 7. Relations between IB and CS for MDF
F test. Some examples for the relations between CS and IB are shown in Fig. 6. Therefore, the IB of particleboard m a y be adequately predicted using the CS value. For the CS test the most suitable specimen dimension was that of group 1 for both horizontal and diagonal loading.
Shear properties of M D F
T h e average (_+SD) value for the IB of M D F obtained using the conventional testing m e t h o d as specified by A S T M D1037-965 was 5.36 _+ 0.60kgf/cm 2. The CS values also var- ied with the dimension of the specimens and loading direc- tions. The results of D u n c a n ' s new ranged analysis a m o n g specimens based on size are presented in Table 1. With horizontal loading, the CS values had a decreasing trend as follows: group V > group II > group IV > group I I I > group I. Significant differences were not observed between groups IV and III, but significant differences were seen among other groups (V, II, I). This finding was contradic- tory to those observed in particleboard, in which group I (smallest-dimension specimens) had larger CS values. This m a y be attributed to the density distribution along the thickness direction of the MDF. As shown in Fig. 3, the largest density values (1.253 g/cm 3) occurred at the surface layer and decreased inward, with the lowest value measured at a position about 8 m m from the surface; it then increased and achieved a larger value (1.110 g/cm 3) at the bottom. The average (_+SD) value of density was 0.755 + 0.185g/cm 3. The CS values for M D F were 1.7-3.3 times greater than the IB values.
With diagonal loading, a decreasing trend for CS values was observed as follows: group I > group II > group V > group IV > group III. A significant difference did not exist a m o n g groups V, IV, and III; but there was a difference between groups I and II. This decreasing trend was just the opposite of those of loaded horizontally, but it was similar to those observed in particleboard. The CS values of M D F obtained by diagonal loading were 4.5-7.1 times greater than the IB values.
W h e n a comparison was made between CS values ob- tained from tests of horizontal and diagonal loading, it was
found that the values f r o m the larger shearing area speci- mens (i.e., group V) were closer. T h e CS value obtained from diagonal loading was 1.4 times greater than that ob- tained with horizontal loading but 4.1 times that in the smaller shearing area specimens (group I). This m a y be due to the fact that the diagonal face included a larger density zone and therefore yielded larger CS values.
W h e n the relation between the CS and IB values for various specimens were considered, it was found that the IB value increased linearly with the increase in CS value, and their relations could be represented by linear regression formulas, as shown in Table 2. The coefficients of determination (R;) ranged from 0.545 to 0.937. A highly significant difference was seen in the F test. Some examples of the relations between CS and IB are shown in Fig. 7, which shows that the IB of M D F can be adequately predicted using the CS value. W h e n using the CS test the most suitable dimensions of specimens are those of groups V and II, respectively, for horizontal and diagonal loading.
Conclusion
The designed CS device can be used to evaluate b o n d strength in the weakest layer of wood-based materials. In the horizontal and diagonal loading tests, the CS values were 4.4-9.0 and 1.7-7.1 times higher than the IB values for particleboard and M D F , respectively. In the horizontal and diagonal loading tests, the IB values for particleboard and M D F increased linearly with the increase in CS values, and their relations could be represented by linear regression formulas, with a high correlation. Therefore, the IB values for particleboard and M D F could be adequately predicted using the CS value.
References
1. Oertjejansen RO, Haygreen JG (1971) Torsion shear test for par- ticleboard adapted to a universal testing machine. For Prod J 21(11):59-60
2. Hall HJ, Haygreen JG (1983) The Minnesota shear test. For Prod J 33(9):29-32
3. Suchsland O (1977) Compression shear test for determination of internal bond strength of particleboard. For Prod J 27(1):32- 36
4. Shen KC, Carroll MN (1969) A new method for evaluation of internal strength of particleboard. For Prod J 19(8):17- 22
5. ASTM D1037-96 (1996) Standard test methods for evaluating properties of wood-based fiber and particle panel materials. ASTM, West Conhohochen, PA
6. Grezeczynski T, Basowski S (1963) Verfahren zur schneller bestimmung der zugfestigkeit zur plzttenebene. Holz Roh Werkstoff 21:495-496
7. Gaudert P (1974) New torsion test for particleboard. For Prod J 24(2):35-37
8. Gressel P (1975) Eignung der blockscher-prucefmenthode zur beurteilung der verleimungsqualitact von spanplatten. Holz Roh Werkstoff 33:393-398
9. Liiri O, Kivistoe A, Tuominen M, Aho M (1980) Determination of the internal bond of particleboard and fiberboard. Holz Roh Werkstoff 38:185-193
10. Passialis C, Tsoumis G (i982) A method for testing internal bond of particleboard. Wood Fiber 14:159-161
11. Liu JY (1984) New shear strength test for solid wood. Wood Fiber Sci 16:567-574
12. Meierhofer UA, Sell J, Sommerer S (1977) Blockscher-pruefung von holzspanplatten zur emittlung der guete des spanverbundes. Holz Holzverwertung 29:6-8
13. Noack D, Schwab E (1972) Die scherfestigkeit von holzspan- platten als kriterium des spanvrbundes, Holz Roh Werkstoff 30:440-444