www.j-sens-sens-syst.net/5/205/2016/ doi:10.5194/jsss-5-205-2016
© Author(s) 2016. CC Attribution 3.0 License.
First steps to develop a sensor for a Tian–Calvet
calorimeter with increased sensitivity
Franz Schubert1, Michael Gollner2, Jaroslaw Kita1, Florian Linseis2, and Ralf Moos1 1Department of Functional Materials, University of Bayreuth, 95440 Bayreuth, Germany
2LINSEIS Messgeräte GmbH, 95100 Selb, Germany
Correspondence to:Franz Schubert ([email protected])
Received: 11 February 2016 – Revised: 15 May 2016 – Accepted: 19 May 2016 – Published: 13 June 2016
Abstract. Initial steps to apply a ceramic multi-layer technique to build a new sensor for a Tian–Calvet calorimeter are presented in this contribution. The new sensor has a stacked design of ceramic sensor discs and insulating rings. The development was finite-element method (FEM) supported to design the sensor disc. In the next step, the function of the sensor disc was proven up to a temperature of 600◦C. Finally, the entire stack was tested at room temperature, delivering a resolution of 5 µW and a maximum sensitivity of 8.5 µV mW−1. The time constant is strongly dependent on the mass of the cuvette. We show that the time constant of the sensor can be more exactly characterized when using a novel low temperature co-fired ceramic (LTCC) cuvette with a low mass and an integrated heater. Then, the time constant can be reduced toT1/e=118 s. The new sensor
shows similar specifications as commercial devices and presents a good starting point for future high tempera-ture applications.
1 Introduction
1.1 The Tian–Calvet calorimeter and its special features
Calorimeters are designed to measure heat produced by chemical or physical processes. Calorimetry data help, for example, one understand the temporal progress of chemi-cal reactions, or to determine heat capacities or fusion en-thalpies (Höhne et al., 2003). One group of well-established instruments is based on the so-called “Tian–Calvet” princi-ple. Despite a large sample volume, this type of instrument shows remarkable sensitivity. It is generally used for high ac-curacy measurements of adsorption energies, chemical reac-tion heat, or ultra-accurate determinareac-tions of heat capacities (Becker and Gmehling, 2001), and many other applications that benefit from the large sample volumes (Auroux, 2013).
The Tian–Calvet calorimeter is based on the principle of differential measurements, meaning there are two identical cylindrical “sensors”1for heat, which are set up identically.
1The term “sensors”, as it is used in the calorimetry community,
may refer to a size of several centimeters or may encompass an entire device. It should not be mixed up with miniaturized devices that are called “sensors” in the metrology community.
One of these sensors measures the heat flow originating from the cuvette with a sample. The other sensor measures the heat flow originating from an inert reference, i.e., from an equal cuvette with a reference sample with an almost equal heat capacity to the sample. By subtracting both signals, the heat flow that is caused by the experimental setup can be elim-inated from the signal. Thus, the heat flow caused by the processes in the sample can be measured with fewer inter-ferences.
A drawback of those devices is the large time constant. It extends the time needed for titration experiments (Bäckman et al., 1994). Consequently, desmearing of the resulting sig-nal is necessary (Lyon and Farris, 1990; Löblich, 1994).
tact with the surrounding block. The inner tube is in con-tact with the cuvette with a diameter of 20 mm and a height of 70 mm. An array of thermocouples (thermopile principle) is arranged between the tubes that measures the tempera-ture difference between the inner and outer tube and thereby represents the difference in temperature between the sample and the furnace. Fabrication is most commonly performed by alternately welding two different types of wire together by hand and coupling the joints thermally to the tubes, yet in-sulating them electrically from the tubes. The space between the wires is filled with air. This process has not been changed much since the early concepts of Tian and Calvet (Calvet and Prat, 1956).
Possible methods to increase the sensitivity of the device comprise the minimization of the heat losses of the sensor by improving the thermal insulation. Thus, a chemical or phys-ical process induces a higher temperature gradient, which is easier to detect. Furthermore, the number of thermocouples can be increased by increasing spatial density, which yields a higher voltage signal, although care has to be taken that the heat losses of the sensor are not adversely affected. One may also apply thermocouple materials with higher Seebeck coefficients.
All these points are difficult to address with the currently established manufacturing process as it leaves limited pos-sibility for changes in design and limits the number of mocouples because it restricts the maximum density of ther-mocouples. Moreover, materials with higher Seebeck coeffi-cients are uncommon and expensive and are usually difficult to process into weldable wires.
In the past, different approaches have been developed to overcome these design limitations. One approach uses com-mercially available plate-shaped thermopiles for the sensor. Those sensors are built of block-shaped sintered ceramic thermoelectric materials with a high Seebeck coefficient. Therewith-built instruments exhibit a high sensitivity of up to 170 µV mW−1(SETARAM Instrumentation, 2015) or even 763 µV mW−1(Bäckman et al., 1994). However, to the best of our knowledge, no such device has been presented with an elevated operation temperature over 200◦C.
This may be due to the different shapes of sensor and sample container. Sample containers are cylindrical, which
Calvet calorimeters the maximum operation temperature and the sensitivity behave inversely.
The goal of this study is to establish the baseline to develop a device that can work at temperatures above 300◦C with an
increased sensitivity, compared to commercial devices. To realize such an instrument, we kept a setup that is sim-ilar to the traditional system. Our main approach is to in-crease the number of thermocouples as well as to apply ma-terials with higher Seebeck coefficients. To reach these goals, a low temperature co-fired ceramic (LTCC) technology is used to manufacture the sensor. In this technology, functional elements, in this case thermocouples, are screen printed as thick film structures on flexible ceramic green sheets. Af-ter firing, a ceramic structure with integrated functional el-ements is obtained. The technology is described in depth by Imanaka (2005) or Gongora-Rubio et al. (2001). Some recent developments in the sensor field are reviewed by Jurków et al. (2015). As a benefit, the thermal conductivity of LTCC is lower than that of metal and the thickness of the conduct-ing metal can be decreased, which is beneficial for thermal insulation of the sensor.
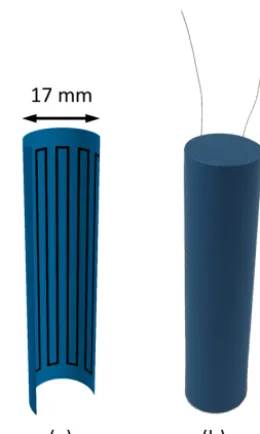
The disadvantage of this technique is the typical ceramic brittleness, not allowing for a monolithic structure of the entire sensor. Therefore, the sensor was built by alternately stacking two small main components – the sensing compo-nent as a series connection of circular sensor elements, each having a ring of a radial thermopile around it and rings of insulation material filling the space between the sensor discs, therefore allowing one to form the full sensor volume. Fig-ure 1a shows the conventional design with the series connec-tion of the wire thermocouples and Fig. 1b depicts the new concept.
Figure 1. Conventional design of the sensor with thermoelectric wires(a)and the new design(b)with LTCC substrates with printed thermocouples.
2 Experimental
2.1 Initial design, FEM modeling, and fabrication of the sensor disc and the sensor
For the body of the sensor disc, DuPont 951P2 LTCC tape was used (Imanaka, 2005; Kita and Moos, 2008). The ther-mal conductivity of LTCC is much lower than that of alumina (a.k.a. aluminum oxide), which is typically used in thick film technology (Kita et al., 2015). This increases the sensitivity. Additionally, structuring of green LTCC sheets is easier than structuring of sintered ceramics, which has been reported for complex structures for applications with similar demands (Kita et al., 2005; Missal et al., 2011). For the thermocouples, the choice of materials is very limited. In the past years, the application of silver, silver–palladium, and nickel inks have been reported (Markowski et al., 2007). As shown in previ-ous works (Wiegärtner et al., 2015), thermocouples of gold (Au) and platinum (Pt) have led to good results, too. There-fore, for the here-reported initial tests, an Au–Pt combination was selected, using the TC 7102 thick-film paste (Heraeus) for gold and the LPA 88-11 S thick-film paste (Heraeus) for platinum elements.
Prior to printing, four sheets of LTCC tape were laminated for 10 min at 21 MPa and 70◦C. The thermocouples were made of screen-printed gold and platinum layers with a thick-ness of ca. 7 µm and a width of 200 µm. The final form of the sensor was cut out with a frequency tripled Nd:YAG laser and sintered for 30 min at 850◦C.
The design of the sensor disc was supported by FEM anal-yses. The goal was to find how cutouts in the LTCC substrate increase the sensitivity of the sensor. Material data for gold and platinum were taken from Touloukian et al. (1970), data for LTCC were used as determined by Kita et al. (2015). A constant power ofP =1 W was assumed in the area of the sample and the temperature at the outer surface was consid-ered as constant at an intermediate operation temperature of
Figure 2.Initial design of a sensor disc with boundary conditions for modeling with the power of the sampleP and external temper-ature of the furnaceTO.
Figure 3.Sketch of the inner part of the initial setup to test the sensor discs.
To=400◦C. From the temperature increase in the area of the
sample, a thermal resistance was calculated. For modeling, a sensor disc was designed with 33 thermocouples to provide some room for connection. The thermocouples show a radial pattern with some space between the individual paths, as can be seen from Fig. 2.
The complete sensor was produced by alternately stacking eight sensor discs and eight rings made of machined porous aluminosilicate. Gold wires between the discs were sintered to the contact pads by means of gold paste to connect the discs electrically.
2.2 Tests of the single sensor disc and the complete sensor
plemented into a test setup. The stacks were inserted into an isothermal copper block with two bores to ensure a uniform temperature distribution around the stacks. Both stacks were interconnected in a differential method to eliminate additive noise that occurs in both sensors symmetrically. To achieve the differential setup, the signalUSof the sensors was
mea-sured between the positive poles of each stack. In this case, the positive pole is defined as the pole where a voltmeter in-dicates a positive voltage if a cuvette emits heat. The neg-atives of each sensor are connected to form the differential setup. To prevent heat losses through the top and bottom surfaces, additional insulation was applied. The isothermal block was surrounded by insulation material to ensure min-imum disturbances from the surrounding air. In order to test the sensitivity of the sensors, no defined reaction was used but instead a caloric calibration procedure, which is a widely recommended standard in literature, was applied (Barale et al., 2015; Sarge et al., 1994). A Pt1000 was placed freely suspended in the middle of a metal cuvette with mass of 25 g and supplied with different currents by a computer-controlled current source. Through measuring the currentIand the volt-age U, the generated heat P =U×I could be accurately determined. In a typical test program, different power steps from 5×10⁻⁷ to 10−3W were impressed. All leads were made of gold (Ø 100 µm) to limit thermoelectric noise from wiring.
As it was noticed that the time constant of the system de-pends strongly on the mass of the cuvette, a lighter cuvette, made of wrapped and laminated LTCC tapes with an integral heater, was produced according to Brandenburg et al. (2013) for final experiments (see at the end).
3 Results and discussion
3.1 Initial design, FEM modeling, and fabrication of the sensor disc and the sensor
Figure 5 shows modeling results of two discs with 33 ther-mocouples with and without implemented cutouts. As ex-pected, the temperature on the disc drops from the inside to the outside. The resulting temperature gradient is 35.2 K for the disc without cutouts and 68.5 K for the disc with cutouts.
Figure 4.Insulated isothermal copper block with sensors and cu-vettes for testing.USdenotes the sensor signal.
Figure 5.Result for the modeling of the temperature gradient that results when a power ofP =1 W is applied in the middle of the sensor disc and the outer surface is kept at 400◦C. The comparison between the temperatures of the sensor discs without(a)and with cutouts(b)between the 33 thermocouples shows the positive effect of the cutouts.
The thermal resistance is proportional and yields in 35.2 and 68.5 K W−1, i.e., the cutouts almost double the thermal resis-tances. Therefore, cutouts were inserted in the manufactured sensor discs.
Figure 6 shows one sensor disc in its final layout with 34 thermocouples at different production stages. Experiments for contacting the sensor disc had shown that one additional thermocouple fits on the sensor disc. At the bottom of the structure, three pads can be seen: two of them are needed to connect different discs in series, and the additional pad serves to connect a single thermocouple to measure the abso-lute temperature of the sample. Difference in roundness from the vertical to the horizontal diameter were less than 0.1 mm in the sintered structure.
Figure 6.Sensor disc with 34 thermocouples in different produc-tion stages: after screen-printing(a), after laser patterning(b)and the finalized disc after sintering(c).
Figure 7.Finalized sensor stack with eight sensor discs.
3.2 Test of a single disc
Initial tests demonstrated the proper function of the sensor discs in the tested temperature range (Fig. 8). For all tem-peratures, power levels of 0.1 W could be detected. As the Seebeck-coefficient of gold and platinum nearly triples when the temperature increases from room temperature to 600◦C (Gotoh et al., 1991), at 600◦C even the power of 0.01 W in-duces a clearly detectable signal. This measurement series proved the function of the sensor disc up to 600◦C. No
neg-ative effect on mechanical stability was observed.
The two main artifacts (high offset during heating and the temperature dependency of the baseline) can be fully at-tributed to the setup, since at this stage no differential setup was used. The offset is caused by the thermal inertia of the sensor, which induces a temperature gradient that is detected by the sensor disc. The reason for the baseline shift to more negative values as the temperature rises is the increasing heat flow through the leads for the Pt100 and the alumina used for the capillary. Heat flow through the capillary and the wires is proportional to the difference in temperature from the in-ner temperature of the disc to room temperature. An increase of the temperature for the measurement also increases heat losses through the capillary. Hence, it decreases the temper-ature of the sample and increases the magnitude of the base-line shift.
Figure 8.Results of initial tests for a sensor disc at various tem-peratures. The resulting voltage in the sensor disc (Udisc) was
mea-sured dependent on the applied powerP and the furnace tempera-tureTfurnace.
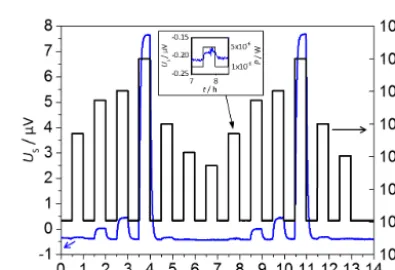
Figure 9.Results for initial tests of the stack. Different power steps P were impressed to the cuvette and the resulting signalUS was
measured.
Since the principle had been proven, the development could proceed to the next step, the test of a fully assembled sensor, the “entire sensor”.
3.3 Test of the entire sensor
Figure 9 shows how an entire sensor stack responds to ap-plied power pulses. The obtained voltage signal Us was
smoothed by a moving average over 50 values. The sampling rate was about 1 Hz. It can be seen that the signal of the sen-sor follows the power impressed into the testing cuvette with a minimum detectable power level of approximately 5 µW. The voltage signal is stable within±0.1 µV during the whole duration of the experiment (14 h). The total noise of the sig-nal is about 25 nVrms. A time constant ofT1/e=181 s can
Figure 10.The drawing(a)shows half of the tube with integrated heating elements after sintering. The picture of the finished cu-vette(b)was taken after the heating elements were contacted with wires and the open ends of the tube closed with lids.
2015). However, the time constants do not only depend on the sensor itself but are also strongly dependent on the used cali-bration device and its mass. It was assumed that the relatively high cuvette mass of 25 g and the poor thermal connection of the freely suspended Pt1000 affect the results.
In literature, a thermal RC circuit is often assumed to de-scribe the calorimeter (Calvet and Prat, 1956; Schönborn, 1983). If the power of the sample follows a step function, then the sensor signal follows Eqs. (1) and (2).
U=P×s×1−eτt
(1)
τ =R×C (2)
In Eqs. (1) and (2),P is the power of the sample, ands
is sensitivity of the sensor, t denotes the time, τ the time constant of the sensor with sample, andR is the thermal re-sistance between the sample and the inner surface of the fur-nace. C stands for the heat capacity of the sensor and the sample. This model is very limited and more complex math-ematical multi-body theories for calorimeters have been de-veloped (Tanaka, 1989; Zielenkiewicz et al., 1985; Saito et al., 1986). However, as they are not applied frequently in practice (Zielenkiewicz, 2004), we will stay with the simple model for explaining the time constant of the sensor.
According to the model, if the mass of the cuvette is in-creased, the heat capacityCincreases and the time constant
τ does, too. The freely suspended Pt1000 in the cuvette in-creases the thermal resistance R of the system, which also has a detrimental effect on the time constant. For determining
protect the heater structure; therefore, the walls have a thick-ness of 250 µm. After the tube is contacted via gold wires and closed with lids (also made of LTCC), the total mass of the cuvette is about 3 g, which is a reduction of 88 % compared to the steel cuvette. According to measurements at LINSEIS Messgeräte GmbH, DuPont 951 has a specific heat capac-ity of 0.73 J (g×K)−1, which results in a heat capacity of the cuvette of 2.19 J K−1. The material of the steel cuvette (V2A) has a mass of 25 g and a specific heat capacity of 0.47 J (g×K)−1 (VDI, 2013). Therefore, the resulting heat capacity is 11.75 J K−1; i.e. the LTCC cuvette reduces heat capacity by 81 %.
In Fig. 11, the signal of the metal and LTCC cuvettes are compared. For better comparability, both signals were compensated for offset and smoothed by a moving average of 50 values. With both cuvettes, a similar signal level was reached; however, with the LTCC cuvette, the response time is much faster. Since the heating resistor is now integrated into the wall of the cuvette, a considerable part of the ther-mal transfer resistance is reduced. Consequently, the delay drops from 11 down to 1 s from the point in time when power was applied to the resistor to the first increase of the sensor response. The time constant decreases to a value of 118 s, which is a reduction of 35 %. It is assumed that this value is very close to the time constant of the ideal sensor without sample.
Figure 12 shows the sensitivity (s) of the sensor as a func-tion of the power (P) that was impressed into the cuvettes.s
was calculated according to Eq. (3).
s=Uss
P , (3)
whereUssstands for the voltage in steady state andPdenotes
the released power of the cuvette.
For the metal cuvette, the measured sensitivity is (7.7±
Figure 11.Impressed powerP into the cuvettes and sensor signal USfor the metal cuvette and for the LTCC cuvette.
Figure 12.Sensitivitys of the sensor for a metal cuvette and an LTCC cuvette when different power levelsP are impressed. The steel cuvette is indicated by asymbol, blue dots denote the LTCC cuvette.
cuvette and one by conduction through the suspending wires. Conduction is proportional to the impressed power. The natu-ral convection, in contrast, becomes nonlinear as the PT1000 has a small volume and its temperature varies strongly over the 3 decades of impressed power. At lower power levels, nat-ural convection is low and a bigger proportion of heat is lost through the wiring. Thus, the measured sensitivity decreases. This is not the case with the LTCC cuvette, as there is no nat-ural convection involved in heat transfer. Therefore, the mea-sured sensitivity is more constant to the impressed power. Additionally, the power is distributed over a bigger volume and the temperature rise of the LTCC cuvette is smaller than that of the Pt1000. Therefore, heat conduction through the wiring is reduced, resulting in an increased measured sensi-tivity to a level of (8.3±0.2) µV mW−1.
4 Conclusion and outlook
Initial steps to develop a new Tian–Calvet calorimeter for operation at elevated temperatures is reported in this study. The initial model showed that reducing the thermal conduc-tion over the sensor disc increases sensitivity. Therefore, a design with 34 thermocouples (gold/platinum) with cutouts between the individual paths was chosen. Experimental data of a single sensor disc up to 600◦C validate the approach, as the sensor exhibited a stable signal and mechanical in-tegrity. The sensitivity of the disc increased with tempera-ture, which is an effect of the increase of the Seebeck coef-ficient with temperature. The complete sensor stack with 8 discs of 34 thermocouples each was built and measurements were conducted at room temperature in a differential setup. The high mass of a metal testing cuvette increased the time constant of the sensor and the freely suspended heating re-sistor, which was used in the tests to apply a defined power, made the sensitivity dependent on the impressed power. With a novel LTCC cuvette with an integrated heater, this depen-dency could be counteracted. The time constant of the system decreased as well. The final setup shows a maximum sensi-tivity of 8.5 µV mW−1 and a time constant ofT1/e=118 s
with a resolution of 5 µW. Sensitivity and time constant of the sensor stack are on the same order of magnitude as for com-mercial sensors. Moreover, the sensitivity strongly increases with temperature.
This work has thereby successfully proven the concept of applying LTCC technology to a Tian–Calvet calorimeter.
Future work will focus on elevated temperature concepts and on increasing the sensitivity of the system, i.e., by in-creasing the number of sensor discs and/or the number of thermocouples on the sensor. Another possibility is to utilize other thermoelectric materials such as nickel, which has been successfully applied to LTCC (Markowski et al., 2007). This may increase the sensitivity by another factor of 3.3.
Acknowledgements. The presented results have been achieved in the scope of the project MST-1304-0003//BAY182/002 “High-Resolution Calorimetric Sensor”, which is funded by the Bavarian Ministry of Economic Affairs and Media, Energy and Technology, VDI/VDE-IT Microsystems Technology Program.
Edited by: Winfried Vonau
Reviewed by: two anonymous referees
References
Auroux, A.: Calorimetry and Thermal Methods in Catalysis, 154, Springer, Berlin, Heidelberg, 2013.
Bäckman, P., Bastos, M., Hallén, D., Lönnbro, P., and Wadsö, I.: Heat conduction calorimeters: time constants, sensitivity and fast titration experiments, J. Biochem. Biophy. Meth., 28, 85–100, doi:10.1016/0165-022X(94)90023-X, 1994.
ramics tape technology for meso-system technology (MsST), Sensor. Actuat. A-Phys., 89, 222–241, doi:10.1016/S0924-4247(00)00554-9, 2001.
Gotoh, M., Hill, K. D., and Murdock, E. G.: A gold/platinum thermocouple reference table, Rev. Sci. Instrum., 62, 2778, doi:10.1063/1.1142213, 1991.
Handy, B. E., Sharma, S. B., Spiewak, B. E., and Dumesic, J. A.: A Tian–Calvet heat-flux microcalorimeter for measurement of differential heats of adsorption, Meas. Sci. Technol., 4, 1350– 1356, doi:10.1088/0957-0233/4/12/007, 1993.
Höhne, G., Hemminger, W., and Flammersheim, H.-J.: Differential scanning calorimetry: An introduction for practitioners, 2nd ed., Springer, Berlin, New York, XII, 298, 2003.
Imanaka, Y.: Multilayered low temperature cofired ceramics (LTCC) technology, Springer, New York, 2005.
Inaba, H., Takahashi, S., Mima, T., and Naito, K.: A high tem-perature Tian–Calvet type calorimeter and an analysis of the baseline fluctuation, J. Chem. Thermodynam., 16, 573–582, doi:10.1016/0021-9614(84)90009-0, 1984.
Jurków, D., Maeder, T., D ˛abrowski, A., Zarnik, M. S., Belaviˇc, D., Bartsch, H., and Müller, J.: Overview on low temperature co-fired ceramic sensors, Sensor. Actuat. A-Phys., 233, 125–146, doi:10.1016/j.sna.2015.05.023, 2015.
Kita, J. and Moos, R.: Development of LTCC-materials and their applications – an overview, Informacije MIDEM, 38, 219–224, 2008.
Kita, J., Rettig, F., Moos, R., Drue, K.-H., and Thust, H.: Hot Plate Gas Sensors-Are Ceramics Better?, Int. J. Appl. Ceram. Tec., 2, 383–389, doi:10.1111/j.1744-7402.2005.02037.x, 2005. Kita, J., Engelbrecht, A., Schubert, F., Groß, A., Rettig, F., and
Moos, R.: Some practical points to consider with respect to ther-mal conductivity and electrical resistivity of ceramic substrates for high-temperature gas sensors, Sensor. Actuat. A-Phys., 213, 541–546, doi:10.1016/j.snb.2015.01.041, 2015.
Kleppa, O. J.: Evolution and application of high-temperature re-action calorimetry at the University of Chicago from 1952 to 2000, J. Alloy. Compd., 321, 153–163, doi:10.1016/S0925-8388(01)00964-1, 2001.
Löblich, K.-R.: On the characteristics of the signal curves of heat flux calorimeters in studies of reaction kinetics, Thermochim. Acta, 231, 7–20, doi:10.1016/0040-6031(94)80002-2, 1994. Lyon, R. E. and Farris, R. J.: Analysis of heat-flux calorimeter
signals, Thermochim. Acta, 161, 287–296, doi:10.1016/0040-6031(90)80310-U, 1990.
2, 1982.
Razouk, R., Hay, B., and Himbert, M.: A new in situ electrical cal-ibration system for high temperature Calvet calorimeters, Rev. Sci. Instrum., 84, 94903, doi:10.1063/1.4821876, 2013. Saito, Y., Saito, K., and Atake, T.: Theoretical analysis of heat-flux
differential scanning calorimetry based on a general model, Ther-mochim. Acta, 99, 299–307, doi:10.1016/0040-6031(86)85292-3, 1986.
Sarge, S. M., Gmelin, E., Höhne, G. W., Cammenga, H. K., Hemminger, W., and Eysel, W.: The caloric calibration of scanning calorimeters, Thermochim. Acta, 247, 129–168, doi:10.1016/0040-6031(94)80118-5, 1994.
Schönborn, K. H.: On the time lag between thermal event and mea-suring signal in a heat flux calorimeter, Thermochim. Acta, 69, 103–114, doi:10.1016/0040-6031(83)85069-2, 1983.
SETARAM Instrumentation: microSC – datasheet, available at: http://www.setaram.com/setaram-products/calorimetry/ microcalorimetry/microsc, 2015.
SETARAM Instrumentation: C80 – specifications, available at: http://www.setaram.com/setaram-products/calorimetry/ calorimetry-calorimetry/c80, 2016.
Tanaka, S.: Linear system theory of a heat conduction calorime-ter, Thermochim. Acta, 141, 181–193, doi:10.1016/0040-6031(89)87053-4, 1989.
Topor, N. D. and Suponitskii, Y. L.: The High-temperature Mi-crocalorimetry of Inorganic Substances, Russ. Chem. Rev., 53, 827–850, doi:10.1070/RC1984v053n09ABEH003127, 1984. Touloukian, Y. S., Powell, R. W., He, J., and Klemens, P. G.:
Ther-mal Conductivity: Metallic Elements and Alloys, Thermophysi-cal Prosperties of Matter, 1, Springer US, Boston, MA, 1970. Verein Deutscher Ingenieure (VDI): VDI-Wärmeatlas, 11th Edn.,
Springer Vieweg, Berlin, 2013.
Wiegärtner, S., Hagen, G., Kita, J., Reitmeier, W., Hien, M., Grass, P., and Moos, R.: Thermoelectric hydrocarbon sensor in thick-film technology for on-board-diagnostics of a diesel oxidation catalyst, Sensor. Actuat. B-Chem., 214, 234–240, doi:10.1016/j.snb.2015.02.083, 2015.
Zielenkiewicz, W.: How do the mathematical models of calorimeters really work?, Thermochim. Acta, 420, 23–27, doi:10.1016/j.tca.2003.09.037, 2004.