R E S E A R C H
Open Access
Multibiometric identification by using ear,
face, and thermal face
Kadir Sercan Bayram
1*and Bülent Bolat
2Abstract
In this work, a secure multibiometric system is proposed. Three different biometric modalities which are ear, face, and thermal face are considered. The face and thermal face data were taken from USTC NVIE Spontaneous Database, whereas the ear data were collected from IIT Delhi Ear Image Database. For each modality, three feature extraction methods are used and four different classifiers (multilayer perceptron, decision tree, support vector machines, and probabilistic neural network) are trained by using two fusion methods which are matching score level and feature level fusion. According to the results, the individual biometrics are better for the identification problem. However, for the validation problem, both fusion methods give better false acceptance rate/false rejection rate values regarding to individual biometrics.
Keywords:Multibiometrics, Matching score-level fusion, Feature-level fusion, Ear, Face, Thermal face
1 Introduction
In today’s conditions, security is an essential concept for many domains such as online or mobile banking and controlled access to certain buildings or rooms. Biometric identification and verification offers a more secure solution for such problems; however, in real applications, single biometrics does not guarantee the ultimate safety [1].
In certain conditions, biometric systems may be tricked by using forged biometric samples such as pho-tographs of faces or irises and artificial fingerprints. Another disadvantage is that, if a biometric system uses only one kind of biometric measurement, it may not be readable or reachable due to physical conditions. For these reasons, the use of multibiometric systems has come to the forefront [2].
In general, systems using biometric features are more secure than encryption systems using passwords, keys, or keycards [3, 4]. Stealing a password or a key is rela-tively easier than copying a biometric sample because a biometric sample is a part of the subject who uses it. On the other hand, a biometric authentication system is not
100% secure. A skillful attacker may gather any person’s biometric samples and can produce forged biometrics.
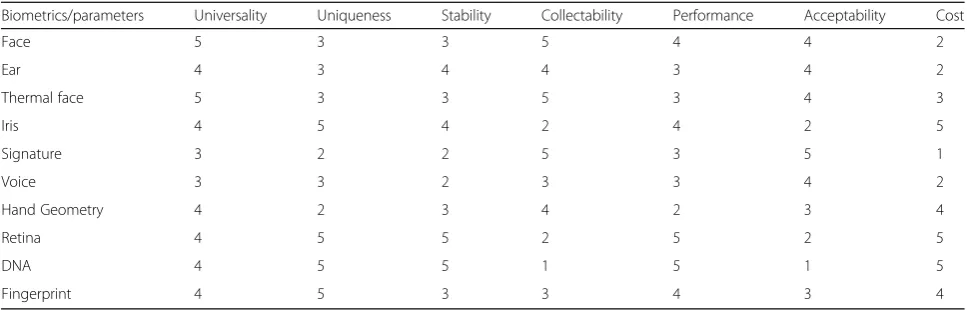
A biometric sample must be universal (most of the population should have it), unique, stable (constant over time), collectible (easy to collect with proper devices), distinct (able to differentiate people from each other), acceptable (should be acceptable for people), and cheap. Table 1 compares the most frequent biometrics regard-ing to these features.
In general, the aim of this paper is to develop a touch-less biometric system with a high accuracy and low cost. To achieve these goals, three biometrics, which are ear, face, and thermal face, are selected from Table 1. Re-garding their scores, these biometrics are better fitting to our problem [5–7].
The organization of the paper as follows. Section 1 proposed the multimodality concept. Section 2 summa-rizes the methods involved in this work. The experimen-tal details and the results are proposed in Section3, and Section4concludes the paper.
1.1 Multimodalities
Multibiometric systems have many advantages over single-biometric systems: First of all, a multibiometric system can work well against class similarities. A multi-biometric system is more robust to noise and more resistant to external system attacks [8, 9]. The basic * Correspondence:[email protected]
1Electrical and Electronics Engineering, Engineering Faculty, Hasan Kalyoncu
University, 27410 Gaziantep, Turkey
Full list of author information is available at the end of the article
definitions of multibiometric systems are as follows. A multimodal system is that receive two or more different biometric characteristics as input with the aid of one or more sensors [10]. A single biometric characterization process using a single sensor is called as multi-algorithm. A multi-algorithm system is a classification process performed by using two or more algorithms [11]. If a system captures more than one example for a single biometric characteristic and uses these multiple copies for classification or identification by using the same algorithm, it is called as multi-instance [7]. If the system has more than one sensor to capture the biomet-rics, it is called as multi-sensor system [12].
1.1.1 Fusion of multimodalities
A typical biometric system has a sensor module, feature extraction module, matcher, and decision module. The information on the output of these modules can be com-bined and used as an input to other modules.
1.1.2 Sensor-level fusion
The purpose of sensor-level fusion is to fuse the same biometric samples coming from different sensors or multiple instances captured by the same sensor [13]. This method gives more information about the
biometric data, but it is still dependent on only one biometric. Figure 1 shows the block diagram of sensor-level fusion.
1.1.3 Feature-level fusion
The feature-level fusion contains the richest information after the sensor-level coalescence. In this method, differ-ent feature extraction algorithms are applied to the same biometric data. Using different feature extraction methods causes a large amount of data; hence, a feature reduction scheme should be necessary to reduce the fea-ture size because of the curse of dimensionality. Figure2 shows the block diagram of feature-level fusion.
1.1.4 Matching score-level fusion
The matching score is generated by a metric based on the similarities between the example in the input of the biometric system and the training samples. If more than one metrics are used, it is possible to fuse their scores [14]. The output values of the metric functions are sim-ple numbers; hence, fusing the matching scores is much easier than the other fusing methods. If the confidence levels of the classifiers are not equal, a normalization of scores is required before fusion [15]. Figure3shows the block diagram of matching score-level fusion.
Table 1Biometrics and parameters (5 high–1 low)
Biometrics/parameters Universality Uniqueness Stability Collectability Performance Acceptability Cost
Face 5 3 3 5 4 4 2
Ear 4 3 4 4 3 4 2
Thermal face 5 3 3 5 3 4 3
Iris 4 5 4 2 4 2 5
Signature 3 2 2 5 3 5 1
Voice 3 3 2 3 3 4 2
Hand Geometry 4 2 3 4 2 3 4
Retina 4 5 5 2 5 2 5
DNA 4 5 5 1 5 1 5
Fingerprint 4 5 3 3 4 3 4
Fig. 2Block diagram of feature-level fusion
Fig. 3Block diagram of matching score-level fusion
1.1.5 Decision-level fusion
Decision-level fusion uses outputs of different classifiers to construct the final decision [16]. In this method, each classifier can use the same biometric data as well as different biometrics and/or features. Similar to the matching score-level fusion, if the confidence levels of classifiers are different, it is possible to use a weighted decision scheme [17]. Figure4 shows the block diagram of decision-level fusion.
2 Methods
In this section, the feature extraction, the feature selec-tion, and the classification methods used in this study are explained briefly.
2.1 Feature extraction methods
In this study, three different methods which are eigen-features, local binary pattern (LBP) eigen-features, and gray-level co-occurrence matrix (GLCM) features were used to extract the features from data.
Mathematically, the principal components of a given set of biometric images characterize the variations of the data [18, 19]. In other words, any image in the set is expressed as a linear combination of principal compo-nents. The number of possible principal components is equal to the number of the images in the set. However, the contribution of some principal components is small enough and negligible. The most dominant components are related to the greatest eigenvalues of the covariance matrix of the image set. Then, the problem reduces to find the eigenvectors of the covariance matrix related to greatestMeigenvalues.
LBP is a fast feature extraction method for images. In this method, a threshold operator is applied to 8-neighborhood
of a selected pixel of the image. The center pixel’s value is used as threshold, and one bit is produced for each neighbor. If the neighbor’s value is larger than the threshold, its value is set to 1, or 0 other-wise. An eight-bit codeword is generated with these eight bits [20].
GLCM is a statistics-based feature extraction method. In this method, repeated gray level patterns are counted and stored in a matrix. For example, if only one direc-tion is considered, an eight-bit gray-level image produces a GLCM size of 256 × 256, which is as large as the original data. Hence, we calculated four features over GLCM which are contrast, correlation, energy, and homogeneity, instead of using the whole matrix.
2.2 Feature selection method
In general, feature selection algorithms are used to re-duce the amount of data and computational cost. On the other hand, it is possible to use a feature selection algorithm to remove the redundant features and to improve the overall accuracy of the problem. In this study a forward selection method is used on the features. The algorithm starts with an empty set of features. Then, the existing features are applied to the classification process one by one. The best resultant feature is determined and added to the feature set and another new feature is determined with the same rule. The selec-tion process is repeated until the increase of success rate is stopped or the maximum allowed number of features is reached.
2.3 Classification methods
In this study four different classifiers, which are multi-layer perceptron, decision tree, support vector machine Table 2Matching score-level fusion with eigenfeatures (#feature 30)
# of feature 30
# of cells in the hidden layer 5 20 40 50 60 70 90
Ear 6.28 88.99 88.05 88.67 65.09 89.62 89.62
Face 17.31 62.67 69.88 77.1 87.32 84.62 79.92
Thermal face 11.06 42.83 50.79 60.87 68.53 71.03 76.11
MS-LF with genetic algorithms 83.25
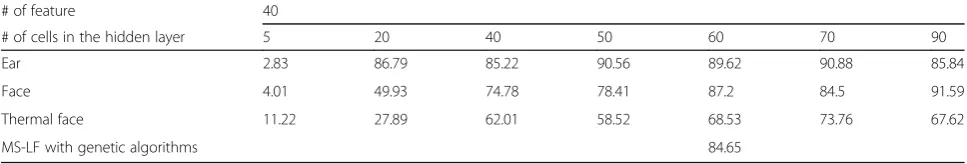
Table 3Matching score-level fusion with eigenfeatures (#feature 40)
# of feature 40
# of cells in the hidden layer 5 20 40 50 60 70 90
Ear 2.83 86.79 85.22 90.56 89.62 90.88 85.84
Face 4.01 49.93 74.78 78.41 87.2 84.5 91.59
Thermal face 11.22 27.89 62.01 58.52 68.53 73.76 67.62
Table 4Matching score-level fusion with eigenfeatures (#feature 50)
# of feature 50
# of cells in the hidden layer 5 20 40 50 60 70 90
Ear 33.96 81.44 89.3 90.25 89.62 90.56 88.05
Face 19 67.5 80.42 81.55 89.83 86.63 90.52
Thermal face 9.02 31.76 66.71 71.79 76.57 72.47 69.82
MS-LF with genetic algorithms 85.87
Table 5Feature-level fusion with eigenfeatures (#feature 30–40–50)
# of feature 30 per each biometrics
# of cells in the hidden layer 5 20 40 50 60 70 90
% 3.78 64.66 83.28 85.8 80.44 80.44 85.8
# of feature 40 per each biometrics
# of cells in the hidden layer 5 20 40 50 60 70 90
% 5.04 81.7 82.64 82.64 82.01 84.22 85.48
# of feature 50 per each biometrics
# of cells in the hidden layer 5 20 40 50 60 70 90
% 5.04 79.81 82.64 76.34 85.17 83.28 86.43
Table 6Matching score-level fusion with DT
Matching score-level fusion
Biometrics Ear Face Thermal face
# of feature 14 10 8 14 10 8 14 10 8
% 78.96 80.37 78.49 75.18 77.48 75.97 76.98 78.70 77.31
MS-LF with GA 78.25
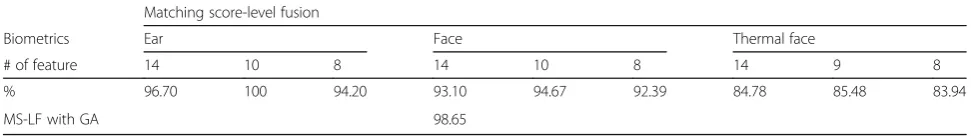
Table 7Matching score-level fusion with SVM
Matching score-level fusion
Biometrics Ear Face Thermal face
# of feature 14 10 8 14 10 8 14 9 8
% 96.70 100 94.20 93.10 94.67 92.39 84.78 85.48 83.94
and probabilistic neural network [19, 21–23], are used for classification. Those methods are used on different levels of fusion process. The success rates as a result of classification operations are given in the experimental results section.
3 Experimental results and discussion
In this study, three different biometric measurements which face, ear and thermal face, are considered to design a secure biometric system. For each modality, three different feature sets were calculated and four different classifiers were utilized. Thus, we tried matching score-level and feature-level fusion to obtain the best configuration.
The face and thermal face data were taken from USTC NVIE Spontaneous Database [24–26], whereas the ear data were collected from IIT Delhi Ear Image Database [27,28]. The dataset was created artificially by combin-ing these two datasets because it is not possible to find a proper dataset for our work. In our dataset, there are 120 individuals. Each person was represented by ten face and ten thermal face images with spatial resolutions of 640 × 480 and 304 × 230 respectively. We added three ear images to each person artificially. Hence, our dataset consists of 2760 biometric measurements assigned to 120 individuals.
Since the eigenfeatures come from principal component analysis and selecting lesser eigenvectors reduces the size of data, there is no need to use any feature selection process on this part of the data. In the first stage of the ex-periments, only the eigenfeatures were considered. To find better accuracy, different sizes of eigenfeatures were calcu-lated and processed by classifiers. Then, the experiments were repeated by using LBP and GLCM. For these two feature sets, the most distinctive features were determined by using forward selection. All experiments were repeated ten times by using randomly selected training and test sets, and the results were averaged.
In the first step, data were divided into training (70%) and testing (30%) sets randomly for different numbers of eigenfeatures. Then, one multilayer perceptron (MLP) was trained for each biometric to obtain a matching score. In the matching score-level fusion, output scores of the classifiers were combined by using a genetic algo-rithm (GA). Tables2,3, and4summarize the results for this step. In this step, the optimum hidden layer size of MLP was found by a trial by error scheme (Tables 2,3, and 4). Table5 shows the feature-level fusion scores by using eigenfeatures and MLP. In this step, equal num-bers of eigenfeatures were calculated for each biometric and then merged to construct the dataset. A single MLP fed by these data for training and testing.
Secondly, LBP and gray level co-occurrence matrix features were combined. Decision tree (DT) and linear support vector machines (SVM) and probabilistic neural network (PNN) algorithms were used as classifiers. Simi-lar to the first step of the experiments, both matching level and feature-level fusions operated on the data. To increase the accuracy of the system, a forward selection process was applied for each classification.
Tables 6, 7, and 8 show the matching score-level fu-sion results for three classifiers.
In the last part of the study, we evaluated feature-level fusion by using three classifiers. Tables 9 and 10 summarize the result of feature-level fusion experiments.
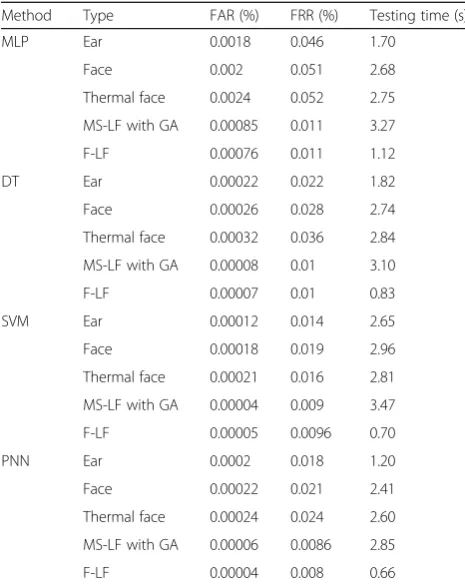
Finally, we evaluated the whole problem as an identifi-cation task. In this last step, the classifiers were trained for every individual separately to obtain the false accept-ance rate (FAR) and false rejection rate (FRR). FAR, FRR, and testing times of each biometry and fusion types are given in Table11[8]. All the experiments were real-ized, and a personnel computer has a processor of Intel Core i5-5200U 2.20 Ghz and 8Gb of RAM.
According to the results given above, ear is the most de-cisive biometric among the others. By using LCM + GLCM, SVM classified the entire data perfectly. By comparing
Table 9Feature-level fusion with DT
# of feature per each biometrics 14 10 8 5
% 79.33 83.45 77.40 69.86
Table 10Feature-level fusion with PNN
# of feature per each biometrics 14 12 10 7
% 94.35 94.46 96.34 91.80
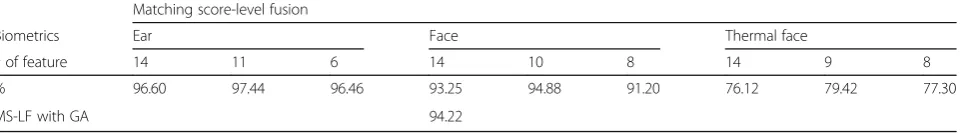
Table 8Matching score-level fusion with PNN
Matching score-level fusion
Biometrics Ear Face Thermal face
# of feature 14 11 6 14 10 8 14 9 8
% 96.60 97.44 96.46 93.25 94.88 91.20 76.12 79.42 77.30
Tables 2, 3, 4, and 5, one should claim that feature-level fusing gives slightly better results than matching score-level fusion for eigenfeatures and MLP. When LBP and GLCM are used as features, DT and PNN produces similar results. However, when SVM is con-sidered, matching score fusion produced a better re-sult than feature-level fusion.
When Table 11 is interpreted, FAR and FRR rates of both fusion methods are better than simple biometrics. MLP, DT, and PNN produced slightly better FAR/FRR values with feature-level fusion, whereas SVM gave bet-ter results with matching score level. However, the dif-ferences between the fusion methods are very small; hence, it is not easy to prefer one to other.
4 Conclusions
In this work, a multibiometric system is proposed. Three different biometric modalities were considered. For each modality, three feature extraction methods were used and four different classifiers were trained. Two fusion methods were utilized, and the results were discussed. According to our results, if the problem is considered as an identification problem, using the ear only gives the best result. For the identification problem, none of the
considered fusion methods improved the results. How-ever, when it is interpreted as a validation problem, both fusion methods gave better FAR/FRR values regarding to individual biometrics. SVM with matching level fusion also gave the best classification performance as 98.65%.
Abbreviations
DT:Decision tree; FAR: False acceptance rate; F-LF: Feature-level fusion; FRR: False rejection rate; GA: Genetic algorithms; LBP: Local binary pattern; MLP: Multilayer perceptron; MS-LF: Matching score-level fusion; PCA: Principal component analysis; PNN: Probabilistic neural network; SVM: Support vector machines
Availability of data and materials All data are fully available without restriction.
Authors’contributions
KSB implemented the algorithm and drafted the manuscript. BB reviewed and edited the manuscript. Both authors discussed the results and implications, commented on the manuscript at all stages, and approved the final version.
Authors’information Author 1
Kadir Sercan Bayram received his BS degree in Electronics and
Communication Engineering from Halic University, Istanbul, Turkey, in 2009, and the MS degree in Electronics and Communication Engineering from Halic University, Istanbul, Turkey, in 2011. He is on thesis phase (Electronics and Communication Engineering) in PhD degree from Yildiz Technical University, Istanbul, Turkey. He is a lecturer at Hasan Kalyoncu University, Gaziantep, Turkey.
Contact: [email protected] Author 2
Bülent Bolat received his BS degree in Electronics and Communication Engineering from Yildiz Technical University, Istanbul, Turkey, in 1996, the MS degree in Electronics and Communication Engineering from Yildiz Technical University, Istanbul, Turkey, in 1998, and the PhD degree in Electronics and Communication Engineering from Yildiz Technical University, Istanbul, Turkey, in 2006. He is an Assist. Prof. Dr. at Yildiz Technical University. Contact: [email protected]
Competing interests
The authors declare that they have no competing interests.
Publisher’s Note
Springer Nature remains neutral with regard to jurisdictional claims in published maps and institutional affiliations.
Author details
1Electrical and Electronics Engineering, Engineering Faculty, Hasan Kalyoncu
University, 27410 Gaziantep, Turkey.2Electronics and Communications Engineering, Faculty of Electrical and Electronics Engineering, Yildiz Technical University, 34220 Istanbul, Turkey.
Received: 5 March 2018 Accepted: 27 April 2018
References
1. E Çelik, Recognition of palmprint based on image processing with artificial neural network reliable, Marmara University, 2011.
2. P Moutafis, IA Kakadiaris, IEEE Int. Symp. Technol. Homel. Secur. HST
2015, 2015 (2015)
3. S Filiz, Biometric Systems in Cyber Security and Face Recognition, Gazi University, 2013.
4. B Kashyap, KJ Satao, Int. J. Adv. Res. Comput. Commun. Eng.
4, 376 (2015)
5. A Vora, C Paunwala, M Paunwala,3, 911 (2015).
6. K Delac, M Grgic, 46th Int. SyrnPoSium Electron. Mar. ELMAR-2004
46, 184 (2004) Table 11FAR, FRR, and testing time results for each method
used in the experiments
Method Type FAR (%) FRR (%) Testing time (s)
MLP Ear 0.0018 0.046 1.70
Face 0.002 0.051 2.68
Thermal face 0.0024 0.052 2.75
MS-LF with GA 0.00085 0.011 3.27
F-LF 0.00076 0.011 1.12
DT Ear 0.00022 0.022 1.82
Face 0.00026 0.028 2.74
Thermal face 0.00032 0.036 2.84
MS-LF with GA 0.00008 0.01 3.10
F-LF 0.00007 0.01 0.83
SVM Ear 0.00012 0.014 2.65
Face 0.00018 0.019 2.96
Thermal face 0.00021 0.016 2.81
MS-LF with GA 0.00004 0.009 3.47
F-LF 0.00005 0.0096 0.70
PNN Ear 0.0002 0.018 1.20
Face 0.00022 0.021 2.41
Thermal face 0.00024 0.024 2.60
MS-LF with GA 0.00006 0.0086 2.85
7. AK Jain, A Ross, S Prabhakar, IEEE Trans. Circuits Syst. Video Technol.
14, 4 (2004)
8. S Kalra, A Lambda, Int. J. Comput. Sci. Inf. Technol.5(2), 2148 (2014) 9. M Pathak, N Srinivasu, Int. J. Inven. Eng. Sci.3, 8 (2015)
10. A Gambhir, S Narke, S Borhade, G Bokade,4, 725 (2014).
11. R Connaughton, A Sgroi, K Bowyer, PJ Flynn, IEEE Trans. Inf. Forensics Secur.
7, 919 (2012)
12. Q Qu, X He, W Zhang, 6th Int. Conf. Meas. Instrum. Autom. (ICMIA 2017)
154, 228 (2017)
13. W Elmenreich, An introduction to sensor fusion (2002). 14. AK Jain, S Prabhakar, S Chen, Pattern Recogn. Lett.20, 1371 (1999) 15. AM Hamad, RS Elhadary, AO Elkhateeb, Int. J. Inf. Sci. Intell. Syst.
3, 53 (2014)
16. YA Zuev, SK Ivanov, J. Frankl. Inst.336, 361 (1999)
17. M Ghayoumi, IEEE/ACIS 14th Int. Conf. Comput. Inf. Sci.131, 2015 (2015) 18. KRL Reddy, GR Babu, L Kishore, Procedia Comput. Sci.22, 62 (2010) 19. M Turk, AP Pentland, in IEEE Conf. Comput. Vis. Pattern Recognit. (1991). 20. The MathWorks Inc; 2018.https://www.mathworks.com/help/vision/ref/
extractlbpfeatures.html.
21. KZ Mao, KC Tan, W Ser, IEEE Trans. Neural Netw.11, 1009 (2000) 22. A Pradhan, Int. J. Emerg. Technol. Adv. Eng.2, 82 (2012)
23. SR Safavian, D Landgrebe, IEEE Trans. Syst. Man. Cybern.21, 660 (1991) 24. S Wang, Z Liu, S Lv, Y Lv, G Wu, P Peng, F Chen, X Wang, IEEE Trans.
Multimed.12, 682 (2010)
25. Y Tong, Y Wang, Z Zhu, Q Ji, Pattern Recogn.40, 3195 (2007)
26. Y Lv, S Wang, P Shen, in Proc. Third Int. Conf. Internet Multimed. Comput. Serv. - ICIMCS’11 (2011), p. 170.
27. IIT Delhi Ear Database. 2017. http://www.comp.polyu.edu.hk/~csajaykr/IITD/ Database_Ear.htm.