O R I G I N A L R E S E A R C H
Aberrant Expression of Citrate Synthase is Linked
to Disease Progression and Clinical Outcome in
Prostate Cancer
This article was published in the following Dove Press journal: Cancer Management and Research
Zhiduan Cai,1,* Yulin Deng,1,*
Jianheng Ye,2Yangjia Zhuo,3
Zezhen Liu,2Yingke Liang,3Hui
Zhang,3Xuejin Zhu,2Yong
Luo,3Yuanfa Feng,4Ren Liu,2
Guo Chen, 5Yongding Wu,3
Zhaodong Han,3Yuxiang
Liang,3Funeng Jiang,3Weide
Zhong 1–4,6
1Guangdong Provincial Institute of
Nephrology, Nanfang Hospital, Southern Medical University, Guangzhou 510515, People’s Republic of China;2Department of
Urology, Guangdong Key Laboratory of Clinical Molecular Medicine and Diagnostics, Guangzhou First People’s Hospital, Guangzhou Medical University, Guangzhou 510180, People’s Republic of China;
3Department of Urology, Guangdong Key
Laboratory of Clinical Molecular Medicine and Diagnostics, Guangzhou First People’s Hospital, School of Medicine, South China University of Technology, Guangzhou 510180, People’s Republic of China;
4Urology Key Laboratory of Guangdong
Province, The First Affiliated Hospital of Guangzhou Medical University, Guangzhou Medical University, Guangzhou 510230, People’s Republic of China;5Department of
Urology, The First Affiliated Hospital of Jinan University, Guangzhou, Guangdong 510632, People’s Republic of China;6School of
Medicine, Jinan University, Guangzhou, Guangdong 510632, People’s Republic of China
*These authors contributed equally to this work
Purpose:Citrate synthase (CS) is a rate-limiting enzyme in the citrate cycle and is capable of catalyzing oxaloacetate and acetyl-CoA to citrate. CS has been uncovered to be upregu-lated in a variety of cancers, and its expression and clinical significance in prostate cancer (PCa) remain unknown.
Methods: In this study, we examined the association between CS expression level and
clinicopathological features of prostate cancer patients in a TMA cohort and the public cancer database (The Cancer Genome Atlas-Prostate Adenocarcinoma, TCGA-PRAD). The CS knock-down cell lines were constructed to study the effects of CS knock-downregulation on proliferation, colony formation, migration, invasion, and cell cycle of prostate cancer cells in vitro. And the effect of CS downregulation on tumor growth in mice was studied in vivo. In addition, the metabolomics and mitochondrial function were detected in the CS knockdown cell lines.
Results: CS expression level in PCa tissues was higher than that in normal tissues (P< 0.05). CS upregulation was significantly associated with high Gleason score (P < 0.05), advanced pathological stage (P < 0.001), and biochemical recurrence (P < 0.001). Functionally, decreased expression of CS inhibited PCa cell proliferation, colony formation, migration, invasion and cell cycle in vitro, and inhibited tumor growth in vivo. In addition, CS downregulation exerted potential inhibitory effects on the lipid metabolism and mito-chondrial function of PCa cells.
Conclusion:In conclusion, thesefindings suggested that CS upregulation may contribute to the aggressive progression and poor prognosis of PCa patients, which might be partially associated with its influences on the cell lipid metabolism and mitochondrial function.
Keywords:prostate cancer, citrate synthase, prognosis, lipid metabolism
Introduction
Prostate cancer (PCa) is the most common cancer and the major cause of cancer-related death among men in 46 countries around the world.1Based on the latest cancer statistics, there would be 174,650 new PCa patients and 31,620 PCa associated deaths in the United States in 2019, ranking first in male cancer incidence and second in male cancer mortality.2Due to the decreased use of PSA (Prostate-Specific Antigen) screening, the overall incidence rate of PCa has declined in the last few years, which may mask the occurrence of the advanced PCa and lead to the stabilization of PCa mortality following the decline of these years.3Therefore, it is a great challenge to identify potential diagnostic markers and therapeutic targets for PCa.
Correspondence: Weide Zhong Guangdong Provincial Institute of Nephrology, Nanfang Hospital, Southern Medical University, Guangzhou 510515, People’s Republic of China
Email zhongwd2009@live.cn
Cancer Management and Research
Dove
press
open access to scientific and medical research
Open Access Full Text Article
Cancer Management and Research downloaded from https://www.dovepress.com/ by 118.70.13.36 on 27-Aug-2020
Dysregulation of metabolism has been revealed to be linked with carcinogenesis and the progression of PCa. Normal prostate cells accumulate zinc, as well as inhibit the oxidation of citric acid and the metabolism of the tricarboxylic acid (TCA) cycle.4 In particular, epithelial cells in the normal peripheral zone of the prostate are set to produce citric acid and inhibit the oxidation of citric acid.5,6 In contrast, PCa cells actively oxidize citric acid and restore the classic TCA cycle function.4Thus, under-standing the metabolic differences between noncancer and cancer cells of the prostate may be of clinical significance to identify novel diagnostic and therapeutic targets for PCa patients.
The TCA cycle, also known as the citric acid cycle or the Krebs cycle, is a sequence of chemical reactions that release stored energy by oxidative conversion of acetyl-CoA into adenosine triphosphate (ATP) and carbon diox-ide. Citrate synthase (CS), present in almost all living cells, functions as a limiting velocity enzyme in the first step of the CAC cycle.7Accumulating studies have indi-cated that CS activity may be involved in various cancers.8–10
In PCa, Mycielska et al reported that PC-3M cells metabolized citric acid in the cytoplasm by aconitase and fatty acid synthase to heighten their metastatic behavior.11 CS has been shown to be upregulated in prostate circulating tumor cells (CTCs), while other enzymes in the TCA cycle were not elevated.12 However, the expression pattern of CS and its roles in prostate carcinogenesis, progression, and prognosis remained unknown. To solve this problem, we examined the association between CS expression level and clinico-pathological features of prostate cancer patients in a TMA cohort and the public cancer database (The Cancer Genome Atlas-Prostate Adenocarcinoma, TCGA-PRAD). The CS knockdown cell lines were constructed to study the effects of CS downregulation on prolifera-tion, colony formaprolifera-tion, migraprolifera-tion, invasion, cell cycle of prostate cancer cells in vitro. And the effect of CS down-regulation on tumor growth in mice was studied in vivo. In addition, the metabolomics and mitochondrial function were detected in the CS knockdown cell lines.
Materials and Methods
Patients and Tissues
PCa tissue microarray (TMA; Creative Bioarray, USA; Cat. No: PRTMA053), which included 71 cases of
prostate adenocarcinoma, 2 prostate leiomyosarcoma, 1 prostate hyperplasia and 6 normal prostate tissues, was used for immunohistochemistry analysis. The TMA con-tained patients’age, Gleason score, Gleason grade, TNM (Tumor Node Metastasis), clinical stage, and pathology grade. No chemotherapy or radiotherapy was given to the patient prior to surgery. Detail informations of the TMA cohort were provided inSupplementary Material. A total of 498 PCa tissues and paired clinical data from the public database (TCGA-PRAD, The Cancer Genome Atlas-Prostate Adenocarcinoma:https://www.cancer.gov/ tcga) were used to evaluate the associations between CS expression level and patients’ clinical-pathological fea-tures of PCa patients.
Cell Line Culture
The human PCa cell lines DU145 and PC3 were obtained from American Type Culture Collection (ATCC, USA) and respectively cultured in Dulbecco’s Modified Eagle Medium (DMEM; Gibco, USA; Cat. No: C11965500BT) and Roswell Park Memorial Institute (RPMI) 1640 med-ium (Gibco, USA; Cat. No: C11875500BT) which were added with 10% fetal bovine serum (FBS; Gibco, USA; Cat.10270–106), 0.1mg/mL streptomycin and 100U/mL penicillin (Gibco, USA; Cat. No: 15,140–122). The cells were placed in a wettish incubator containing 5% CO2at 37°C. A lentivirus containing the short hairpin RNA of CS or control vector (HYY, China) was used to establish the CS knockdown (CS-sh) cell line or negative control (CT) cell line. The DU145 and PC3 cell lines were infected with the lentivirus and infection agent Polybrene (Santa Cruz, USA; Cat. No: sc-134,220). The stable cell lines were selected through puromycin screening (3 μg/mL) two days after transfection.
Immunohistochemistry
The protein expression levels of CS in PCa and normal prostate tissues were examined by IHC based in our TMA cohort according to the protocol of our previous report.13,14 The immunostaining was obtained using the IHC kit (UltraSensitive™ SP, MX Biotechnologies, China; Cat. No: KIT-9730) based on the manufacturer’s instructions. Rabbit anti-CS (1: 100) were obtained from Boster company (China; Cat. No: BM5202,). The percen-tage of positively stained cells was calculated and
classi-fied as zero (0–5%), one (6–25%), two (26–50%), three (51–75%), and four (76–100%). The intensity of staining was categorized as zero (negative), one (weak), two
Cancer Management and Research downloaded from https://www.dovepress.com/ by 118.70.13.36 on 27-Aug-2020
(moderate), and three (strong). The immunoreactivity score (IRS) was calculated by multiplying the staining percentage and intensity score.
Western Blot Assay
CS protein expression levels in the PCa CT cells and CS-sh cells were examined by Western blot assay based on our previous report.13,14 A rabbit anti-CS primary antibody (Boster company, China; Cat. No: BM5202,) was used to detect CS expression level, and a mouse anti-β-actin pri-mary antibody (Boster company, China; Cat. No: BM0627) was used as a control. The results were visua-lized with the PXi 9 chemiluminescent detection system (Syngene, England) and analyzed by using ImageJ 1.52a (Wayne Rasband, USA).
RT-qPCR Assay
Total RNA was isolated from prostate tissues by RNeasy mini kit (QIAGEN, Germany; Cat. No: 74,104) and reverse transcripted with RT reagent kit (TaKaRa, Japan; Cat. NR037A). Then the cDNA products were used for real-time PCR with the Fast SYBR® Green Master Mix (Life technology, USA; Cat. No: 4,385,610). The primers were as follows: CS forward, 5ʹ- CCCTTTCCGACC CTTACCTG; CS reverse, 5ʹ- CTGGAACAACCCGTC CTGAG; β-actin forward, 5ʹ- AGCGAGCATCCCCCA AAGTT; β-actin reverse, 5ʹ- GGGCACGAAGGCT CATCATT. The β-actin mRNA expression level was used as a control for normalization. The results were analyzed using the comparative cycle threshold method.
Cell Proliferation Assay
Cell Counting Kit-8 (Meilunbio, China; Cat. No: MA0218-5000) was used to test the cell proliferation. The 96-well plate was seeded with 2000 PCa CT cells or CS-sh cells per well. 10μL CCK-8 solution was added to each well at 5 time points respectively (4, 24, 48, 72 and 96h). The plate was placed in the incubator for 2 hours at 37°C. The absorbance of the medium at 450 nm was detected by a microplate reader (Bio-Rad, USA) every day.
Colony Formation Assay
500 PCa CT cells or CS-sh cells per well was seeded in the 6-well plate. Cells were cultured with the normal medium for two weeks. The medium was replaced every two days. Then the cells were fixed and stained with 0.1% crystal violet at room temperature for half an hour. The results
were photographed with a camera, and the number of colonies was counted.
Cell Migration and Invasion Assays
The PCa CT cells or CS-sh cells was seeded in the 6-well plate and reached approximately 90% confluence for migration assay. After treated with medium without FBS for 24 hours, a 200μL sterile pipette tip was used to make scratches on each well. Photos were taken every 12 hours to observe the healing of scratches using a microscope camera. The scratch healing area was calculated using ImageJ. For invasion assay, 100 μL/well Matrigel (BD Biosciences, USA; Cat. No: 354,234) was coated into the upper compartment of the chamber, which was placed into the 24-well plate (Corning, USA; Cat. No: 3422). The upper compartment of the chamber was seeded with 5 x 10⁴ cells suspended in 100 μL serum-free medium. The lower chamber was added with 500μL normal med-ium containing 10% FBS. After incubation for 24 hours, the cells on the upper side of the membrane were removed with a cotton swab. The membrane was fixed with 4% paraformaldehyde and dyed with 0.1% crystal violet at room temperature for half an hour. The photos of the invading cells were taken by the microscope camera and counted the cells of five random fields. The experiment was repeated three times.
Cell Cycle Assay
PCa CT cells or CS-sh cells was seeded in the 6-well plate and reached approximately 70–80% confluence for the cell cycle assay. The cells were collected and fixed in 70% ethyl alcohol at−20 °C all-night. Then the cells were resuspended in phosphate-buffered saline (PBS), which contained 20 μg/mL PI, 200 μg/mL RNaseA, and 0.1% Triton X-100. The suspension was incubated in a dark place for half an hour at 4 °C. Flow cytometer (BD FACSVerse, BD Biosciences, USA) was used to analyze the cell cycle. Each test was conducted three times.
Xenograft Model
The animal experiment was conducted based on the Guide for the Care and Use of Laboratory Animals and in compliance with the guidelines of the Institute for Laboratory Animal Research at Guangzhou Medical University (Guangzhou, China). This research project has been reviewed and approved by Institutional Animal Care and Use Committee of Guangzhou
Cancer Management and Research downloaded from https://www.dovepress.com/ by 118.70.13.36 on 27-Aug-2020
Medical University. The PCa CT cells and CS-sh cells were collected and suspended in the medium mixed with Matrigel (1: 1; BD Biosciences, USA; Cat. No: 354,234). The cells (5 x 10⁶cells/100 μL) were injected into both sides of the flanks of 6 nude male mice subcutaneously (Left: CT cells; Right: CS-sh cells), which were 4–6 weeks old (Experimental Animal Center of Sun Yat-sen University, China). The mice’s weight and the tumor size were measured every three days. The tumor volume was calculated as follow: V = length x width2 x 1/2. The tumors were harvested after the mice were euthanized by CO2 suffocation.
Metabolite Assay
107of PCa cells were collected and extracted by extrac-tion solvent according to the protocol of the BioTree Company (Shanghai, China). The extracts were used for metabolic assay (ultra-performance liquid-chromatography tandem mass spectrometry, UHPLC-MS/MS). The UHPLC-MS/MS assay was conducted with a UHPLC system (1290, Agilent Technologies, USA). The levels of cell metabolites were quantified according to the standard curves. The results were reported by relative values. Detail informations of proto-col were provided inSupplementary Material.
MitoTracker Assay
The PCa CT cells or CS-sh cells were seeded into the 6-well plates. MitoTracker® Red CMXRos probe (100 nM; Invitrogen, USA; Cat. No: M7512) was added into the medium when cells reached 30–40% confluency and incubated for half an hour at 37 °C. Then, Hoechst 33,342 staining solution was added into the medium for nuclear staining of living cells and incubated for 10 minutes at 37 °C. The staining solution was substituted for PBS, and the cells were observed using afluorescence microscope. For
flow cytometry, the cells were resuspended in PBS and subjected to BD FACSVerse after the staining was completed.
Seahorse Assay
PCa CT cells or CS-sh cells were seeded in an XFe24 cell culture microplate. The mitochondrial function was deter-mined by measuring the oxygen consumption rate of each cell line using the XFe24 Cell Mito Stress Test Kit (Agilent Technologies) according to the protocol of a previous study.15 The source of ATP was analyzed using The XF ATP Rate Assay (Agilent 103,592–100),
according to the protocol of a previous study.16 The Seahorse assay was run in XFe24 Extracellular Flux Analyzer (Agilent Technologies). The results were ana-lyzed using the Wave program 2.6.0 (Seahorse Bioscience).
Statistical Analyses
Continuous variables were shown as means ± SD. All statistical analyses were performed by IBM SPSS Statistics 20 (SPSS Inc, USA) and GraphPad Prism 7 (GraphPad Software, USA) in the current study. The sta-tistical significance of quantitative data was analyzed by Student’s t-test or analysis of variance (ANOVA). The Kaplan–Meier method or Cox proportional hazards regres-sion model were used for survival analysis. P< 0.05 was regarded as statistically significant.
Results
Overexpression of CS Protein and
mRNA in Human PCa Tissues
The expression levels of CS protein and mRNA in PCa and normal prostate tissues were examined by IHC, WB and RT-qPCR assay. As shown in Figure 1A–D, CS protein was mainly expressed in the PCa cells and its expression level in PCa tissues was higher than that in normal prostate tissues significantly (IRS: PCa = 5.63 ± 3.22 vs Normal = 2.67 ± 2.07, P = 0.031; Figure 1E). High expression level of CS protein in PCa tissues was significantly associated with high Gleason score (IRS: GS ≥ 7 = 6.38 ± 3.12 vs GS < 7 =4.17 ± 1.95, P = 0.005; Figure 1F). In addition, the protein and mRNA expression level of CS were detected in our collected prostate cancer and adjacent normal tissues using WB and RT-qPCR assay. The results showed that the CS protein and mRNA levels of PCa tissues were higher than those in normal tissues (P = 0.033,Figure S1A; P< 0.001, Figure S1B). Also, the analysis results of TCGA-PRAD data showed that the CS mRNA expression of PCa tissues was higher than that in the adjacent normal tissue (Table 1).
CS Overexpression is Associated with
Aggressive Progression and Poor
Prognosis of PCa Patients
The associations between CS expression level and clinical-pathological parameters of PCa patients based in our TMA data and TCGA-PRAD database were shown in Table 1.
Cancer Management and Research downloaded from https://www.dovepress.com/ by 118.70.13.36 on 27-Aug-2020
Figure 1Overexpression of CS protein in human PCa tissues, and its prognostic value. (A) Overall view of CS immunostainings in 80 prostate samples of TMA which consists of 71 cases of prostate adenocarcinoma, 2 prostate leiomyosarcoma, 1 prostate hyperplasia and 6 normal prostate tissues. (B–D) Immunostainings of CS protein in normal prostate tissues, PCa tissues with low Gleason score (GS< 7), and high Gleason score (GS≥7), respectively. (E) The histogram showed the IHC scores of CS expression in normal prostate and PCa tissues. (F) IHC scores of CS expression in PCa tissues with GS< 7 and GS≥7. (G–H) The Kaplan–Meier curves of BCR-free survival and overall survival between CS low and high expression groups of TCGA-PRAD patients stratified by the median of CS expression level. The risk tables were provided below the curves. *P< 0.05, **P< 0.01.
Abbreviations:CS, citrate synthesis; PCa, prostate cancer; TMA, tissue microarray; IHC, immunohistochemistry; TCGA-PRAD, The Cancer Genome Atlas-Prostate Adenocarcinoma; BCR, biochemical recurrence; HR, hazard ratio.
Cancer Management and Research downloaded from https://www.dovepress.com/ by 118.70.13.36 on 27-Aug-2020
The expression level of CS in PCa tissues was signifi -cantly associated with high Gleason score (for IHC data:
P = 0.005, for TCGA-PRAD data:P = 0.020, Table S1), advanced pathological stage (for TCGA-PRAD data: P < 0.001) and positive biochemical recurrence (BCR; for TCGA-PRAD data:P< 0.001).
The survival analysis was performed in the TCGA-PRAD database in order to assess the prognostic value of CS expression in patients with PCa. The median expression level of CS in PCa tissues was used as a demarcation point to divide the patients into high CS expression group and low CS expression group. As shown in Figure 1G, patients with high CS expres-sion had shorter BCR-free survival than patients with low CS expression (P = 0.006; hazard ratio = 2.184, 95% confidence interval: 1.273 to 3.745). However, no significant difference was observed (P = 0.288; Figure 1H; hazard ratio = 1.935, 95% confidence inter-val: 0.554 to 6.751).
CS Knockdown Inhibits PCa Cell
Proliferation, Cell Colony Formation, Cell
Migration, Cell Invasion and Cell Cycle
in vitro
In a previous study, CS mRNA expression level was found to upregulate in the CTCs of CRPC (Castration Resistant Prostate Cancer) patients.12Therefore, to explore the role of CS in PCa in vitro, we established the CS knockdown stable PCa cell lines DU145 and PC3, using a lentivirus vector containing shRNA of CS (CT, CS-sh). The knockdown efficiency was detected by Western blot and RT-qPCR assay (Figure 2A and Figure S2). CCK-8 assay indicated that the reduced expression of CS protein suppressed the cell proliferation of both DU145 cells and PC3 cells (for DU145 96h: P = 0.004, for PC3 96h: P < 0.001; Figure 2B). The colony formation assay also demonstrated that the colony formation abilities of CS knockdown PCa cells were diminished compared with those of the CT group
Table 1Association of CS with Clinicopathological Characteristics of PCa in TMA and TCGA-PRAD Dataset
Clinical Features CS Expression in TMA CS Expression in TCGA-PRAD Dataset
n Means ± SD P n Means ± SD P
CS expression
Normal 6 2.67±2.07 0.031 52 2944±512 < 0.001
Cancer 67* 5.63±3.22 498 3529±787
Age
<65years 22 6.14±2.90 0.369 331 3496±786 0.160
≥65years 45 5.38±3.37 166 3601±782
Gleason score#
<7 12 4.17±1.95 0.005 44 3268±695 0.020
≥7 50 6.38±3.12 453 3556±790
Pathological stage
<T3A 39 5.15±3.29 0.157 186 3342±618 < 0.001
≥T3A 28 6.29±3.05 304 3652±852
Metastasis
No 42 5.17±2.95 0.130 416 3510±786 0.242
Yes 25 6.40±3.55 82 3622±787
Overall survival
Alive - - - 487 3526±785 0.295
Die - - 10 3789±816
PSA failure
Negative - - - 370 3464±760 < 0.001
Positive - - 59 3847±738
Notes:-Lack of relative information of patients in the cohort; *4 cases of prostate adenocarcinoma tissue dropped off during the immunohistochemistry experiment;# 5 cases of prostate adenocarcinoma tissue had no Gleason score.
Abbreviations:CS, citrate synthesis; PCa, prostate cancer; TMA, tissue microarray; TCGA-PRAD, The Cancer Genome Atlas-Prostate Adenocarcinoma; SD, standard deviation; PSA, prostate-specific antigen.
Cancer Management and Research downloaded from https://www.dovepress.com/ by 118.70.13.36 on 27-Aug-2020
significantly (for DU145: P= 0.003; for PC3: P = 0.004; Figure 2C and D). Both the cell migration and invasion assays indicated that the reduced expression of CS protein
suppressed the migration and invasion of DU145 and PC3 cells (for DU145:PMigration = 0.001,PInvasion< 0.001; for PC3: PMigration = 0.020, PInvasion = 0.001; Figure 2E–H). Figure 2Decreased expression of CS inhibited cell proliferation, cell invasion, and migration of PCa cells in vitro. (A) Expression levels of CS protein in DU145 and PC3 cell lines, which were transfected with CS-shRNA and negative control vector and verified through Western blot assay. (B–D) The proliferation was detected through growth curves and colony formation in DU145 and PC3 cells with CS knockdown and negative control (CT) vector. (E–F) The migration was examined by wound healing percentage in CT and CS-sh group cells of DU145 and PC3. The Red lines refer to the edge of the cells. (G–H) The invasion was analyzed using the Transwell experiment in CT and CS-sh group cells of DU145 and PC3. The matrigel was added to the upper chamber. *P< 0.05, **P< 0.01.
Abbreviations:CS, citrate synthesis; PCa, prostate cancer; sh, short hairpin; CT, control.
Cancer Management and Research downloaded from https://www.dovepress.com/ by 118.70.13.36 on 27-Aug-2020
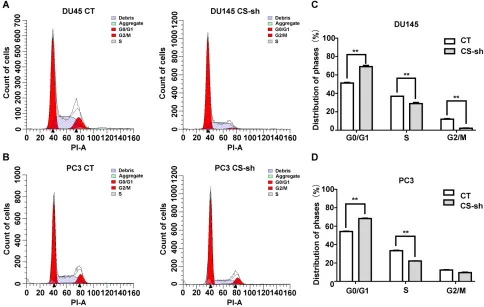
Moreover, CS downregulation in DU145 and PC3 cell lines induced an increase in the percentage of G0/G1 phase cells and a decrease in the percentage of S phase (for DU145: P < 0.001, for PC3: P < 0.001;Figure 3A–D).
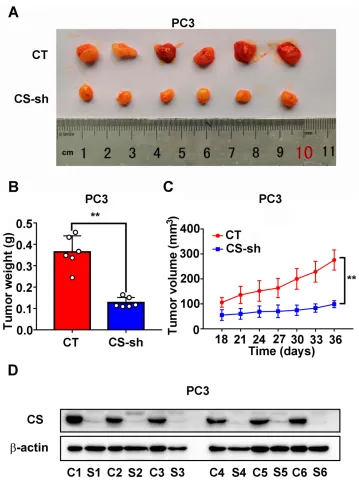
CS Knockdown Inhibits Tumor Growth in
PCa Xenograft Model in vivo
To study the role of CS in the growth of PCa in vivo, we established a model of xenograft nude mice through inject-ing PC3 CT and PC3 CS knockdown cells subcutaneously into male nude mice. The tumor growth velocity of the CS knockdown group was slower compared with that of the CT group (P < 0.001,Figure 4C). The tumors in the CS knockdown group also had a smaller size and lighter weight than those in the CT group over a 5 weeks’feeding (for size:P< 0.001, for weight:P= 0.002;Figure 4Aand B). The protein expression level of CS in CS-sh group was significantly lower than that in CT group (Figure 4D).
CS Knockdown Exerts the Inhibitory
Effects on Cell Lipid Metabolism and
Mitochondrion Function of PCa Cells
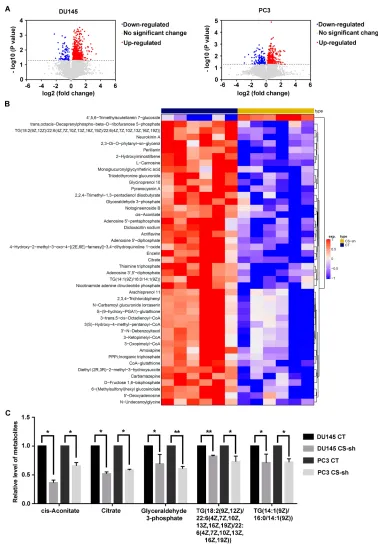
UHPLC-MS/MS analysis was performed to detect the molecular basis for the oncogenic function of CS in PCa cells. The volcano plots of DU145 and PC3 cells showed the metabolites with differential levels between the CS knockdown group and the CT group (Figure 5A). A clustering heatmap to illustrated significantly expressed metabolites was shown inFigure 5B. As a result, we found that TCA metabolites like citrate and cis-Aconitate levels were lessened in DU145 and PC3 cells with the CS knock-down. In addition, glyceraldehyde 3-phosphate (G3P) and glyceryl triphosphate levels (TG(14:1(9Z)/16:0/14:1(9Z)) and TG(18:2(9Z,12Z)/22:6(4Z,7Z,10Z,13Z,16Z,19Z)/22:6 (4Z,7Z,10Z,13Z,16Z,19Z))) in the CS knockdown group were lower than those of CT group (for DU145: PG3P = 0.040, PTG14 = 0.044, PTG18 = 0.009; for PC3: PG3P = Figure 3Decreased expression of CS inhibited cell cycle progression in vitro. (AandB) Cell cycle assay detected byflow cytometer of DU145 and PC3 cells with CS knockdown or CT vector. The y-axis showed the count of effective cells, and the x-axis showed the DNA content. The red area on the left referred to the cells in the G0/ G1 phase, the diagonal region in the middle area referred to the cells in the S phase, and the red area on the right referred to the cells in the G2/M phase. Debris referred to cell debris. Aggregate referred to cell aggregation. (CandD) The histogram demonstrated the quantitative analysis of the cell cycle in DU145 and PC3 cells with CS knockdown or CT vector. **P< 0.01.
Abbreviations:CS, citrate synthesis; CT, control.
Cancer Management and Research downloaded from https://www.dovepress.com/ by 118.70.13.36 on 27-Aug-2020
0.001,PTG14= 0.032,PTG18= 0.015;Figure 5C). We also performed functional enrichment analysis on the differen-tial expression of CS in the transcriptome TCGA-PRAD database. Gene Set Enrichment Analysis (GSEA) of can-didate lipid metabolism pathways showed significant enrichment for “REACTOME_REGULATION_OF_ LIPID_METABOLISM_BY_PPARALPHA” signaling in
CS high expression patients compared to CS low expres-sion patients (Figure S3;P= 0.011, FDR = 0.011).
As the mitochondrion is one of the reaction sites of the lipid metabolites described above, we further exam-ined the impact of CS protein on the mitochondrial function of PCa cells. The MitoTracker assay was per-formed to detect the changes in the mitochondrial Figure 4 Downregulated expression of CS inhibits PC3 tumor growth in a xenograft model in vivo. (A) Represent photos of tumors from the xenograft model subcutaneously implanted with PC3 cells stably CS knockdown or negative CT. (BandC) The weight and growth curves of tumor of CS knockdown tumors and CT tumors. (D) Western blot assay of CS protein in xenograft tumors derived from CT cells and CS-sh cells. **P< 0.01.
Abbreviations:CS, citrate synthesis; CT, control; C1-6, control 1–6; S1-6, CS-sh 1–6.
Cancer Management and Research downloaded from https://www.dovepress.com/ by 118.70.13.36 on 27-Aug-2020
function of PCa cells in the CS knockdown and CT groups. As shown in Figure 6A and B, the cell fl uores-cence under MitoTracker staining was obviously
decreased in the CS knockdown cells compared with that of the CT group, which was further confirmed by MitoTrackerflow cytometry (for DU145:P < 0.001, for Figure 5CS knockdown exerts the inhibitory effects on inhibits cell lipid metabolism of PCa cells. (A) The volcano plots showed genes differentially expressed between DU145 and PC3 cells with CS knockdown group and the CT group (P-value < 0.05). (B) The clustering heatmap of significantly expressed metabolites in CS knockdown cells compared to those in CT cells. (C) The relative quantitative histogram showed that the levels of cis-Aconitate, citrate, glyceraldehyde 3-phosphate, TG(18:2(9Z,12Z)/ 22:6(4Z,7Z,10Z, 13Z,16Z,19Z)/22:6(4Z,7Z,10Z,13Z,16Z,19Z)) and TG(14:1(9Z)/16:0/14:1(9Z)) in the CS-knockdown cells and CT cells. *P< 0.05, **P< 0.01.
Abbreviations:CS, citrate synthesis; PCa, prostate cancer; CT, control; TG, triglyceride.
Cancer Management and Research downloaded from https://www.dovepress.com/ by 118.70.13.36 on 27-Aug-2020
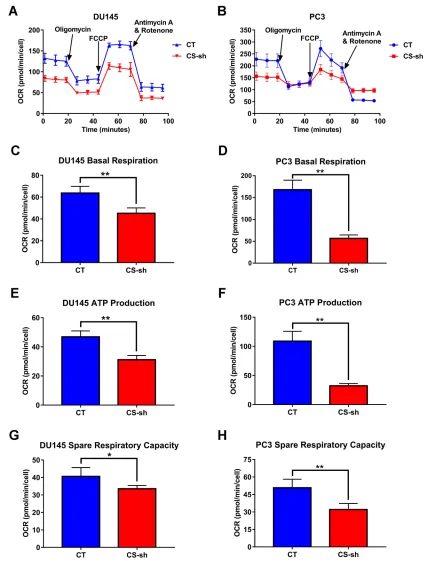
PC3: P < 0.001; Figure 6C and D). We next examined the mitochondrial function by testing the oxygen con-sumption rate (OCR) of DU145 and PC3 cells with CS
knockdown and negative CT vector, using seahorse assay (Figure 7A and B). We found that CS downregu-lation could significantly inhibit both baseline Figure 6Downregulated expression of CS inhibits the mitochondrial function of PCa cells.(AandB) The mitochondrialfluorescence of MitoTracker assay under afluorescent microscope in DU145 and PC3 cells with CS knockdown and CT vector. The red area indicated mitochondria. The blue area indicated nuclear. (CandD) The MitoTrackerflow cytometry of DU145 and PC3 cells with CS knockdown and CT vector. The red area referred CS-sh group. The blue area referred CT group. The histogram demonstrated the quantitative analysis of the mitochondrialfluorescence. **P< 0.01.
Abbreviations:CS, citrate synthesis; PCa, prostate cancer; CT, control.
Cancer Management and Research downloaded from https://www.dovepress.com/ by 118.70.13.36 on 27-Aug-2020
Figure 7Downexpression of CS inhibited mitochondrial respiration and reduced mitochondrial-ATP production. (AandB) Oxygen consumption rate (OCR) in DU145 and PC3 cells with CS knockdown and CT vector. The OCR was divided into three parts and analyzed by Seahorse assay, including baseline respiration, spare respiratory capacity and ATP production. As long as one or more of these parts were suppressed, the mitochondrial function is impaired. (C–H) Baseline respiration (CandD), ATP production (EandF) and spare respiratory capacity (GandH) were significantly inhibited in CS-sh cells compared with those in CT cells. *P< 0.05, **P< 0.01.
Abbreviations:CS, citrate Synthesis; ATP, adenosine triphosphate; CT, control; FCCP, carbonyl cyanide 4-(trifluoromethoxy)phenylhydrazone).
Cancer Management and Research downloaded from https://www.dovepress.com/ by 118.70.13.36 on 27-Aug-2020
respiration, ATP production and spare respiratory capa-city compared with the control group (Figure 7C–H).
Discussion
An increasing number of scientific researches has paid attention to identifying the diagnostic and prognostic bio-markers of PCa. In this study, we firstly verified the over-expression of CS protein and mRNA in PCa tissues compared to the normal prostate tissues. High CS expres-sion was found to be significantly associated with various aggressive clinical-pathological features of patients with PCa, such as high Gleason score, advanced pathological stage, and positive biochemical recurrence. CS expression might be one of the prognostic markers for BCR-free survival of patients with PCa. Functionally, the reduced expression of CS suppressed PCa cell proliferation, colony formation, migration, invasion and cell cycle in vitro. And decreased expression of CS inhibited tumor growth in vivo. In addition, CS downregulation exerts potential inhibitory effects on the lipid metabolism and mitochon-drial function of PCa cells.
Growing evidence showed that metabolic changes were possible to play an important role in the development, progression, and drugs resistance of PCa.17–21 Among them, the changes of TCA cycle enzymes have been observed in multiple human cancers.22 Mitochondria as the main reaction site of TCA cycle, its dysfunction caused by abnormal metabolic enzymes and metabolites is a driving factor for cancer and can be used as a “second hit” in the metabolic transformation of cancer.23,24 As a limiting velocity enzyme that catalyzes the first step of the TCA cycle, the aberrant expression of CS has been revealed to be related with various malignancies, which included ovarian cancer, pancreatic cancer, cervical can-cer, and renal cancan-cer,8,9,10,25in line with which, we herein observed the strong positive immunostaining and the upre-gulated expression level of CS protein in PCa tissues compared to the normal prostate tissues. According to the results of TCGA-PRAD data and our TMA cohort, we determined the positive correlation of CS overexpres-sion with PCa advanced progresoverexpres-sion and poor prognosis.
Lin et al reported that CS knockdown induced epithe-lial-mesenchymal transformation of cervical cancer cells, and accelerated metastasis, proliferation, and tumor growth.10 On the contrary, Chen et al showed that the decreased expression of CS led to the inhibition of cell proliferation, cell migration, and invasion of ovarian can-cer cells.8 To determine the biological functions of CS
protein in PCa. In this study, we established the CS knock-down DU145 and PC3 cell lines using the specific shRNA to CS. Through a series of functional experiments, our data demonstrated that the reduced expression of CS protein significantly decreased the malignancy of PCa cells, including the inhibition of cell proliferation, colony for-mation, migration, and invasion. Especially, CS downre-gulation might arrest the cell cycle process from G0/G1 to S phase. Consistently, the CS downregulation also exerted a function suppressing tumor growth and progression in mice.
Mycielska et al reported that the providing of exogen-ous citrate reinforced endocytosis, lateral movement, and suppressed adhesion of PCa cells. The enhancement of cell transfer behavior is related to the conversion of citrate to fatty acids.11In this study, we demonstrated that the levels of citrate and cis-aconitic acid in the CS knockdown cells of PCa were significantly less than those in the control cells. Our untargeted metabolomics results showed that the productions of G3P and triglycerides were decreased in our CS knockdown cell lines. In a previous study,26a part of the excess citrate can transfer to the cytosol and degrade to acetyl-CoA in the cellular higher energy level. There-after, acetyl-CoA can be used in the fatty acid and choles-terol synthesis. Citrate also has a positive regulatory effect on the enzymes of lipo-genesis.26 Mao27 and Barber28 reported that the enhanced activity of ACC promoted the synthesis and deposition of cellular triglycerides. It sug-gested that citrate may interfere with lipid metabolism through ACC. In addition, glyceraldehyde triphosphate is a member of the pentose phosphate pathway. Pentose phosphate pathway could produce a large amount of NADPH and participate in the synthesis of fatty acids and sterols. These findings suggested that citrate may also affect lipid metabolism through influence glyceralde-hyde triphosphate. We also performed functional enrich-ment analysis on the differential expression of CS in the transcriptome TCGA-PRAD database. Gene Set Enrichment Analysis showed significant enrichment for lipid metabolism signaling in CS high expression patients compared to CS low expression patients. Therefore, CS might regulate the level of citrate and affect the synthesis of cellular lipids, which were involved in a lot of cellular processes critical for cell transformation, tumor develop-ment, and disease progression.29
Recent studies have reported that cancer cells may tend to synthesize de novo lipids and increase the rate of intracellular lipid synthesis.30,31 Consistently, our data
Cancer Management and Research downloaded from https://www.dovepress.com/ by 118.70.13.36 on 27-Aug-2020
imply that PCa cells may increase the production of citrate through CS and promote the synthesis of intracellular lipids, which may promote the proliferation and metastatic potentials of cells. Moreover, it has been reported that cell mitochondrial dysfunction and altered lipid homeostasis may play a role in cancer progression.32 To investigate the involvement of CS in mitochondrial function, we per-formed the MitoTracker and Seahorse experiment based on the CS knockdown and control PCa cells. The decreased expression of CS protein also suppress the mitochondrial OCR of PCa cells, which might decrease the synthesis of lipids.
However, there are still several limitations to this study. In addition to the loss-of-function experiments, the gain-of-function experiments are also needed to verify the oncogenic role of CS in PCa. In our preliminary studies, the CS overexpression PCa cell lines were not successfully established due to the technical problems which we are trying to resolve.
Conclusion
In conclusion, thesefindings suggest that CS upregulation is associated with the aggressive progression and poor prognosis of patients with PCa. CS may play an essential role in the progression of PCa, which might be partially associated with its regulation on the lipid metabolism and mitochondrial function. In addition, more experiments are required to study the molecular mechanisms underlying the biological functions of CS in PCa.
Acknowledgment
We thank Prof. Zhang from the Institute of Chinese Materia Medica, China Academy of Chinese Medical Sciences, Beijing, China, for providing writing assistance. We also thank the BioTree Company, Shanghai, China, for the help of the metabolic assay.
Funding
National Natural Science Foundation of China, Grant/Award Number: 81874099, 81600620, 81571427, 81802567; Science and Technology Project of Guangdong Province, Grant/Award Number: 2018A030313668; Fundamental Research Funds for Central Universities, Grant/Award Number: 2018MS18, 21618306; Guangzhou Municipal Science and Technology Project, Grant/Award Number: 201803040001, 201707010291, 201710010081; The Science Foundation of Guangzhou First People’s Hospital, Grant/Award Number: Q2019007, Q2019020.
Disclosure
The authors declare that they have no possible conflicts of interest.
References
1. Siegel RL, Miller KD, Jemal A. Cancer statistics, 2019.CA Cancer J Clin.2019;69(1):7–34. doi:10.3322/caac.21551
2. Bray F, Ferlay J, Soerjomataram I, et al. Global cancer statistics 2018: GLOBOCAN estimates of incidence and mortality worldwide for 36 cancers in 185 countries. CA Cancer J Clin. 2018;68 (6):394–424. doi:10.3322/caac.21492
3. Negoita S, Feuer EJ, Mariotto A, et al. Annual report to the nation on the status of cancer, part II: recent changes in PCa trends and disease characteristics. Cancer. 2018;124(13):2801–2814. doi:10.1002/ cncr.31549
4. Eidelman E, Twum-Ampofo J, Ansari J, et al. The metabolic pheno-type of prostate cancer. Front Oncol. 2017;7:131. doi:10.3389/ fonc.2017.00131
5. Costello LC, Feng P, Milon B, et al. Role of zinc in the pathogenesis and treatment of PCa: critical issues to resolve. Prostate Cancer Prostatic Dis.2004;7(2):111–117. doi:10.1038/sj.pcan.4500712 6. Costello LC, Franklin RB. A comprehensive review of the role of
zinc in normal prostate function and metabolism; and its implications in PCa. Arch Biochem Biophys. 2016;611:100–112. doi:10.1016/j. abb.2016.04.014
7. Wiegand G, Remington SJ. Citrate synthase: structure, control, and mechanism. Annu Rev Biophys Biophys Chem. 1986;15:97–117. doi:10.1146/annurev.bb.15.060186.000525
8. Chen L, Liu T, Zhou J, et al. Citrate synthase expression affects tumor phenotype and drug resistance in human ovarian carcinoma. PLoS One. 2014;9(12):e115708. doi:10.1371/journal. pone.0115708
9. Schlichtholz B, Turyn J, Goyke E, et al. Enhanced citrate synthase activity in human pancreatic cancer.Pancreas.2005;30(2):99–104. doi:10.1097/01.mpa.0000153326.69816.7d
10. Lin CC, Cheng TL, Tsai WH, et al. Loss of the respiratory enzyme citrate synthase directly links the warburg effect to tumor malignancy.Sci Rep.2012;2:785. doi:10.1038/srep00785
11. Mycielska ME, Broke-Smith TP, Palmer CP, et al. Citrate enhances in vitro metastatic behaviours of PC-3M human PCa cells: status of endogenous citrate and dependence on aconitase and fatty acid synthase. Int J Biochem Cell Biol. 2006;38(10):1766–1777. doi:10.1016/j.biocel.2006.04.008
12. Miyamoto DT, Zheng Y, Wittner BS, et al. RNA-Seq of single prostate CTCs implicates noncanonical Wnt signaling in antiandro-gen resistance. Science. 2015;249(6254):1351–1356. doi:10.1126/ science.aab0917
13. Liu ZZ, Han ZD, Liang YK, et al. TRIB1 induces macrophages to M2 phenotype by inhibiting IKB-zeta in PCa. Cell Signal. 2019;59:152–162. doi:10.1016/j.cellsig.2019.03.017
14. Jia Zhuo Y, Zhen Liu Z, Wan S, et al. Enhanced expression of SRPK2 contributes to aggressive progression and metastasis in prostate cancer. Biomed Pharmacother. 2018;102:531–538. doi:10.1016/j. biopha.2018.03.079
15. Thakur S, Daley B, Gaskins K, et al. Metformin targets mitochondrial glycerophosphate dehydrogenase to control rate of oxidative phosphor-ylation and growth of thyroid cancer in vitro and in vivo.Clin Cancer Res.2018;24(16):4030–4043. doi:10.1158/1078-0432.CCR-17-3167 16. Passalacqua KD, Lu J, Goodfellow I, et al. Glycolysis Is an Intrinsic
factor for optimal replication of a norovirus. MBio. 2019;10(2): e02175–18. doi:10.1128/mBio.02175-18
17. Giunchi F, Fiorentino M, Loda M. The metabolic landscape of prostate cancer. Eur Urol Oncol. 2019;2(1):28–36. doi:10.1016/j. euo.2018.06.010
Cancer Management and Research downloaded from https://www.dovepress.com/ by 118.70.13.36 on 27-Aug-2020
18. Schug ZT, Vande Voorde J, Gottlieb E. The metabolic fate of acetate in cancer.Nat Rev Cancer.2016;16(11):708–717. doi:10.1038/nrc.2016.87 19. Lloyd MD, Yevglevskis M, Lee GL, et al.α-Methylacyl-CoA race-mase (AMACR): metabolic enzyme, drug metabolizer and cancer marker P504S.Prog Lipid Res.2013;52(2):220–230. doi:10.1016/j. plipres.2013.01.001
20. De Nunzio C, Aronson W, Freedland SJ, et al. The correlation between metabolic syndrome and prostatic diseases. Eur Urol. 2012;61(3):560–570. doi:10.1016/j.eururo.2011.11.013
21. Sreekumar A, Poisson LM, Rajendiran TM, et al. Metabolomic profiles delineate potential role for sarcosine in prostate cancer progression. Nature.2009;457(7231):910–914. doi:10.1038/nature07762
22. Cardaci S, Ciriolo MR. TCA cycle defects and cancer: when meta-bolism tunes redox state. Int J Cell Biol. 2012;2012:161837. doi:10.1155/2012/161837
23. Frezza C, Gottlieb E. Mitochondria in cancer: not just innocent 1 bystanders. Semin Cancer Biol. 2009;19:4–11. doi:10.1016/j. semcancer.2008.11.008
24. Gaude E, Frezza C. Defects in mitochondrial metabolism and cancer. Cancer Metab.2014;2:10. doi:10.1186/2049-3002-2-10
25. Simonnet H, Alazard N, Pfeiffer K, et al. Low mitochondrial respira-tory chain content correlates with tumor aggressiveness in renal cell carcinoma. Carcinogenesis. 2002;23:759–768. doi:10.1093/carcin/ 23.5.759
26. Dashty M. A quick look at biochemistry: carbohydrate metabolism. Clin Biochem. 2013;46(15):1339–1352. doi:10.1016/j.clinbiochem. 2013.04.027
27. Mao J, DeMayo FJ, Li H, et al. Liver-specific deletion of acetyl-CoA carboxylase 1 reduces hepatic triglyceride accumulation without affecting glucose homeostasis.Proc Natl Acad Sci U S A.2006;103 (22):8552–8557. doi:10.1073/pnas.0603115103
28. Barber MC, Price NT, Travers MT. Structure and regulation of acetyl-CoA carboxylase genes of metazoa. Biochim Biophys Acta. 2005;1733(1):1–28. doi:10.1016/j.bbalip.2004.12.001
29. Röhrig F, Schulze A. The multifaceted roles of fatty acid synthesis in cancer. Nat Rev Cancer. 2016;16(11):732–749. doi:10.1038/ nrc.2016.89
30. Ray U, Roy SS. Aberrant lipid metabolism in cancer cells–the role of oncolipid-activated signaling. FEBS J. 2018;285(3):432–443. doi:10.1111/febs.14281
31. Beloribi-Djefaflia S, Vasseur S, Guillaumond F. Lipid metabolic reprogramming in cancer cells. Oncogenesis. 2016;5:e189. doi:10.1038/oncsis.2015.49
32. Vamecq J, Dessein AF, Fontaine M, et al. Mitochondrial dysfunction and lipid homeostasis.Curr Drug Metab. 2012;13(10):1388–1400. doi:10.2174/138920012803762792
Cancer Management and Research
Dove
press
Publish your work in this journal
Cancer Management and Research is an international, peer-reviewed open access journal focusing on cancer research and the optimal use of preventative and integrated treatment interventions to achieve improved outcomes, enhanced survival and quality of life for the cancer patient.
The manuscript management system is completely online and includes a very quick and fair peer-review system, which is all easy to use. Visit http://www.dovepress.com/testimonials.php to read real quotes from published authors.
Submit your manuscript here:https://www.dovepress.com/cancer-management-and-research-journal
Cancer Management and Research downloaded from https://www.dovepress.com/ by 118.70.13.36 on 27-Aug-2020