O R I G I N A L R E S E A R C H
Expression of PD-1 and PD-L1 on Tumor-In
fi
ltrating
Lymphocytes Predicts Prognosis in Patients with
Small-Cell Lung Cancer
This article was published in the following Dove Press journal: OncoTargets and Therapy
Chenglong Sun,1–3,*
Liping Zhang, 4,* Wei Zhang, 4,* Yu Liu,3,5Bin Chen,3Sha Zhao,3 Wei Li,3Lei Wang,3Lingyun Ye,3 Keyi Jia,3,5Hao Wang,3,5 Chunyan Wu,4Yayi He, 3 Caicun Zhou3
1Medical College of Soochow University, Suzhou 215123, Jiangsu, People’s Republic of China;2Anhui No.2 Provincial People’s Hospital, Hefei 230041, Anhui, People’s Republic of China;3Department of Medical Oncology, Shanghai Pulmonary Hospital, Tongji University Medical School Cancer Institute, Tongji University School of Medicine, Shanghai 200433, People’s Republic of China;4Pathology Department, Shanghai Pulmonary Hospital, Tongji University Medical School Cancer Institute, Tongji University School of Medicine, Shanghai 200433, People’s Republic of China; 5Medical School, Tongji University, Shanghai 200433, People’s Republic of China
*These authors contributed equally to this work
Introduction:Immune therapy has shown good results in small-cell lung cancer (SCLC), but the impact of immune microenvironment of the disease is unclear. In this work, we detected expression of programmed death 1 (PD-1), PD-ligand 1 (PD-L1), and other immune biomarkers of cancer. We also analyzed the correlations between these markers and survival in SCLC.
Patients and Methods:Protein expression of PD-1, PD-L1, PD-L2, CD3, CD4, CD8, and FOXP3 was analyzed in surgical tissues from 102 SCLC patients by immunohistochemistry. Results:Positive expression of PD-1 on tumor-infiltrating lymphocytes (TILs) was found in 40.2% of patients; 37.3% of patients showed positive expression of PD-L1 on TILs; and 3.9% showed positive expression of PD-L1 on tumor cells. PD-L2 protein was not expressed on tumor cells or TILs. Survival analysis showed that positive expression of PD-L1 on TILs was correlated with longer relapse-free survival (RFS) (p=0.004). Positive expression of PD-1 combined with a high ratio of lymphocytes (CD3, p=0.004; CD4, p=0.0PD-1PD-1; CD8, p=0.009; FOXP3, p=0.009) was associated with significantly better RFS than negative expression of PD-1 combined with a lower ratio of lymphocytes. Positive expression of PD-L1 combined with a high ratio of lymphocytes (CD3, p<0.001; CD4, p=0.001; CD8, p=0.002; FOXP3, p=0.001) was associated with significantly better RFS than negative expression of PD-L1 combined with a lower ratio of lymphocytes. All patients’stage were between I and III. Conclusion:PD-1 and PD-L1 expression might be good prognostic factors in SCLC. Keywords:small-cell lung cancer, SCLC, programmed 1, PD-1, programmed death-ligand 1, PD-L1, programmed death-death-ligand 2, PD-L2, tumor-infiltrating lymphocytes, TILs
Introduction
The incidence and mortality of lung cancer are increasing. Fifteen percent of lung
cancer patients have small-cell lung cancer (SCLC).1The standard treatment for
advanced extensive SCLC is chemotherapy,2 which shows a high but transient
response rate.3 The options for subsequent-line treatment are limited. There is
thus an urgent need to develop new treatments for patients with SCLC. Research on immune therapy combined with chemotherapy for SCLC is ongoing: IMPOWER-133 showed better prognosis in patients receiving
etoposide/carbopla-tin/atezolizumab treatment;4and the CASPIAN study indicated that a combination
of first-line programmed death ligand 1 (PD-L1) inhibitors with chemotherapy
increased overall survival (OS).5Although immunotherapy showing the antitumor
activity on SCLC in some studies,6,7but SCLC patients did not benefit greatly from
Correspondence: Yayi He
Department of Medical Oncology, Shanghai Pulmonary Hospital, Tongji University Medical School Cancer Institute, Tongji University School of Medicine, No. 507 Zhengmin Road, Shanghai 200433, People’s Republic of China
Tel +13818828623 Email 2250601@qq.com
Caicun Zhou
Department of Medical Oncology, Shanghai Pulmonary Hospital, Tongji University Medical School Cancer Institute, Tongji University School of Medicine, No. 507 Zhengmin Road, Shanghai 200433, People’s Republic of China
Tel +13301825532
Email caicunzhou@gmail.com
OncoTargets and Therapy
Dove
press
open access to scientific and medical research
Open Access Full Text Article
OncoTargets and Therapy downloaded from https://www.dovepress.com/ by 118.70.13.36 on 27-Aug-2020
ICI compared with NSCLC patients. The implications of immune microenvironment of SCLC remain uncertain.
In this study, we detected protein expression of pro-grammed death 1 (PD-1), PD-L1, PD-L2, CD3, CD4, CD8, and FOXP3 in 102 SCLC patients using immunohis-tochemistry (IHC). The correlations between PD-1/PD-L1 and pathological features were analyzed. We also per-formed survival analysis in these patients.
Patients and Methods
Patients
A total of 102 SCLC patients who underwent surgery in Shanghai Pulmonary Hospital from January 2014 to December 2018 were retrospectively enrolled in our study.
SCLC was diagnosed by two pathologists (“L.Z. and C.
W.”). Patients did not receive radiation or chemotherapy
before surgery. We reviewed patient data and determined TNM stage based on the International Association for the
Study of Lung Cancer version 8. All patient’s stage was
between I and III that was determined after the operation. All patients were provided with written informed consent. The ethics committee of Shanghai Pulmonary Hospital approved this study. The study was performed in accor-dance with the International Conference on Harmonisation Guidelines on Good Clinical Practice and the Declaration of Helsinki.
Immunohistochemistry
Experimental Antibodies and Configuration
Conditions
Rabbit anti-human PD-1 (1:100, Golden Bridge Zhongshan, Beijing ZM-0381), PD-L1 (E1L3N 1: 300, CST # 13684S), PD-L2 (1: 200, CST # 82723S), CD3 (1:100, Dako A0452), CD4 (1:80, Dako M7310), CD8 (1:100, Dako M7103), and FOXP3 (1:100, BioLegend 320,101) antibodies were used.
The IHC route was as follows. Formalin-fixed paraffi n-embedded tissue slides were dewaxed with xylene followed by alcohol, and rinsed with distilled water. Antigens were recovered with a target retrieval solution kit (DM828 or DM829, Dako) under heat and high pressure for 10 min. After cooling to room temperature, slides were immersed in
0.3% H2O2to reduce background staining. The slides were
then incubated with primary antibody for 1 h at room temperature. After rinsing with phosphate-buffered saline (PBS), they were incubated with horseradish peroxidase-conjugated goat anti-Mouse/Rabbit IgG detection antibody for a further 30 min at room temperature. After rinsing
again with PBS, antigens were visualized with DAB, fol-lowing standard procedures for counterstaining cell nuclei with hematoxylin and mounting cover slides. IHC was performed by Wei Zhang and Chenglong Sun.
PD-1, PD-L1, PD-L2, CD3, CD4, CD8, and FOXP3 IHC Cutoff Values
IHC scores were independently determined by two experi-enced pathologists (Liping Zhang and Chunyan Wu).
A positive result was defined as staining on
tumor-infiltrating lymphocytes (TILs) of more than 1% for PD-1 or more than 5% for PD-L1, or staining on tumor cells of more than 40% for CD3, more than 30% for CD4, more than 30% for CD8, or more than 10% for FOXP3. We used survival analysis to determine the best cutoff points by maximizing statistical differences in relapse-free survival (RFS).8,9
Statistical Analyses
We performed statistical analyses using SPSS 25.0 (IBM) and GraphPad Prism version 8.0 (GraphPad Software, Inc) for Mac OS. A chi-square test was used to assess correla-tions between immune-marker expression and clinical char-acteristics. The Kaplan–Meier method was used to construct patient survival curves. Survival analysis was performed by Log-rank test. Univariate and multivariate Cox proportion-ate hazard models were used to identify factors significantly related to RFS. Logistic regression was used to estimate the correlations between immune marker expression levels. p<0.05 was considered to indicate statistical significance. All statistical tests were double-sided.
Results
Patient Characteristics
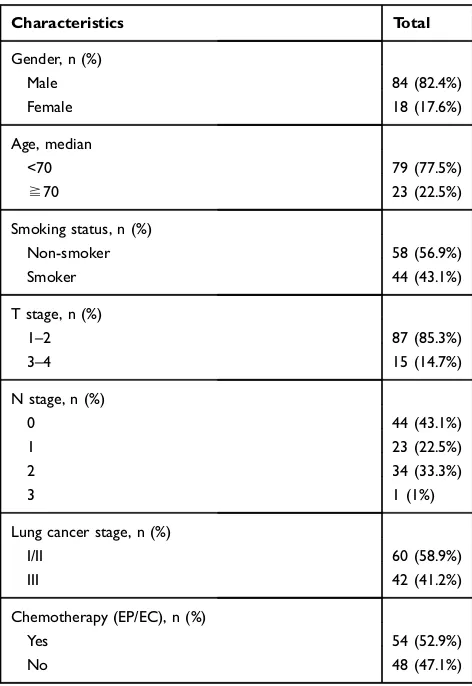
A total of 102 patients were enrolled. There were 17.6% female and 82.4% male patients, and 23 were over the age of 70 years. The median age was 62 years. Fifty-eight (56.9%) patients had never smoked. All patients were stage I–III: 60 (58.8%) were stage I or II, and 42 (47.1%) were stage III. Fifty-four patients received postoperative adjuvant chemotherapy (Table 1).
CD3, CD4, CD8, FOXP3, PD-1, PD-L1, and PD-L2 Expression and Correlations with Clinicopathological Data
CD3+ TILs were observed in 54/102 (52.9%) SCLC speci-mens, CD4+ TILs in 38/102 (37.3%), CD8+ TILs in 33/102
(32.4%), and FOXP3+ TILs in 35/102 (34.3%) (Figure 1).
OncoTargets and Therapy downloaded from https://www.dovepress.com/ by 118.70.13.36 on 27-Aug-2020
Positive expression of PD-1 on TILs was observed in 40.2% of patients; 37.3% showed positive expression of PD-L1 on TILs, and 3.9% showed positive expression of PD-L1 on tumor cells. PD-1 was not expressed on tumor cells, PD-L2 was not expressed on tumor cells or TILs in
SCLC (Figure 2).
PD-1 expression on TILs was extensively correlated with stage (p=0.045). The expression of PD-1 on TILs
showed significant correlation with CD3 (p<0.001), CD4
(p<0.001), CD8 (p<0.001), and FOXP3 (p<0.001). PD-L1
expression on TILs had significant correlation with CD3
(p<0.001), CD4 (p<0.001), CD8 (p<0.001), FOXP3 (p<0.001), and PD-1 (p<0.001). PD-1 and PD-L1 expres-sion on TILs were not related to age, gender, or smoking status (Figure 3,Table 2). Bivariate logistic regression of TIL PD-L1 and PD-1 expression.
The expression of PD-L1 on TILs was correlated with
CD3 (p=0.001; R2=0.25), CD4 (p=0.001; R2=0.257), CD8
(p=0.001; R2=0.271), FOXP3 (p=0.001; R2=0.423), and
PD-1 (p=0.001; R2=0.166). The expression of PD-1 on
TILs was correlated with CD3 (p=0.001; R2=0.217),
CD4 (p=0.001; R2=0.205), CD8 (p=0.001; R2=0.182),
and FOXP3 (p=0.001; R2=0.314) (Table 3).
Survival Analysis
We used univariate and multivariate regression to analyze clinical factors and expression of immune biomarkers. Stage (I/II vs III) could predict RFS (univariate analysis: hazard
ratio (HR) 2.111, 95% CI 1.243–3.586, p=0.006;
multivari-ate analysis: HR 1.890, 95% CI 1.100–3.220, p=0.021). The
expression of CD3, CD4, CD8, FOXP3, and PD-L1 on TILs
was significant in univariate Cox regression (CD3 p=0.007;
CD4 p=0.010; CD8 p=0.007; FOXP3 p=0.004; PD-L1 p=0.006) but not in multivariate Cox regression (Table 4).
Clinicopathological factors and immune biomarkers were analyzed with respect to RFS. Age (p=0.043), stage (p=0.004), CD3 (p=0.006), CD4 (p=0.008), CD8 (p=0.004), FOXP3
(p=0.002), and PD-L1 on TILs (p=0.004) were significantly
correlated with RFS. Smoking status (p=0.056), gender (p=0.187), adjuvant chemotherapy (p=0.357), PD-1 on TILs (p=0.076), and PD-L1 on tumor cells (p=0.788) had no sig-nificant association with RFS (Figure 3).
We divided patients into subgroups by L1 and PD-1 expression on TILs (Figure 4) combined with CD3, CD4, CD8, and FOXP3. Positive expression of PD-1 or PD-L1 combined with a higher ratio of CD3, CD4, CD8, and FOXP3 was associated with higher RFS than was negative expression of PD-1 or PD-L1 combined with a lower ratio of CD3, CD4, CD8, and FOXP3.
Positive expression of PD-1 combined with a higher ratio of lymphocytes (CD3 p=0.004; CD4 p=0.011; CD8
p=0.009; FOXP3 p=0.009) was associated with signifi
-cantly better RFS than negative expression of PD-1 combined with a lower ratio of lymphocytes. Positive expression of PD-L1 combined with a higher ratio of
lymphocytes (CD3 p<0.001; CD4 p=0.001; CD8
p=0.002; FOXP3 p=0.001) was associated with signifi
-cantly better RFS than negative expression of PD-L1 combined with a lower ratio of lymphocytes. There
was a significant difference in RFS for positive vs
nega-tive PD-L1 and PD-1 expression on TILs (p=0.004). These results indicate that PD-L1 and PD-1 expression on TILs combined with expression of CD3, CD4, CD8, and FOXP3 represent important biomarkers that could be used to predict RFS in SCLC. All patients in this study received surgical resection of their lesion in early stage. Most of the them failed to reach the end point of OS, so we did not analyze the OS data.
Table 1Patient Characteristics (n=102)
Characteristics Total
Gender, n (%)
Male 84 (82.4%)
Female 18 (17.6%)
Age, median
<70 79 (77.5%)
≧70 23 (22.5%)
Smoking status, n (%)
Non-smoker 58 (56.9%)
Smoker 44 (43.1%)
T stage, n (%)
1–2 87 (85.3%)
3–4 15 (14.7%)
N stage, n (%)
0 44 (43.1%)
1 23 (22.5%)
2 34 (33.3%)
3 1 (1%)
Lung cancer stage, n (%)
I/II 60 (58.9%)
III 42 (41.2%)
Chemotherapy (EP/EC), n (%)
Yes 54 (52.9%)
No 48 (47.1%)
OncoTargets and Therapy downloaded from https://www.dovepress.com/ by 118.70.13.36 on 27-Aug-2020
Figure 2Kaplan–Meier analysis for RFS of SCLC patients based on expression of the CD3 on TILs, CD8 on TILs, FOXP3 on TILs, PD-1 on TILs, PD-L1 on TILs, PD-L1 on tumor cells, age, gender, smoking status, stage, adjuvant chemotherapy. The respective Log rank P values are indicated in the chart.
Abbreviations:RFS, relapse-free survival; PD-1, programed death-1; PD-L1, programed death-ligand 1; TILs, tumor-infiltrating lymphocytes; SCLC, small-cell lung cancer. Figure 1CD3, CD4, CD8, FOXP3, PD-1 were expressed on TILS, (A) low expression of CD3*4, (a) low expression of CD3*10; (B) high expression of CD3*4, (b) high expression of CD3*10; (C) low expression of CD4*4, (c) low expression of CD4*10; (D) high expression of CD4*4, (d) high expression of CD4*10; (E) low expression of CD8*4, (e) low expression of CD8*10; (F) high expression of CD8*4, (f) high expression of CD8*10; (G) low expression of FOXP3*10, (g) low expression of FOXP3*20; (H) high expression of FOXP3*10, (h) high expression of FOXP3*20; (K) low expression of PD-1*10, (k) low expression of PD-1*20; (L) high expression of PD-1*10, (l) high expression of PD-1*20; PD-L1 was expressed on Tumors; (I) low expression of PD-L1*10, (i) low expression of PD-L1*20; (J) high expression of PD-L1*10, (j) high expression of PD-L1*20.
Abbreviations:PD-1, programed death-1; PD-L1, programed death-ligand 1; TILs, tumor-infiltrating lymphocytes.
OncoTargets and Therapy downloaded from https://www.dovepress.com/ by 118.70.13.36 on 27-Aug-2020
Discussion
In this survey, we detected the expression of PD-1, PD-L1, CD3, CD4, CD8, and FOXP3. We also analyzed the cor-relations between PD-1, PD-L1, CD3, CD4, CD8, and FOXP3 and survival in SCLC patients.
PD-1 and PD-L1 expression have been detected in non-small-cell lung cancer (NSCLC)10,11and SCLC,12,13with PD-L1 expression in SCLC varying greatly. One study of 61
samples found 0% PD-L1 protein expression,14 whereas
another study of 102 patients reported a value of 71.6%.15In
this study, we detected not only the expression of PD-1 and PD-L1 but also that of PD-L2, CD3, CD4, CD8, and FOXP3
in SCLC. Furthermore, for thefirst time, we performed
sub-group analysis of the expression of PD-1 or PD-L1 combined with the ratio of lymphocytes and analyzed the relationships with RFS.
In our study, 40.2% of patients showed positive expres-sion of PD-1 and 37.3% showed positive expresexpres-sion of PD-L1 on TILs; 3.9% of patients showed positive expres-sion of PD-L1 on tumor cells. Our results are consistent
HR 95%CI P value HR 95%CI P value HR 95%CI P value
a/b 0.337 0.067 to 1.694 0.050* a/b 0.479 0.145 to 1.584 0.164 a/b 0.473 0.152 to 1.473 0.158
a/c 0.425 0.185 to 0.980 0.029 a/c 0.414 0.131 to 1.308 0.085 a/c 0.472 0.127 to 1.753 0.200
a/d 0.293 0.155 to 0.554 <0.001* a/d 0.873 0.294 to 2.588 0.001* a/d 0.287 0.155 to 0.532 0.002*
b/c 1.145 0.361 to 3.635 0.804 b/c 1.664 0.583 to 4.747 0.804 b/c 0.994 0.315 to 3.132 0.991
b/d 1.014 0.355 to 2.900 0.978 b/d 0.639 0.303 to 1.348 0.288 b/d 0.589 0.297 to 1.168 0.176
c/d 0.814 0.438 to 1.510 0.510 c/d 0.718 0.346 to 1.491 0.407 c/d 0.594 0.273 to 1.289 0.251
0 20 40 60 80
0 50 100
RFS(moths)
a pd-l1 on tils positive/cd3 positive b pd-l1 on tils positive/cd3 negative c pd-l1 on tils negative/cd3 positive d pd-l1 on tils negative/cd3 negative
p=0.010
0 20 40 60 80
0 50 100
RFS(moths)
a pd-l1 on tils positive/cd4 positive b pd-l1 on tils positive/cd4 negative c pd-l1 on tils negative/cd4 positive d pd-l1 on tils negative/cd4 negative
p=0.015
0 20 40 60 80
0 50 100
RFS(moths)
a pd-l1 on tils positive/cd8 positive b pd-l1 on tils positive/cd8 negative c pd-l1 on tils negative/cd8 positive d pd-l1 on tils negative/cd8 negative
p=0.010
HR 95%CI P value HR 95%CI P value HR 95%CI P value
a/b 0.248 0.067 to 0.913 0.005* a/b 0.605 0.192 to 1.904 0.350 a/b 0.379 0.118 to 1.218 0.035*
a/c 0.263 0.056 to 1.225 0.016 a/c 0.404 0.157 to 1.043 0.047 a/c 0.645 0.282 to 1.480 0.265
a/d 0.254 0.138 to 0.466 0.001* a/d 0.333 0.176 to 0.634 0.004* a/d 0.382 0.201 to 0.729 0.004*
b/c 1.031 0.328 to 3.240 0.957 b/c 0.669 0.257 to 1.739 0.400 b/c 1.705 0.608 to 4.786 0.234
b/d 1.018 0.452 to 2.290 0.965 b/d 0.556 0.267 to 1.157 0.164 b/d 1.163 0.486 to 2.784 0.713
c/d 1.027 0.400 to 2.633 0.954 c/d 0.919 0.470 to 1.798 0.800 c/d 0.696 0.364 to 1.333 0.279
0 20 40 60 80
0 50 100
RFS(moths)
a pd-l1 on tils positive/foxp3 positive b pd-l1 on tils positive/foxp3 negative c pd-l1 on tils negative/foxp3 positive pd-l1 on tils negative/foxp3 negative d
p=0.006
0 20 40 60 80
0 50 100
RFS(moths)
a pd-l1 on tils positive/pd-1 on tils positive b pd-l1 on tils positive/pd-1 on tils negative c pd-l1 on tils negative/pd-1 on tils positive d pd-l1 on tils negative/pd-1 on tils negative
p=0.030
0 20 40 60 80
0 50 100
RFS(moths)
a pd-1 on tils positive/cd3 positive b pd-1 on tils positive/cd3 negative c pd-1 on tils negative/cd3 positive d pd-1 on tils negative/cd3 negative
p=0.030
HR 95%CI P value HR 95%CI P value HR 95%CI P value
a/b 0.593 0.228 to 1.541 0.255 a/b 0.491 0.193 to 1.246 0.127 a/b 0.561 0.214 to 1.469 0.208
a/c 0.944 0.313 to 2.844 0.917 a/c 0.896 0.257 to 3.123 0.859 a/c 1.752 0.470 to 6.530 0.466
a/d 0.412 0.222 to 0.764 0.011* a/d 0.369 0.195 to 0.698 0.009* a/d 0.405 0.222 to 0.738 0.009*
b/c 1.664 0.583 to 4.740 0.347 b/c 1.905 0.681 to 5.332 0.251 b/c 3.124 0.939 to 10.390 0.120
b/d 0.723 0.367 to 1.424 0.368 b/d 0.751 0.397 to 1.419 0.390 b/d 0.734 0.375 to 1.436 0.387
c/d 0.456 0.219 to 0.952 0.083 c/d 0.412 0.192 to 0.885 0.072 c/d 0.237 0.105 to 0.532 0.025
0 20 40 60 80
0 50 100
RFS(moths)
a pd-1 on tils positive/cd4 positive b pd-1 on tils positive/cd4 negative c pd-1 on tils negative/cd4 positive d pd-1 on tils negative/cd4 negative
p=0.042
0 20 40 60 80
0 50 100
RFS(moths)
a pd-1 on tils positive/cd8 positive b pd-1 on tils positive/cd8 negative c pd-1 on tils negative/cd8 positive d pd-1 on tils negative/cd8 negative
p=0.029
0 20 40 60 80
0 50 100
RFS(moths)
a pd-1 on tils positive/foxp3 positive b pd-1 on tils positive/foxp3 negative c pd-1 on tils negative/foxp3 positive -1 on tils negative/foxp3 negative d
d p
p=0.014
Figure 3Kaplan–Meier analysis for RFS of SCLC patients based on the two by two combination of the following markers: PD-1 on TILs, PD-L1 on TILs, CD3 on TILs, CD4 on TILs, CD8 on TILs, FOXP3 on TILs and PD-L1 on tumor cells. The respective Log Rank P values are shown in the chart.
Abbreviations:RFS, relapse-free survival; PD-1, programed death-1; PD-L1, programed death-ligand 1; TILs, tumor-infiltrating lymphocytes; SCLC, small-cell lung cancer.
OncoTargets and Therapy downloaded from https://www.dovepress.com/ by 118.70.13.36 on 27-Aug-2020
with former findings.13,16 PD-L2 protein expression was not examined in the 102 surgical samples, in either tumor cells or TILs. Previous studies have shown 39.5% PD-L2
expression in SCLC,17 compared with 47–52.8% in
NSCLC.18,19 This might be related to the heterogeneity
of immune checkpoint expression in tumor tissue.
Table 2Relationship Between PD-L1 and PD-1 Expression on TILs and Various Patient Characteristics
Characteristics N PD-L1 Expression on TILs p-value N PD-1 Expression on TILs p-value
Positive Negative Positive Negative
Gender 102 0.487 0.685
Male 84 30 54 84 33 51
Female 18 8 10 18 8 10
Age 0.781 0.906
<70 79 30 49 79 32 47
≧70 23 8 15 23 9 14
Smoking status 0.506 0.492
Non-smoker 58 20 38 58 25 33
Smoker 44 18 26 44 16 28
Lung cancer stage 0.053 0.045*
I/II 60 27 33 60 29 31
III 42 11 31 42 12 30
CD3 <0.001* <0.001*
Positive 54 31 23 54 32 22
Negative 48 7 41 48 9 39
CD4 <0.001* <0.001*
Positive 38 25 13 38 25 13
Negative 64 13 51 64 16 48
CD8 <0.001* <0.001*
Positive 33 23 10 33 22 11
Negative 69 15 54 69 19 50
FOXP3 <0.001* <0.001*
Positive 35 27 8 35 26 9
Negative 67 11 56 67 15 52
PD-1 <0.001*
Positive 41 24 17
Negative 61 14 47
Note:*p<0.05.
Abbreviations:PD-1, programmed death-1; PD-L1, programmed death-ligand 1; TILs, tumor-infiltrating lymphocytes.
Table 3Bivariate Logistic Regression of TILs PD-L1 and PD-1 Expression
PD-L1 Positive/Negative R2 PD-1 ± Positive/Negative R2
HR 0.95 p value HR 0.95 p value
CD3± 7.894 3.004–20.745 <0.001* 0.25 6.303 2.548–15.589 <0.001* 0.217
CD4± 7.544 3.05–18.659 <0.001* 0.257# 5.769 2.40–13.869 <0.001* 0.205
CD8± 8.28 3.243–21.138 <0.001* 0.271# 5.263 2.148–12.894 <0.001* 0.182 FOXP3± 17.182 6.196–47.646 <0.001* 0.423# 10.015 3.869–25.923 <0.001* 0.314# PD-1± 4.739 2.003–11.217 <0.001* 0.166
Notes:*p<0.05;#
R2>0.25.
Abbreviations:−, negative; +, positive; PD-1, programed death-1; PD-L1, programed death-ligand 1; TILs, tumor-infiltrating lymphocytes; R2, Nagelkerke’s R2.
OncoTargets and Therapy downloaded from https://www.dovepress.com/ by 118.70.13.36 on 27-Aug-2020
It has been reported that PD-L1 expression and
clinico-pathological features have no correlation in lung
malignancies.20In our study, the correlations between PD-1 or PD-L1 expression and immune cells were evaluated. In our previous research, PD-L1 expression showed no substantial effect on OS in NSCLC,11and Carvajal-Hausdorf et al showed that PD-L1 protein had no substantial effect on 5-year OS in
SCLC.12In another study, high PD-L1 expression was shown
to be associated with better OS.21In the current study, positive expression of PD-L1 on TILs was more favorable than nega-tive expression with respect to RFS, consistent with the results of Cooper et al.21This might have been because our patients were mostly in the early stages of the disease.
Our results also revealed that higher expression levels of CD3, CD4, CD8, and FOXP3 were associated with better survival, suggesting that TILs could increase
anti-tumor efficacy. TILs are important predictors of
malignancy.22 High expression of CD3 has been shown
to be associated with a good prognosis in SCLC.12,13CD3,
CD4, and CD8 T cell infiltration functions as an
indepen-dent predictor of a favorable result in breast cancer and
esophageal carcinomas.22,23 High TIL infiltration of CD8
was associated with longer OS in NSCLC patients.24,25
The transcription factor FOXP3 is a marker of regulatory T cells. Some studies have indicated an association
between FOXP3 and favorable prognosis;26–28 a
positive group had a better 5-year OS than the
FOXP3-negative group in tonsillar squamous cell carcinoma.27Tao
et al showed that FOXP3 expression in tumors was related
to better prognosis in NSCLC.28 In our study, FOXP3
expression was also associated with better RFS.
In the analysis of RFS subgroups, significant differences were found between groups. Positive expression of PD-1 or PD-L1 combined with a higher ratio of lymphocytes was
associated with significantly better RFS than negative
expression of PD-1 or PD-L1 combined with a lower ratio of lymphocytes. The combination of PD-L1- and CD8-positive TILs (PD-L1+/CD8+) has been suggested to have predictive value in patients with NSCLC, as patients with
high PD-L1+/CD8+ expression have improved survival.24
A low PD-L1+/CD8+ expression group had poor
progres-sion-free survival, whereas that of the high PD-L1−/CD8+
expression group was better.25
To the best of our knowledge, this is thefirst study of immune cells and PD-1 or PD-L1 expression in SCLC. We found that positive expression of PD-1 or PD-L1 com-bined with a higher ratio of certain immune cells (CD3,
CD4, CD8, and FOXP3) was associated with significantly
better survival.
Our study had some limitations. Tumor tissues were all from Shanghai Pulmonary Hospital, so the results may not be representative of the wider population. The cut-off was established using the best value for RFS; OS should also be analyzed.
To conclude, PD-1 and PD-L1 were shown to be cri-tical elements in SCLC that represent potential markers. The correlations among PD-1, PD-L1, and immune cells were evaluated, showing that the expression of PD-1 or
Table 4Cox Regression Analysis
Relapse-Free Survival
Univariate Analysis Multivariate Analysis
HR 95% CI p-value HR 95% CI P-value
Down Up Down Up
CD3± 0.480 0.281 0.820 0.007* 0.964 0.460 2.019 0.923
CD4± 0.450 0.245 0.825 0.010* 0.916 0.407 2.062 0.823
CD8± 0.400 0.206 0.776 0.007* 0.689 0.268 1.772 0.440
FOXP3± 0.376 0.194 0.730 0.004* 0.694 0.252 1.908 0.478
PD-L1 on TILs± 0.417 0.223 0.779 0.006* 0.709 0.313 1.604 0.409
PD-1 on TILs ± 0.602 0.342 1.059 0.078
Age (≥70 vs <70) 1.770 0.997 3.143 0.051
Stage (I/II vs III) 2.111 1.243 3.586 0.006* 1.890 1.100 3.220 0.021*
Smoking status (yes vs no) 1.693 0.990 2.896 0.054
Adjuvant chemotherapy EC/EP (yes vs no) 0.770 0.454 1.305 0.331
Note:*p<0.05.
Abbreviations:−, negative; +, positive; PD-1, programed death-1; PD-L1, programed death-ligand 1; TILs, tumor-infiltrating lymphocytes.
OncoTargets and Therapy downloaded from https://www.dovepress.com/ by 118.70.13.36 on 27-Aug-2020
PD-L1 on TILs was related to CD3, CD4, CD8, and FOXP3. In the survival analysis, a combination of positive expression of PD-L1 or PD-1 with a higher ratio of immune cells (CD3, CD4, CD8, and FOXP3) was asso-ciated with a better RFS than negative expression of PD-L1 or PD-1 combined with a lower ratio of immune cells.
Acknowledgments
This study was supported in part by the Key Program of Natural Science Research of Anhui Provincial Education Department (KJ2018A0813), a grant from the National Natural Science Foundation of China (81802255), the Shanghai Pujiang Program (17PJD036), a grant from the Shanghai Municipal Commission of Health and Family
Planning Program (20174Y0131), the National Key
Research & Development Project (2016YFC0902300), the major disease clinical skills enhancement program three year action plan for promoting clinical skills and clinical innova-tion in municipal hospitals, Shanghai Shen Kang Hospital Development Center Clinical Research Plan of SHDC
(16CR1001A), the “Dream Tutor” Outstanding Young
Talents Program (fkyq1901), Key Disciplines of Shanghai Pulmonary Hospital (2017ZZ02012), and a grant from the
Shanghai Science and Technology Commission
(16JC1405900). Chenglong Sun, Liping Zhang, and Wei Zhang are co-first authors for this study.
Disclosure
The authors report no conflicts of interest in this work.
References
1. Alvarado-Luna G, Morales-Espinosa D. Treatment for small cell lung cancer, where are we now?—a review. Transl Lung Cancer Res. 2016;5(1):26–38. doi:10.3978/j.issn.2218-6751.2016.01.13
2. Rossi A, Di Maio M, Chiodini P, et al. Carboplatin or cisplatin based chemotherapy infirst line treatment of small cell lung cancer.J Clin Oncol.2012;30(14):1692–1698. doi:10.1200/JCO.2011.40.4905 3. Roth BJ, Johnson DH, Einhorn LH, et al. Randomized study of
cyclo-phosphamide, doxorubicin, and vincristine versus etoposide and cispla-tin versus alternation of these two regimens in extensive small-cell lung cancer: a phase III trial of the Southeastern cancer study group.J Clin Oncol.1992;10(2):282–291. doi:10.1200/JCO.1992.10.2.282 4. Horn L, Mansfield AS, Szczęsna A, et al. First-line atezolizumab plus
chemotherapy in extensive-stage small-cell lung cancer.N Engl J Med. 2018;379(23):2220–2229. doi:10.1056/NEJMoa1809064
5. Paz-Ares L, Dvorkin M, Chen Y, et al. Durvalumab plus platinum– etoposide versus platinum–etoposide infirst-line treatment of extensive-stage small-cell lung cancer (CASPIAN): a randomised, controlled, open-label, phase 3 trial. Lancet. 2019;394(10212):1929–1939. doi:10.1016/S0140-6736(19)32222-6
6. Antonia SJ, López-Martin JA, Bendell J, et al. Nivolumab alone and nivolumab plus ipilimumab in recurrent small-cell lung cancer (CheckMate 032): a multicentre, open-label, phase 1/2 trial.Lancet Oncol.2016;17(7):883–895. doi:10.1016/S1470-2045(16)30098-5
7. Ott PA, Elez E, Hiret S, et al. Pembrolizumab in patients with extensive-stage small-cell lung cancer: results from the phase Ib KEYNOTE-028 study. J Clin Oncol. 2017;35(34):3823–3829. doi:10.1200/JCO.2017.72.5069
8. He Y, Yu H, Rozeboom L, et al. LAG-3 protein expression in non-small cell lung cancer and its relationship with PD-1/PD-L1 and tumor-infiltrating lymphocytes. J Thorac Oncol. 2017;12(5):814–823. doi:10.1016/j.jtho.2017.01.019
9. He Y, Jia K, Dziadziuszko R, et al. Galectin-9 in non-small cell lung cancer. Lung Cancer. 2019;136:80–85. doi:10.1016/j.lungcan.2019.08. 014
10. Gettinger S, Herbst RS. B7-H1/PD-1 blockade therapy in non-small cell lung cancer: current status and future direction. Cancer J. 2014;20(4):281–289. doi:10.1097/PPO.0000000000000063 11. He Y, Rozeboom L, Rivard CJ, et al. PD-1, PD-L1 protein expression
in non-small cell lung cancer and their relationship with tumor infiltrating lymphocytes. Med Sci Monit. 2017;23:1208–1216. doi:10.12659/MSM.899909
12. Carvajal-Hausdorf D, Altan M, Velcheti V, et al. Expression and clinical significance of PD-L1, B7-H3, B7-H4 and TILs in human small cell lung Cancer (SCLC).J Immunother Cancer.2019;7(1):65. doi:10.1186/s40425-019-0540-1
13. Zhao X, Kallakury B, Chahine JJ, et al. Surgical resection of SCLC: prognostic factors and the tumor microenvironment.J Thorac Oncol. 2019;14(5):914–923. doi:10.1016/j.jtho.2019.01.019
14. Schultheis AM, Scheel. AH, Ozretić L, et al. PD-L1 expression in small cell neuroendocrine carcinomas. Eur J Cancer Clin Oncol. 2015;51:421–426.
15. Ishii H, Azuma K, Kawahara A, et al. Significance of programmed cell death-ligand 1 expression and its association with survival in patients with small cell lung cancer. J Thorac Oncol. 2015;10 (10):426–430. doi:10.1097/JTO.0000000000000414
16. Schultheis AM, Scheel AH, OzretićL, et al. PD-L1 expression in small cell neuroendocrine carcinomas. Eur J Cancer. 2015;51 (3):421–426. doi:10.1016/j.ejca.2014.12.006
17. Takamori S, TAKADA K, AZUMA K, et al. Prognostic impact of PD-L2 expression and association with PD-L1 in patients with small-cell lung cancer. Anticancer Res. 2018;38(10):5903–5907. doi:10.21873/anticanres.12934
18. Shinchi Y, Komohara Y, Yonemitsu K, et al. Accurate expression of PD-L1/L2 in lung adenocarcinoma cells: a retrospective study by double immunohistochemistry.Cancer Sci.2019;110(9):2711–2721. doi:10.1111/cas.14128
19. Calles A, Liao X, Sholl LM, et al. Expression of PD-1 and its ligands, PD-L1 and PD-L2, in smokers and never smokers with KRAS-mutant lung cancer.J Thorac Oncol.2015;10(12):1726–1735. doi:10.1097/ JTO.0000000000000687
20. Konishi J, Yamazaki. K, Azuma M, et al. B7-H1 expression on non-small cell lung cancer cells and its relationship with tumor-infiltrating lymphocytes and their PD-1 expression. Clin Cancer Res. 2004;10(15):5049–5100. doi:10.1158/1078-0432.CCR-04-0428
21. Cooper WA, Tran T, Vilain RE, et al. PD-L1 expression is a favorable prognostic factor in early stage non-small cell carcinoma. Lung Cancer.2015;89(2):181–188. doi:10.1016/j.lungcan.2015.05.007 22. Rathore AS, Kumar S, Konwar R, Makker A, Negi MP, Goel MM.
CD3+, CD4+ & CD8+ tumour infiltrating lymphocytes (TILs) are predictors of favourable survival outcome in infiltrating ductal carci-noma of breast.Indian J Med Res.2014;140(3):361–369.
23. Schumacher K, Haensch W, Roefzaad C, Schlag PM. Prognostic significance of activated CD8(+) T cell infiltrations within esophageal carcinomas.Cancer Res.2001;61(10):3932.
24. Yang H, Shi J, Lin D, et al. Prognostic value of PD-L1 expression in combination with CD 8+ TIL s density in patients with surgically resected non-small cell lung cancer.Cancer Med.2018;7(1):32–45. doi:10.1002/cam4.1243
OncoTargets and Therapy downloaded from https://www.dovepress.com/ by 118.70.13.36 on 27-Aug-2020
25. Tokito T, Azuma K, Kawahara A, et al. Predictive relevance of PD-L1 expression combined with CD8+ TIL density in stage III non-small cell lung cancer patients receiving concurrent chemoradiotherapy. Eur J Cancer.2016;55:7–14. doi:10.1016/j.ejca.2015.11.020
26. Ladoire S, Arnould L, Mignot G, et al. Presence of Foxp3 expression in tumor cells predicts better survival in HER2-overexpressing breast cancer patients treated with neoadjuvant chemotherapy.Breast Cancer Res Treat.2011;125(1):65–72. doi:10.1007/s10549-010-0831-1
27. Park K, Cho KJ, Lee M, Yoon DH, Kim SB. Importance of FOXP3 in prognosis and its relationship with p16 in tonsillar squamous cell carcinoma.Anticancer Res.2013;33(12):5667–5673.
28. Tao H, Mimura Y, Aoe K, et al. Prognostic potential of FOXP3 expression in non-small cell lung cancer cells combined with tumor-infiltrating regulatory T cells. Lung Cancer. 2012;75 (1):95–101. doi:10.1016/j.lungcan.2011.06.002
OncoTargets and Therapy
Dove
press
Publish your work in this journal
OncoTargets and Therapy is an international, peer-reviewed, open access journal focusing on the pathological basis of all cancers, potential targets for therapy and treatment protocols employed to improve the management of cancer patients. The journal also focuses on the impact of management programs and new therapeutic
agents and protocols on patient perspectives such as quality of life, adherence and satisfaction. The manuscript management system is completely online and includes a very quick and fair peer-review system, which is all easy to use. Visit http://www.dovepress.com/ testimonials.php to read real quotes from published authors.
Submit your manuscript here:https://www.dovepress.com/oncotargets-and-therapy-journal
OncoTargets and Therapy downloaded from https://www.dovepress.com/ by 118.70.13.36 on 27-Aug-2020