*Address for correspondence
E-mail: dimalgroup@gmail.com
Development and Validation of a Liquid
Chromatographic Method for Estimation of Dicyclomine
Hydrochloride, Mefenamic Acid and Paracetamol in
Tablets
D. A. SHAH*, JAINIKA P. RANA, USMANGANI K. CHHALOTIYA, S. L. BALDANIA AND K. K. BHATT
Indukaka Ipcowala College of Pharmacy, Beyond GIDC, P. B. No. 53, Vitthal Udyognagar‑388 121, India
Shah, et al.: LC method for Estimating Dicyclomine, Mefenamic Acid and Paracetamol
Liquid chromatographic method was developed for simultaneous quantitative determination of dicyclomine hydrochloride, mefenamic acid and paracetamol in their combined dosage form. The separation was achieved using a C18 column (250×4.6 mm id, 5 µm) using acetonitrile:20 mM potassium dihydrogen phosphate 70:30 (v/v) adjusted to pH 4 using orthophosphoric acid as mobile phase at a flow rate of 1 ml/min and detection at 220 nm. Separation was completed within 12 min. The retention times of dicyclomine hydrochloride, mefenamic acid and paracetamol were 3.8, 9.3 and 2.5 minutes respectively. The proposed method was found to have linearity in concentration range of 10–100 µg/ml for dicyclomine hydrochloride, 0.05‑10 µg/ml for mefenamic acid and 0.1−20 µg/ml for paracetamol. The developed method has been statistically validated and was found to be simple, precise, reproducible and accurate. The developed and validated method was successfully used for the quantitative analysis of commercially available dosage form.
Key words: RP‑HPLC, validation, dicyclomine hydrochloride, mefenamic acid, paracetamol
Dicyclomine hydrochloride (DIC) is [1,1’‑bicyclohexyl‑1‑ carboxylic acid 2‑(diethylamino) ethyl ester having empirical formula C19H35NO2.HCl with a molecular weight of 345.96. DIC is an anticholinergic and antispasmodic drug, a medication that reduces the effect of acetylcholine by blocking the cholinergic receptors on the smooth muscle. It also has a direct relaxing effect on smooth muscle. Mefenamic acid (MEF), 2‑[(2,3‑dimethyl‑phenyl) amino] benzoic acid has the empirical formula C15H15NO2 with a molecular weight of 241.28. MEF is a nonsteroidal antiinflammatory, analgesic and antipyretic drug used to treat pain, including menstrual pain. It inhibits the enzymes cyclooxygenase COX‑1 and COX‑2 to reduce the formation of prostaglandins and leukotrienes. Paracetamol (PCM) is 4’‑hydroxyacetanilide having empirical formula C8H9NO2with molecular weight 151.16. PCM is a popular analgesic and antipyretic drug that is used for the relief of fever, headaches,
other minor aches and pains. It acts primarily in the CNS, increasing the pain threshold by inhibiting both isoforms of cyclooxygenase, COX‑1 and COX‑2, enzymes involved in prostaglandin (PG) synthesis[1,2].
The combined dosage form is used to treat a certain type of intestinal problem called irritable bowel syndrome. It helps to reduce the symptoms of stomach and intestinal cramping. This medication works by slowing the natural movements of the gut and by relaxing the muscles in the stomach and intestines. This combination is highly effective and used in the treatment of spasmodic dysmenorrhoea, intestinal colic, biliary colic, ureteric colic[3].
A literature survey regarding quantitative analysis of these drugs revealed that attempts have been made to develop analytical methods for the estimation of dicyclomine alone and in combination with other drugs by liquid chromatographic method[4], HPTLC methods[5‑8] and spectrophotometric method[9]. For the estimation of mefenamic acid alone and
in combination with other drugs various liquid chromatographic methods[10‑14] and spectrophotometric methods[15‑21] methods have been reported. Different analytical methods have been reported for the estimation of paracetamol alone and in combination with other drugs like spectrophotometry[22‑26], liquid chromatography[27‑37] and HPTLC[38‑40]. An RP‑HPLC method[41] has recently been reported for the estimation of this drug combination. Present study involves development of a sensitive liquid chromatographic method for the estimation of DIC, MEF and PCM in tablet dosage form compared to reported method.
MATERIALS AND METHODS
Analytically pure DIC and MEF were obtained as gift samples from Balaji Laboratory limited, Mumbai, India and PCM was obtained as gift sample from Zydus Cadila Ltd., Ahmedabad, India, respectively. HPLC grade acetonitrile and water were obtained from SRL Ltd., Mumbai, India. Potassium dihydrogen phosphate and orthophoshoric acid were of analytical reagent grade obtained from S. D. Fine Chem Ltd., Mumbai. Marketed tablet formulation A (Cyclopam plus, Indoco Remedies, India) and B (Trigan MF, Cadila Pharmaceuticals Ltd., India) containing labeled amount of 20 mg of diclyclomine, 250 mg of mefenamic acid and 500 mg of paracetamol were procured from the market. The liquid chromatographic system consist of PerkinElmer series 200 LC (Shelton, USA) equipped with a series 200 UV detector, series 200 quaternary gradient pump and manual injector rheodyne valve with 20 µl fixed loop. The analytes were monitored at 220 nm. Chromatographic analysis was performed on a Brownlee C18 column having 250×4.6 mm i.d. and 5‑µm particle size. All the drugs and chemicals were weighed on Shimadzu electronic balance (AX200, Shimadzu Corp., Japan). The mobile phase was degassed by ultrasonic vibrations prior to use. All determinations were performed at ambient temperature.
Chromatographic conditions:
The Brownlee C18 column was equilibrated with the mobile phase, acetonitrile:20 mM potassium dihydrogen phosphate 70:30 (v/v); pH 4. The flow rate was maintained at 1 ml/min. Eluent were monitored with UV detector at 220 nm, and the injection volume was 20 µl. Total run time was kept 12 min.
Preparation of standard stock solutions:
DIC, MEF and PCM were weighed (10 mg each) and transferred to three separate 10 ml volumetric flasks and dissolved in few milliliters of mobile phase. Volumes were made up to the mark with mobile phase to yield a solution containing 1000 µg/ml of each drug. Aliquot from the stock solutions of DIC, MEF and PCM were appropriately diluted with mobile phase to obtain working standard of 100 µg/ml of DIC, MEF and PCM, respectively.
Method validation:
The method was validated for accuracy, precision, linearity, detection limit, quantitation limit and robustness. Linearity was ascertained by taking appropriate aliquots of DIC, MEF and PCM working standard solutions in different 10 ml volumetric flasks and diluted up to the mark with mobile phase to obtain final concentrations of 10, 30, 50, 70,
100 µg/ml of DIC, 0.05, 0.25, 1, 5, 10 µg/ml of
MEF, 0.1, 0.5, 2, 10, 20 µg/ml of PCM, respectively. The solutions were injected using a 20 µl fixed loop system and chromatograms were recorded. Calibration curves were constructed by plotting average peak area versus concentrations and regression equations were computed for all the drugs.
Repeatability studies were carried out by estimating response of DIC (50 µg/ml), MEF (1 µg/ml) and PCM (2 µg/ml) six times and results are reported in terms of relative standard deviation. The intra‑day and inter‑day precision studies (intermediate precision) were carried out by estimating the corresponding responses 3 times on the same day and on 3 different days for three different concentrations of DIC (30, 50, 100 µg/ml), MEF (0.25, 1, 10 µg/ml) and PCM (0.5, 2, 20 µg/ml) and the results are reported in terms of relative standard deviation.
Accuracy of the developed method was determined by method of standard additions. Known amount of DIC (0, 15, 30, 45 µg/ml), MEF (0, 1.25, 2.5, 5 µg/ml) and PCM (0, 2.5, 5, 7.5 µg/ml) were added to a pre quantified sample solution, and the amount of DIC, MEF and PCM were estimated by measuring the peak areas and by fitting these values to the straight‑line equation of calibration curve.
quantification (LOQ) of an individual analytical procedure is the lowest amount of analyte that can be quantitatively determined with suitable precision and accuracy. LOD and LOQ were calculated using following Eqns. as per ICH guidelines, LOD=3.3×σ/S and LOQ=10×σ/S, where σ is the standard deviation of y‑intercepts of regression lines and S is the slope of the calibration curve.
Robustness was studied by evaluating the effect of small but deliberate variations in the chromatographic conditions. The conditions studied were flow rate (altered by ±0.2 ml/min) and percentage of organic phase. Stability of sample solutions were studied at 25±2° for 24 h. System suitability test was an integral part of the method development to verify that the system is adequate for the analysis of DIC, MEF and PCM to be performed. System suitability test of the chromatography system was performed before validation of the method. Five replicate injections of same concentration (50 µg/ml of DIC, 1 µg/ml of MEF, 2 µg/ml of PCM) of system suitability standards and one injection of a check standard were made. Area, retention time (RT), asymmetry factor, and theoretical plates for the five suitability injections were determined.
Analysis of marketed formulation:
Twenty tablets were weighed accurately and finely powdered. Tablet powder equivalent to 20 mg DIC (250 mg of MEF and 500 mg of PCM) was taken in 100 ml volumetric flask. Methanol (50 ml) was added to the above flask and the flask was sonicated for 15 min. The solution was filtered using
Whatman filter paper No. 41 and volume was made up to the mark with the mobile phase. Appropriate volume of the aliquot was transferred to a 10 ml volumetric flask and the volume was made up to the mark with the mobile phase to obtain a solution containing 30 µg/ml of DIC. This solution was used for the estimation of DIC. The solution is further diluted with mobile phase to obtain 2.5 µg/ml MEF and 5 µg/ml of PCM, respectively. Both the solutions were sonicated for 10 min. Solutions were injected as per the above chromatographic conditions and peak areas were recorded. The quantifications were carried out by keeping these values to the straight line equation of calibration curve.
RESULTS AND DISCUSSION
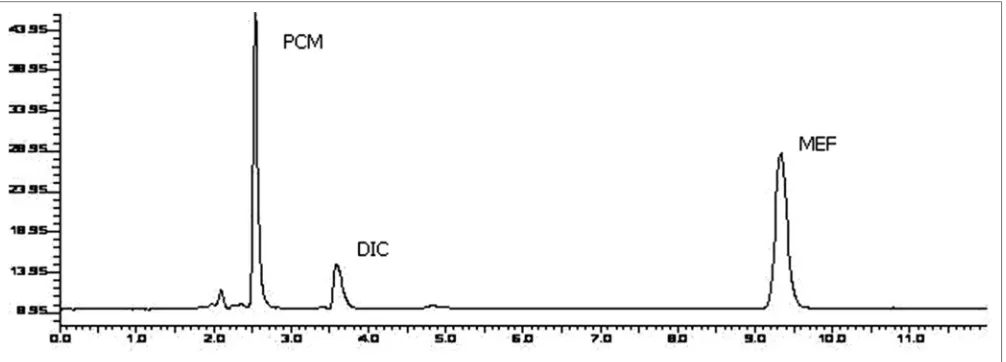
The objective of the method development was to resolve chromatographic peaks for active drug ingredients with less asymmetric factor. The mobile phase acetonitrile:20 mM potassium dihydrogen phosphate (70:30 v/v) adjusted to pH 4 using orthophosphoric acid was found to be satisfactory which gave three symmetric and well‑resolved peaks for DIC, MEF and PCM. The retention times of DIC, MEF and PCM were 3.8, 9.3 and 2.5 min, respectively (fig. 1). The resolution between DIC, MEF and PCM was found to be more than 2, which indicates good separation of all the compounds. The asymmetric factors for DIC, MEF and PCM were 1.36, 1.14, 1.44, respectively. The mobile phase flow rate was maintained at 1 ml/min. Overlaid UV spectra of both the drugs showed that DIC, MEF and PCM absorbed appreciably at 220 nm, so detection was carried out at 220 nm.
Fig. 1: Chromatogram of standard PCM, DIC and MEF.
Linearity was evaluated by analysis of working standard solutions of DIC, MEF and PCM of five different concentrations and the method was found to be linear in the range of 10–100 µg/ml for DIC, 0.05–10 µg/ml for MEF and 0.1–20 µg/ml for PCM, respectively. The regression data obtained are represented in Table 1. Instrument precision was determined by performing injection repeatability test and the relative standard deviation values for DIC, MEF and PCM were found. The intra‑day and inter‑day precision studies were carried out for three concentrations of DIC, MEF and PCM and the results are reported in Table 2. The accuracy of the method was determined by calculating recoveries of DIC, MEF and PCM by method of standard addition. Recoveries were found to be 97.83–99.26, 98.98–99.53 and 99.79–100.16% for DIC, MEF and PCM, respectively (Table 2). Recovery studies were performed in triplicate. The LOQ for DIC, MEF and PCM were found to be 10, 0.05 and 0.1 µg/ml respectively. The LOD for DIC, MEF and PCM were found to be 3, 0.0125 and 0.033 µg/ml respectively (Table 2). Robustness study was performed by deliberately changing the experimental conditions like flow rate from 1 ml/min to 0.8 ml/min and 1.2 ml/min. The composition of mobile phase was changed varying the proportion of acetonitrile by 5%. In both the conditions the recovery of all the drugs were determined and the RSD was found to be less than 2%. Solution stability of DIC, MEF and PCM were evaluated at room temperature for 24 h. All the drugs were found to be stable with a recovery of more than 98%. System suitability parameters such as the number of theoretical plates, resolution, and peak assymetry were determined and reported in Table 2. The proposed method was successfully applied to the determination of DIC, MEF and PCM in their combined dosage form. The % recovery was found to be respectively, for DIC, MEF and PCM, which were comparable with the corresponding labeled amounts (Table 3).
Proposed study describes LC method for the estimation of DIC, MEF and PCM combination in mixture. The method was validated and found to be simple, sensitive, accurate and precise. Compared to reported RP‑HPLC method (Lokhande et al. 2012)[41], the developed method is more sensitive. In reported method, the linearity was found to be in the range of 2000‑4500 µg/ml for DIC,
25‑150 µg/ml for MEF and 50‑300 µg/ml for PCM, respectively while the linearity in developed method was found to be in the range of 10‑100 µg/ml for DIC, 0.05‑10 µg/ml for MEF and 0.1‑20 µg/ml for PCM. The developed method contains simple mobile phase compared to reported method Statistical comparision of reported and developed method was carried out by F‑test. F calculated value (2.34) was less than F tabulated value (19), which indicates that there is no statistical significance difference (95% confidence interval) between two methods. Study proved that method was repeatable and selective for the analysis of DIC, MEF and
TABLE 1: REGRESSION ANALYSIS OF CALIBRATION CURVE
Parameters DIC MEF PCM
Linearity range (μg/ml) 10‑100 0.05–10 0.1–20 Correlation coefficient (r) 0.9966 0.9957 0.9977 Slope 683.8 144986.2 43065.0 Standard deviation of slope 7.8 927.4 204.4 Intercept 732.9 34778 26645 Standard deviation of intercept 169.4 1562.4 404.6
DIC: Dicyclomine hydrochloride, MEF: mefenamic acid, PCM: paracetamol
TABLE 2: SUMMARY OF VALIDATION AND SYSTEM SUITABILITY PARAMETERS
Parameters DIC MEF PCM
Retention time (min) 3.6 9.3 2.5 Theoretical plates 5600 5898 6340 Resolution 6.5 23.7 ‑ Peak asymmetry 1.36 1.14 1.44 Detection limit (μg/ml) 3 0.0125 0.033 Quantitation limit (μg/ml) 10 0.05 0.1 Recovery (%) 97.83‑99.26 98.98‑99.53 99.79‑100.16 Precision (RSD, %)
Intra‑day precision (n=3) 0.63‑1.22 0.62‑0.92 0.75‑0.97 Inter‑day precision (n=3) 1.45‑1.71 1.07‑1.28 1.29‑1.60 Instrument precision
(RSD, %) 0.51 0.36 0.12
RSD is relative standard deviation and ‘n’ is number of determinations. DIC: Dicyclomine hydrochloride, MEF: mefenamic acid, PCM: paracetamol
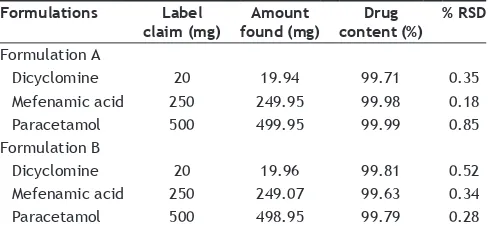
TABLE 3: ANALYSIS OF MARKETED FORMULATION
Formulations Label
claim (mg) found (mg)Amount content (%)Drug % RSD
Formulation A
Dicyclomine 20 19.94 99.71 0.35 Mefenamic acid 250 249.95 99.98 0.18 Paracetamol 500 499.95 99.99 0.85 Formulation B
Dicyclomine 20 19.96 99.81 0.52 Mefenamic acid 250 249.07 99.63 0.34 Paracetamol 500 498.95 99.79 0.28
PCM in combination without any interference from the excipients. The method was successfully used for determination of drugs in their pharmaceutical formulations.
REFERENCES
1. O’Nell MJ, editor. The Merck Index. 13th ed. New Jersey: Merck and Co. Inc; 2006. p. 545, 1036.
2. Brown JH, Taylor P, Robert LJ, Marrow JD. Autacoids, Drug therapy of
inflammation and Analgesic – Antipyretic, Antiinflammatory agents. In:
Gilman AG, Hardman JG, Limbird LE, editors. Goodman and Gilman’s the pharmacological basis of therapeutics. New York: McGraw Hill Publication; 2001. p. 703‑8.
3. Kulkarni KS. Antispasmodics – A New Perspective, J Am Med Assn (India) 2001;8:119‑21.
4. Prajapati D, Raj H. Simultaneous estimation of mefenamic acid and dicyclomine hydrochloride by RP‑HPLC method. Int J Pharm Biosci 2012;3:611‑25.
5. Dhaneshwar SR, Surana AL, Bhusari VK, Rasal KS. Validated HPTLC method for nimesulide and dicyclomine hydrochloride in formulation. J Pharm Res 2011;4:2288‑90.
6. Nanaware DA, Bhusari VK, Dhaneshwar SR. Application of high performance thin layer chromatographic method for the simultaneous determination of omeprazole and dicyclomine hydrochloride in bulk drug and tablet formulation. Int J Pharm Tech 2012;4:4392‑403. 7. Nanda RK, Potawale SE, Bhagwati VV, Deshmukh RS, Deshpande PB.
Development and validation of HPTLC method for simultaneous densitometric analysis of ranitidine hydrochloride and dicyclomine hydrochloride as the bulk drugs and in the tablet dosage form. J Pharm Res 2010;3:1997‑9.
8. Potawale SE, Nanda RK, Bhagwat VV, Hamane SC, Deshmukh RS, Puttamsetti K. Development and validation of a HPTLC method for simultaneous densitometric analysis of diclofenac potassium and dicyclomine hydrochloride as the bulk drugs and in the tablet dosage form. J Pharm Res 2011;9:3116‑8.
9. Bebawy LI, Issa YM, Abdel Moneim KM. Use of π Acceptors for spectrophotometric determination of dicyclomine hydrochloride. J AOAC Int 2003;86:1‑7.
10. Murali KR, Buela M, Sahithi A. Estimation of mefenamic acid in pharmaceutical dosage forms by RP‑HPLC. Int J Chem Sci 2011;9:1587‑94.
11. Wahab SU, Mohamed FP, Mohamed HS, Chandran M, Kadher MS. Development of RP‑HPLC method for the simultaneous determination of mefenamic acid and drotaverine HCl combined tablet dosage form. Int J Pharm Sci 2011;3:115‑7.
12. Padmalatha H, Vidyasagar G. Validated RP‑HPLC method for the estimation of mefenamic acid in formulation. Int J Res Pharm Biomed Sci 2011;2:1261‑5.
13. Dahivelkar PP, Bari SB, Bhoir S, Bhagwat AM. High performance liquid chromatographic estimation of drotaverine hydrochloride and mefenamic Acid in human plasma. Iran J Pharm Res 2009;8:209‑15. 14. Hung CY, Hwang CC. Analysis of ketoprofen and mefenamic Acid
by HPLC with molecularly imprinted polymer as the stationary phase. J Chromatogr Sci 2008;46:1‑6.
15. Prajapati D, Raj H. Simultaneous estimation of mefenamic acid and dicyclomine hydrochloride by spectroscopic methods. Int J Pharm Sci Res 2012;3:3766‑76.
16. Alarfaj NA, Altamimi SA, Almarshady LZ. Spectrophotometric determination of mefenamic acid in pharmaceutical preparations. Asian J Chem 2009;21:217‑26.
17. Dahivelkar PP, Mahajan VK, Bari SB, Shirkhedkar AA, Fursule RA, Surana SJ. Simultaneous derivative and multi‑component spectrophotometric determination of drotaverine hydrochloride and
mefenamic acid in tablets. Indian J Pharm Sci 2007;69:812‑4. 18. Goyal A, Singhvi I. Spectrophotometric estimation of ethamsylate
and mefenamic acid from a binary mixture by dual wavelength and simultaneous equation methods. Indian J Pharm Sci 2008;70:108‑11. 19. Anudeepa J, Sivasakthi R, Senthil Kumar C, Ramya R, Rajendran SS,
Venkatnarayanan J. Development and validation of RP‑HPLC and UV‑spectrophotometric method for mefanamic acid and drotaverin hydrochloride in combined dosage form. Der Pharmacia Lettre 2011;3:250‑6.
20. Subramanian N, Devipriya DT, Venkateshwaran K, Chandrasekar P. Spectrophotometric determination of tranexamic acid and mefenamic acid in tablet dosage form using derivatization technique. Int J Pharm Biomed Res 2011;2:26‑9.
21. Idowu SO, Tambo SC, Adegoke AO, Olaniyi AA. Novel colorimetric assay of mefenamic acid using 4‑ amino‑3,5‑dinitrobenzoic acid (ADBA). Trop J Pharm Res 2002;1:15‑22.
22. Karnik AM, Choudhari VP, Sharma S, Murkute S, Patole V. Spectrophotometric simultaneous determination of mefenamic acid and paracetamol in combined tablet dosage form by dual wavelength, area under curve and absorbance corrected method. J Pharm Res Clin Pract 2012;2:43‑8.
23. Chitlange SS, Soni R, Wankhede SS, Kulkarni AA. Spectrophotometric methods for simultaneous estimation of dexibuprofen and paracetamol. Asian J Res Chem 2009;2:30‑3.
24. Gondalia R, Mashru R, Savaliya P. Development and validation of spectrophotometric methods for simultaneous estimation of ibuprofen and paracetamol in soft gelatin capsule by simultaneous equation method. Int J Chem Tech Res 2010;2:1881‑5.
25. Khan F, Sagar DL, Vivake ST, Lohiya RT, Umekar MJ. Development of UV spectrophotometric method for the simultaneous estimation of piroxicam and paracetamol in tablet by simultaneous equation, absorbance ratio and absorbance correction method. J Pharm Res 2010;3:1432‑3. 26. Sawant R, Bhangale L, Joshi R, Lanke P. Validated spectrophotometric
methods for simultaneous estimation of paracetamol, domperidone and tramadol HCl in pure and tablet dosage form. J Chem Metro 2010;4:21‑7.
27. Akay C, Degim IT, Sayal A, Aydin A, Ozkan Y, Gul H. Rapid and simultaneous determination of acetylsalicylic acid, paracetamol, and their degradation and toxic impurity products by HPLC in pharmaceutical dosage forms. Turk J Med Sci 2008;38:167‑73. 28. Altun LM. HPLC Method for the Analysis of paracetamol, caffeine and
dipyrone. Turk J Med Sci 2002;26:521‑8.
29. Balan P, Nimila IC, Movva VR, Lakshmi PM, Rajasekar S. A Validated RP‑HPLC method for estimation of dexibuprofen and paracetamol in combined tablet dosage form. Int J Pharm Tech Res 2011;3:1293‑8. 30. Birajdar AS, Meyyanathan SN, Suresh B. Method Development and
validation for the simultaneous determination of paracetamol and tramadol in solid dosage form by RP‑HPLC. Int J Pharm Res Dev 2010;1:1‑6.
31. Jain DK, Patel P, Chandel HS, Kushwaha A, Jain N. Development and validation of reversed phase‑high‑performance liquid chromatography method for determination of paracetamol and lornoxicam in tablet dosage form. Pharm Anal J 2011;2:42‑6.
32. Karunakaran K, Navaneethan G, Elango KP. Development and validation of a stability‑indicating RP‑HPLC method for simultaneous determination of paracetamol, tramadol HCl and domperidone in a combined dosage form. Trop J Pharm Res 2012,11:99‑106.
33. Momin MY Yeole PG, Puranik MP, Wadher SJ. Reverse phase HPLC method for determination of aceclofenac and paracetamol in tablet dosage form. Indian J Pharm Sci 2006;68:387‑9.
34. Mulla TS, Rao JR, Yadav SS, Bharekar VV, Rajput MP. Development and validation of HPLC method for simultaneous quantitation of paracetamol and dexketoprofen in bulk drug and formulation. Int J Compre Pharm 2011;7:1‑4.
simultaneous determination of paracetamol and diclofenac potassium on stainless steel surface of pharmaceutical manufacturing equipments. J Chem Pharm Res 2012;4:1670‑5.
36. Narayana S, Kumar P, Sindhu RK, Tiwari A, Ghosh M. Simultaneous analysis of Paracetamol and Tramadol – Analytical method development and validation. Der Pharma Chemica 2009;1:72‑8.
37. Reddy PB, Reddy MS. RP‑HPLC method for simultaneous estimation of paracetamol and ibuprofen in tablets. Asian J Res Chem 2009;2:70‑2. 38. Khatal LD, Kamble AY, Mahadik MV, Dhaneshwar SR. Validated
HPTLC method for simultaneous quantitation of paracetamol, diclofenac potassium, and famotidine in tablet formulation. J AOAC Int 2010;93:765‑70.
39. Rao MN. Development and validation of stability indicating HPTLC method for simultaneous estimation of paracetamol, aceclofenac and rabeprazole in combined tablet dosage formulation. Int J PharmTech Res 2011;3:909‑18.
40. Shirkhedkar AA, Shaikh AM, Surana SJ. Simultaneous determination of paracetamol and piroxicam in tablets by thin layer chromatography combined with densitometry. Eur J Anal Chem 2008;3:258‑67.
41. Lokhande SR, Mhetre SM, Pekamwar SS, Kalyankar TM. Development and validation of reverse phase HPLC method for simultaneous estimation of dicyclomine hydrochloride, mefenamic acid and paracetamol in tablet dosage form. World J Pharm Pharm Sci 2012;1:968‑80.