EFFECTS OF PROCESS PARAMETERS ON
MATERIAL REMOVAL RATE IN WEDM USING
EXPERIMENTAL DESIGN
Pawan Bishnoi
1,
Dinesh Sindhu
2, Naresh Panchal
31
Assistant Professor,
3B.Tech Scholar, Department of Mechanical Engineering
,
V
edant College of Engineering & Technology ,Bundi ,Rajasthan, (India)
2
Research Scholar, Department of Mechanical Engineering
,
National Institute of
Technology
Kurukshetra ,Haryana, (India)
ABSTRACT
Wire electrical discharge machining (WEDM) is a specialized thermal machining process capable of accurately
machining parts with varying hardness or complex shapes, which have sharp edges that are very difficult to be
machined by the conventional machining processes. The development of new advanced engineering materials
and the need to meet demand for precise and flexible prototype and low-volume production of components has
made wire electrical discharge machining (WEDM) an important manufacturing process. Wire Electrical
Discharge Machining (WEDM) is a widely accepted non-traditional material removal process used to
manufacture components with intricate shapes and profiles. WEDM utilizes a continuously travelling wire
electrode made of Cu, brass or tungsten of diameter 0.05 -0.30mm, capable of achieving very small corner
radii. The wire is kept in tension using a mechanical tensioning device reducing the tendency of producing
inaccurate parts. During the WEDM process, the material is eroded ahead of the wire and there is no direct
contact between the work piece and the wire electrode, eliminating the mechanical stresses during machining.
The effects of various process parameters of WEDM pulse on time (Ton), pulse off time (Toff), gap voltage (SV),
peak current (IP), have been investigated to reveal their impact on material removal rate. The experimental
plan is performed by a standard RSM design called central composite design. The experimental studies were performed on ELECTRONICA SPRINTCUT WEDM machine. It is concluded from the study that the material
removal rate (MRR) increases with increase in pulse on time (Ton) and peak current (IP) while if decreases
with increase in pulse off time (Toff) and servo voltage (SV).
Keywords-Component: IP Peak Current, Mrr Material Removal Rate, Rsm Response Surface
Methodology, SV Servo Voltage , Toff Pulse Off Time, Ton Pulse on Time, µm Micro Meter
I. INTRODUCTION
Wire Electric Discharge Machining (WEDM) is a non-traditional process of material removal from electrically
spark erosion. These sparks are produced between the work piece and a wire electrode (usually less than 0.30
mm diameter) separated by a dielectric fluid and erodes the work piece to produce complex two and three
dimensional shapes according to a numerically controlled pre-programmed path. The sparks produce heating
and melt work piece surface to form debris which is then flushed away by dielectric pressure. During the cutting
process there is no direct contact between the work piece and the wire electrode. The wire electrical discharge
machining (WEDM) has become an important non-traditional machining process because it can machine the
difficult-to-machine materials like titanium alloys and zirconium which cannot be machined by conventional
machining processes.
Wire electrical discharge machining (WEDM) is a specialized thermal machining process capable of accurately
machining parts with varying hardness or complex shapes, which have sharp edges that are very difficult to be
machined by the main stream machining processes. The development of new advanced engineering materials
and the need to meet demand for precise and flexible prototype and low-volume production of components have
made wire electrical discharge machining (WEDM) an important manufacturing process.The basic mechanism
of metal removal in WEDM is identical to conventional EDM. Instead of moving electrode (as in EDM), the
electrode in this process is a moving wire of copper or brass. A vertically oriented wire is fed into the work
piece continuously travelling from a supply spool to a take up spool. For this purpose a hole is pre-drilled in the
work piece, through which the wire electrode will pass. A constant gap between tool and work piece is
maintained with the help of computer controlled positioning system. This system is used to cut through
complicated contours especially in difficult-to-machine materials. This process gives a high degree of accuracy
and a good surface finish. Wire Electrical Discharge Machining (WEDM) is a widely accepted non-traditional
material removal process used to manufacture components with intricate shapes and profiles. It utilizes a
continuously travelling wire electrode made of Cu, brass or tungsten of diameter 0.05 -0.3mm, capable of
achieving very small corner radii. The wire is kept in tension using a mechanical tensioning device reducing the
tendency of producing inaccurate parts. During the WEDM process, the material is eroded ahead of the wire and
there is no direct contact between the work piece and the wire electrode, eliminating the mechanical stresses
during machining. In addition, the WEDM process is able to machine exotic and high strength and temperature
resistant materials and eliminates the geometrical changes occurring in the machining of heat-treated steels.
WEDM equipment first appeared in the early 1960s, and performed simple machining utilizing the phenomenon
of electrical spark. The first five-head WEDM arrived in the United States in December, 1980. In today’s
WEDM it is possible to program wire to follow a complex path in two axes. Hence, it is possible to use this
machine tool for making dies for stamping fine blanking and extrusion as well as 2-D through holes. It is
possible to tilt the wire in position other than perpendicular to X and Y axes. It is possible to perform 3-D
cutting using WEDM in which two additional axes have been introduced. The drive motors which tilt the wire
Figure 1 Schematic representation of WEDM cutting process.
II. RESPONSE SURFACE METHODOLOGY (RSM) AND CENTRAL COMPOSITE
DESIGN
Response surface methodology (RSM) is defined as a collection of mathematical and statistical methods that are
used to develop, improve, or optimize a product or process. The method was introduced by Box and Wilson in
1951. The main idea of RSM is to use a sequence of designed experiments to obtain an optimal response. It
comprises statistical experimental designs, regression modelling techniques, and optimization methods. Most
applications of RSM involve experimental situations where several independent (or control) variables
potentially impact one or more response variable. The independent variables are controlled by the experimenter,
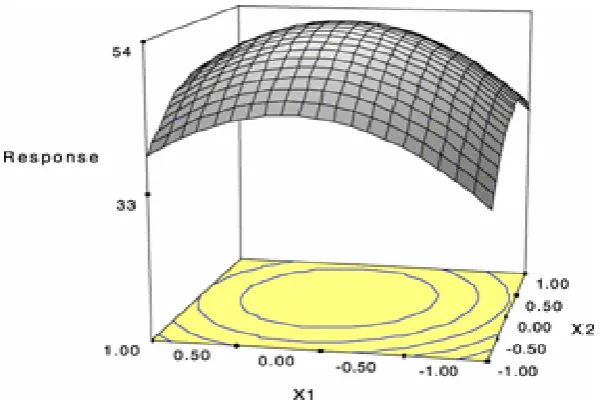
in a designed experiment, while the response variable is an observed output of the experiment. Fig. 2 illustrates
the estimated relationship between a response variable and the two independent variables x1 and x2.
2.1 Steps Involved In Rsm
The following steps are involved in RSM for developing an empirical model through a sequential program of
experimentation
1. At first some ideas are generated concerning which factors or variables are likely to be important in
response surface study. It is usually called a screening experiment. The objective of factor screening is to
reduce the list of candidate variables to a relatively few so that subsequent experiments will be more
efficient and require fewer runs or tests. The purpose of this phase is the identification of the important
independent variables.
2. The experimenter’s objective is to determine if the current settings of the independent variables result in a
value of the response that is near the optimum. If the current settings or levels of the independent variables
are not consistent with optimum performance, then the experimenter must determine a set of adjustments to
the process variables that will move the process towards the optimum. This phase of RSM makes
considerable use of the first-order model and an optimization technique called the method of steepest
ascent(descent).
The first step in obtaining the optimum response settings, after the important factors have been identified, is
to explore the region around the current operating conditions to decide what direction needs to be taken to
move towards the optimum region. Usually, a first order regression model (containing just the main effects
and no interaction terms) is sufficient at the current operating conditions because the operating conditions
are normally far from the optimum response settings. The experimenter needs to move from the current
operating conditions to the optimum region in the most efficient way by using the minimum number of
experiments. This is done using the method of steepest ascent. In this method, the contour plot of the first
order model is used to decide the settings for the next experiment, in order to move towards the optimum
conditions.
3. At this point the experimenter usually wants a model that will accurately approximate the true response
function within a relatively small region around the optimum. Because the true response surface usually
exhibits curvature near the optimum, a second-order model (or perhaps some higher-order polynomial)
should be used. Once an appropriate approximating model has been obtained, this model may be analyzed
to determine the optimum conditions for the process. This sequential experimental process is usually
performed within some region of the independent variable space called the operability region or
experimentation region orregion of interest. It is possible that a number of responses may have to be
optimized at the same time. For example, an experimenter may want to maximize strength, while keeping
the number of defects to a minimum. The optimum settings for each of the responses in such cases may lead
to conflicting settings for the factors. A balanced setting has to be found that gives the most appropriate
values for all the responses.
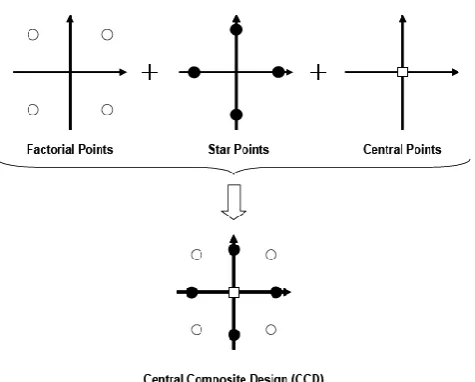
2.2 Central Composite Design
The most popular response surface design is the central composite design (CCD). A CCD has three groups of
(a) Factorial points (b) Axial points (c) Center points
CCD's are designed to estimate the coefficients of a quadratic model. All point descriptions are in terms of
coded values of the factors.
Factorial Points
The two-level factorial part of the design consists of all possible combinations of the +1 and -1 levels of the
factors. For the two factor case there are four design points: (-1, -1) (+1, -1) (-1, +1) (+1, +1).
Star or Axial Points
The star points have all of the factors set to 0, the midpoint, except one factor, which has the value +/- Alpha.
For a two factor problem, the star points are (-Alpha, 0), (+Alpha, 0), (0, -Alpha), (0, +Alpha).
Centre Points
Centre points, as implied by the name, are points with all levels set to coded level 0 -- the midpoint of each
factor range: (0, 0). Center points are usually repeated 4-6 times to get a good estimate of experimental error
(pure error). A central composite design (CCD) is a type of response surface design that will give us very good
predictions in the middle of the design space.
Figure 3 Schematic representation of central composite design (CCD).
III. EXPERIMENTAL PROCEDURE
RSM methodology with central composite design is selected for experimentation. In this work four factors are
taken as input parameters, and the effect of these parameters on MRR is as certained. The details of RSM and
central composite design are given in chapter 3.
3.1 Process Parameters For Study
There are various process parameters of WEDM affecting the machining characteristics. The work piece
good thermal shock resistance. On the basis of literature review and some pilot investigations (not reported
here), the following process parameters have been selected for study in the range shown in table 1
Table 1 Process parameters with their ranges.
S.No.
Input Parameters
Range
1.
Pulse on time (Ton)
100-135 machine units
2.
Pulse off time (Toff)
30-65 machine units
3.
Peak current (IP)
70-230 Amps
4.
Servo voltage (SV)
10-70
Volts
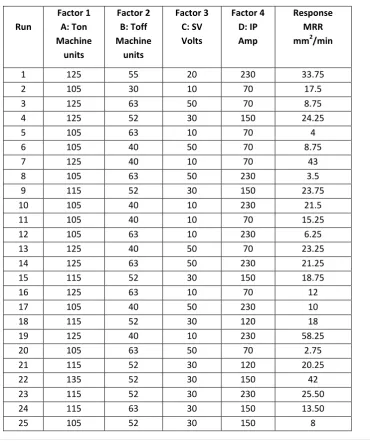
3.2 Experimental Data
The experimental work is carried out as per the central composite design using RSM methodology. The design
is prepared with the help of Design expert software version 8.0.3 which is used to create experimental designs.
The design is shown in table 2 with response
Table 2 Experimental Design with Response Data.
Run Factor 1 A: Ton Machine units Factor 2 B: Toff Machine units Factor 3 C: SV Volts Factor 4 D: IP Amp Response MRR
mm2/min
1 125 55 20 230 33.75
2 105 30 10 70 17.5
3 125 63 50 70 8.75
4 125 52 30 150 24.25
5 105 63 10 70 4
6 105 40 50 70 8.75
7 125 40 10 70 43
8 105 63 50 230 3.5
9 115 52 30 150 23.75
10 105 40 10 230 21.5
11 105 40 10 70 15.25
12 105 63 10 230 6.25
13 125 40 50 70 23.25
14 125 63 50 230 21.25
15 115 52 30 150 18.75
16 125 63 10 70 12
17 105 40 50 230 10
18 115 52 30 120 18
19 125 40 10 230 58.25
20 105 63 50 70 2.75
21 115 52 30 120 20.25
22 135 52 30 150 42
23 115 52 30 230 25.50
24 115 63 30 150 13.50
26 105 63 70 150 10
27 125 52 30 230 34
28 125 52 20 230 58
29 125 40 20 230 58.75
30 95 40 20 120 13
IV
ANALYSIS OF EXPERIMENTAL RESULTS
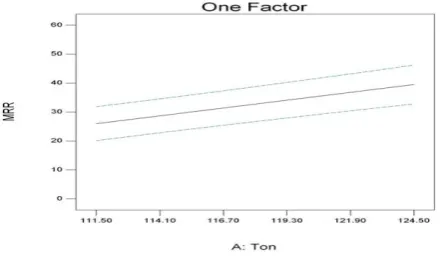
4.1 Effect of Pulse on time on MRR
It can be seen from fig.4 that machining speed increases with increase in the pulse on-time. It means that the
number of sparks in unit time increases which increase in discharge energy. As a result machining speed
becomes faster with increase in pulse on time. So the pulse on time can be adjusted to get the desired material
removal rate.
Fig 4 Effect of Ton on MRR.
4.2
Effect of Pulse off-time on MRR
It can be seen from fig.5 that as the pulse off-time increases, the number of discharges within given period of
time decreases. This will lead to a lower machining speed.
Figure 5 Effect of Toff on MRR.
4.3 Effect of SV on MRR
Figure 6 Effect of SV on MRR.
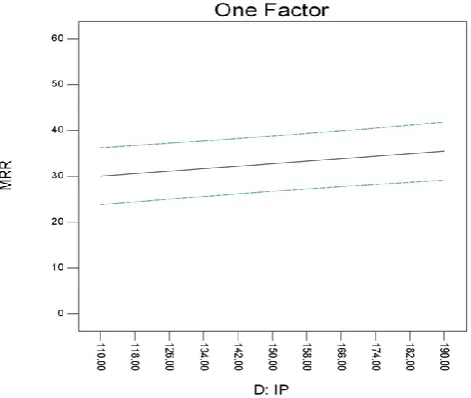
4.4 Effect of Peak Current on MRR
It can be seen from figure.7 that material removal rate increases very slightly with increase in peak current. So
the peak current should be high to obtain higher MRR.
Figure 7 Effect of IP on MRR.
V CONCLUSIONS
The following conclusions are drawn from the experimental study
When pulse on time is increased the material removal rate increases.
When pulse off time is increased the material removal rate decreases.
When servo voltage is increased the material removal rate decreases.
REFERENCES
[1] Ahmet Hasçalykand Ula Çayda (2004), “Experimental study of wire electrical discharge machining of AISI
D5 tool steel.” Journal of Materials Processing Technology Volume 148, Issue 3, Pages 362-367.
[2] D.F. Dauw and L. Albert;(1992), “About the Evolution of Wire Tool Performance in Wire EDM.” CIRP
Annals - Manufacturing Technology Volume 41, Issue 1, Pages 221-225.
[3] Eva Portillo, Marga Marcos, Itziar Cabanes, (2009), “Real-time monitoring and diagnosing in wire-electro
discharge machining.” The International Journal of Advanced Manufacturing Technology, Volume 44, Numbers 3-4.
[4] F. Klocke, D. Lung, D. Thomaidis and G. Antonoglou,(2004), “ Using ultra thin electrodes to produce
micro-parts with wire-EDM.” Journal of Materials Processing Technology 149, pp. 579–584.
[5] Fabio N. Leao, Ian R. Pashby (2004), “A review on the use of environmentally-friendly dielectric fluids in
electrical discharge machining.” Journal of Materials Processing Technology Volume 149, Issues 1-3,
Pages 341-346. 14th Interntaional Symposium on Electromachining (ISEM XIV).
[6] Fleischer J, Masuzawa T, Schmidt J, Knoll M. (2004) ,”New applications for micro-EDM. J. Mat.
Processing Tech. 149 Pages 246 – 249.
[7] Ghosh Amitabh & Malik Ashok Kumar (1995), Manufacturing science, East-West Press Private Ltd, New
Delhi.
[8] Habib et al (2009), “Computational fluid dynamics analysis of working fluid flow and debris movement in
wire EDMed kerf.” CIRP Annals - Manufacturing Technology Volume 58, Issue 1, 2009, Pages 209-212.
[9] Hassan (2009), “Study of the Surface Integrity of AISI 4140 Steel in Wire Electrical Discharge
Machining.” International Multi Conference of Engineers and Computer Scientists 2009 Vol. II 978-988.
[10] H. Singh, R. Garg (2009), “Effects of process parameters on material removal rate in WEDM.”Journal of
Achievements in Materials and Manufacturing Engineering Volume 32 Issue 1 January 2009 page
no.70-74.
[11] Jain V.K (2002) Advanced Machining Processes. Allied, New Delhi.
[12] Jain R.K., Production Technology, Khanna Publications, New Delhi 15th edition, 1995.
[13] J. T. Huang, Y. S. Liao and W. J. Hsue (1999), “Determination of finish-cutting operation number and
machining-parameters setting in wire electrical discharge machining”. Journal of Materials Processing
Technology Volume 87, Issues 1-3, Pages 69-81.
[14] J. Simao,H. G. Lee, D. K. Aspinwall, R. C. Dewes and E. M. Aspinwall (2003),“Workpiece surface
modification using electrical discharge machining.” International Journal of Machine Tools and
Manufacture Volume 43, Issue 2, January 2003, Pages 121-128.
[15] J. A. Sanchez; S. Plaza; L. N. Lopez De Lacalle; A. Lamikiz, 2006, “Computer simulation of wire-EDM
taper-cutting.” International Journal of Computer Integrated Manufacturing, Volume 19, Issue 7, pages 727