Identifying Very Preterm Children at Educational Risk
Using a School Readiness Framework
WHAT’S KNOWN ON THIS SUBJECT: Children born very preterm (VPT) are at high risk of educational delay. School readiness has been identified as a potentially useful clinical framework for early detection of those at greatest risk. However, evidence to support its predictive validity is limited.
WHAT THIS STUDY ADDS: VPT preschoolers are at risk of impairment across the 5 American Academy of Pediatrics school readiness domains. The number of domains affected predicted likelihood of later learning problems, supporting the utility of schoolreadiness frameworks for identifying children needing surveillance and/or support.
abstract
OBJECTIVES:Children born very preterm (VPT) are at high risk of ed-ucational delay, yet few guidelines exist for the early identification of those at greatest risk. Using a school readiness framework, this study examined relations between preschool neurodevelopmental function-ing and educational outcomes to age 9 years.
METHODS:The sample consisted of a regional cohort of 110 VPT (#32 weeks’gestation) and 113 full-term children born during 1998–2000. At corrected age 4 years, children completed a multidisciplinary assessment of their health/motor development, socioemotional adjustment, core learning skills, language, and general cognition. At ages 6 and 9, children’s literacy and numeracy skills were assessed using the Woodcock-Johnson III Tests of Achievement.
RESULTS:Across all readiness domains, VPT children were at high risk of delay/impairment (odds ratios 2.5–3.5). Multiple problems were also more common (47% vs 16%). At follow-up, almost two-thirds of VPT children were subject to significant educational delay in either literacy, numeracy or both compared with 29% to 31% of full-term children (odds ratios 3.4–4.4). The number of readiness domains affected at age 4 strongly predicted later educational risk, especially when multiple problems were present. Receiver operating characteristic analysis confirmed$2 readiness problems as the optimal threshold for identifying VPT children at educational risk.
CONCLUSIONS:School readiness offers a promising framework for the early identification of VPT children at high educational risk. Findings support the utility of$2 affected readiness domains as an effective criterion for referral for educational surveillance and/or additional support during the transition to school. Pediatrics 2014;134:e825– e832
AUTHORS:Verena E. Pritchard, PhD,aSamudragupta Bora,
PhD,bNicola C. Austin, MBChB, DM,c,dKarelia J. Levin, MSc,
PGDipClinPsyc,eand Lianne J. Woodward, PhDb,e aDepartment of Psychology, Aberystwyth University, Wales, United
Kingdom;bDepartment of Pediatric Newborn Medicine, Brigham
and Women’s Hospital, Harvard Medical School, Boston, Massachusetts;cNeonatal Service, Christchurch Women’s
Hospital, Christchurch, New Zealand;dDepartment of Pediatrics,
University of Otago, Christchurch, New Zealand; andeDepartment
of Psychology, University of Canterbury, Christchurch, New Zealand
KEY WORDS
very preterm, preschool, school readiness, neurodevelopment, outcome
ABBREVIATIONS
CELF-P—Clinical Evaluation of Language Fundamentals FT—full term
OR—odds ratio VPT—very preterm
Dr Pritchard conceptualized and designed the study, carried out the initial data analyses, and drafted the initial manuscript; Dr Bora acquired data, carried out the data analyses and interpreted the data, and critically reviewed and revised the initial manuscript; Dr Austin conceptualized and designed the study, acquired the health and motor development data, and critically reviewed the initial manuscript; Ms Levin acquired data and critically reviewed the manuscript; Dr Woodward conceptualized and designed the study, coordinated and supervised data collection and analyses, interpreted the data, and critically reviewed and revised the initial manuscript; and all authors approved thefinal manuscript as submitted.
www.pediatrics.org/cgi/doi/10.1542/peds.2013-3865
doi:10.1542/peds.2013-3865
Accepted for publication May 27, 2014
Address correspondence to Lianne J. Woodward, Department of Pediatric Newborn Medicine, Brigham and Women’s Hospital, 75 Francis St, Boston, MA 02115. E-mail: [email protected]
PEDIATRICS (ISSN Numbers: Print, 0031-4005; Online, 1098-4275).
Copyright © 2014 by the American Academy of Pediatrics
FINANCIAL DISCLOSURE:The authors have indicated they have nofinancial relationships relevant to this article to disclose.
FUNDING:This study was supported by the grants from the Neurological Foundation of New Zealand (ref. no. 022/PG), the Health Research Council of New Zealand (ref. no. 03/196), and the Canterbury Medical Research Foundation (ref. no. 05/01).
POTENTIAL CONFLICT OF INTEREST:The authors have indicated they have no potential conflicts of interest to disclose.
neurodevelopmental impairments that include motor deficits, cognitive delay, language difficulties, and behavioral adjustment problems.1–3Comorbid
prob-lems are also common, with at least a third subject to difficulties across multiple functional domains such as cognition and motor.1,3Although these
difficulties are widely recognized as likely to impede a child’s readiness for school, their relationship with actual school achievement remains poorly understood. Even less is known about how best to screen and identify those at greatest risk who might benefit from timely remedial support during their transition to school and early school years. This is important because edu-cational delay is a major morbidity for this group, with an estimated 60% to 70% of VPT children likely to require additional educational supports dur-ing their schooldur-ing.4–6 Poor school
achievement has also been linked with a wide range of later adverse social, economic, and health outcomes well into adulthood.7–9
The US National Education Goals Panel and, more recently, the American Acad-emy of Pediatrics, have recommended a School Readiness Framework for assessing a child’s developmental prog-ress and support needs before school entry to identify children at high risk who might benefit from proactive support as they transition to school.10 This
frame-work identifies 5 key“readiness to learn” domains spanning physical well-being and motor development, social and emotional development, approaches to learning, communication skills, and general knowledge and cognition.10
Us-ing this framework, a recent Australian study showed that in all domains, VPT-born children obtained standard scores that were 0.5 to 1 SD below their full-term (FT) peers, with 44% compared with 16% subject to difficulties in multiple
sistent with other preschool studies.1,3
They are also in line with a US study that classified high-risk VPT children as not school ready if they had cerebral palsy, blindness, deafness, autism, or scored 1 to 2 SD below the normative mean on 3 standardized developmental tests or .2 SD on a single test.12On the basis
of these criteria, they reported that 33% of VPT children were not school ready and as a result at risk for subsequent educational delay. Taken together, thesefindings highlight that a signifi -cant proportion of VPT children may need support as they transition to school to help them prepare for the cognitive, motor, and behavioral chal-lenges of the classroom.
Despite the need for early identification of these children at high risk, studies examining associations between school readiness measures and later achieve-ment are lacking, limiting the estab-lishment of clear pediatric referral guidelines. To address this gap, the aims of this study were as follows:
1. To describe the neurodevelopmen-tal functioning of a cohort of VPT-and FT-born children on 5 key school readiness domains assessed at cor-rected age 4 years. These domains included health and motor develop-ment, socioemotional adjustdevelop-ment, core learning skills, language, and general cognition.
2. To document the educational out-comes of VPT and FT children at ages 6 and 9 years on standard-ized measures of numeracy and literacy.
3. To examine relations between the extent of school readiness risk and children’s later educational achievement, and in particular, to assess the effectiveness of a school readiness evaluation for the early identification of VPT children at ed-ucational risk.
Participants
Two groups of children were included. For both groups, children with con-genital anomalies, fetal alcohol syn-drome, and/or non–English-speaking parents were excluded. Thefirst group comprised a regional cohort of 110 children born VPT (#32 weeks’ gesta-tion) admitted consecutively to a level III NICU at Christchurch Women’s Hos-pital (New Zealand) from 1998 to 2000 (92% recruitment). This unit is the sole provider for the region. Excluding deaths (n= 3), retention at age 4, 6, and 9 years was 98%, 97%, and 96%, re-spectively.
The second group, recruited at age 2, included 113 FT (37–41 weeks’ gesta-tion) born children matched to the VPT cohort for gender, delivery hospi-tal, and birth date (62% recruitment). No differences were found between recruited and not recruited children on measures of gestational age, birth weight, maternal ethnicity, or family socioeconomic status. Comparison of the socioeconomic profile of this group with regional census data13 showed
these families were representative of the region from which they were recruited. Sample retention was 98% at age 4 and 6 and 96% at age 9 years. Table 1 shows the clinical and social background characteristics of the 2 study groups.
Measures
and Disability Ethics Committee and written informed consent obtained from all parents/guardians.
School Readiness Measures
Physical well-being and motor devel-opment was assessed using children’s medical records and pediatric neuro-logic examination at age 4 years. Chil-dren with.10 primary care visits in the past year ($90th percentile FT score) were classified as having high health care needs. The national average for children between 0 and 5 years is 7 visits per year.14Cerebral palsy was diagnosed
based on the quality of motor skills, gait, coordination, and behavior using stan-dard criteria and severity assessment.15
Developmental Coordination Disorder was diagnosed using theDiagnostic and Statistical Manual of Mental Disorders
(4th edition) criteria. Overall, children were classified as having poor physical health/motor impairment if they had .10 primary care visits in the past year and/or were diagnosed with cerebral palsy or developmental coordination disorder.
Social and emotional development was assessed using the 25-item parent rated Strengths and Difficulties Ques-tionnaire.16 This scale assessed child
emotional symptoms, conduct prob-lems, inattention/hyperactivity, peer relationship problems, and prosocial behaviors. An overall adjustment score was computed by summing scores across all subscales except prosocial behavior.16 Children were classified
as having socioemotional problems if their adjustment score exceeded 13 ($90th percentile FT score). The Strengths and Difficulties Questionnaire has good concurrent and predictive validity, with test–retest reliabilities for the overall score ranging from 0.72 to 0.86.17
Approaches to learning were assessed using the parent report Behavior Rating Inventory of Executive Function, Preschool Version.18This 63-item scale
consists of 5 subscales that assess everyday executive functioning in-cluding inhibition, shifting, working memory, emotional regulation, and planning. A global executive composite score was computed and converted to
an age- and gender-specific T-score. Children were classified as showing learning skill difficulties if their ex-ecutive composite T-score exceeded 65 ($90th percentile FT score). The Behavior Rating Inventory of Execu-tive Function, Preschool is internally consistent (a = .95) and has good test–retest reliability and concurrent validity.19
Language development was assessed using the preschool version of the Clinical Evaluation of Language Funda-mentals (CELF-P).20The CELF-P consists
of 6 subtests assessing linguistic con-cepts, basic concon-cepts, sentence struc-ture, recalling sentences in context, formulating labels, and word struc-ture. Children’s performance across these subtests was summed to provide an overall measure of language abili-ties. Those scoring,85 (,FT mean-1 SD) were classified as language delayed. The CELF-P has good test–retest re-liability (0.87–0.97) and correlates well with other preschool language measures (r= 0.90).21
General knowledge and cognition was assessed using a short form of the Wechsler Preschool and Primary Scale of Intelligence (WPPSI-R).22This
con-sisted of 2 verbal (Comprehension and Arithmetic) and 2 performance (Picture Completion and Block De-sign) subtests. Children were
classi-fied as having cognitive delay if their total IQ score was,91 (,FT M-1 SD). Scores from this short form correlate highly with full-scale scores (r = 0.89–0.92).23
Educational Achievement Measures
Early educational achievement was assessed by using the Math Fluency (math), Understanding Directions (receptive language), and Passage Comprehension/Letter-Word Identifi -cation (reading) subtests from the Woodcock-Johnson III Tests of Achieve-ment.24These subtests were selected
TABLE 1 Neonatal Clinical and Social Background Characteristics of the Sample
Measure Very Preterm (N= 106) Full-Term (N= 110) P
Infant clinical characteristic
Gestational age, M6SD, wk 2862 4061 ,.001
Birth wt, M6SD, g 10666313 35806409 ,.001
Male gender, % 51 54 .69
Twin birth, % 34 4 ,.001
Small for gestational age,a% 10 1 .002
Antenatal corticosteroid use, % 84 — —
Postnatal dexamethasone use, % 6 — —
Oxygen therapy at 36 wk, % 34 — —
Patent ductus arteriosus, % 43 — —
Cystic periventricular leukomalacia, % 6 — —
Intraventricular hemorrhage grade III or IV,b
% 6 — —
Social background characteristic —
Maternal age, M6SD, y 3165 3164 .75
Maternal minority ethnicity, % 13 12 .76
Mother not a high school graduate, % 40 19 .001
Single-parent family, % 19 12 .15
Family socioeconomic statusc
Professional/managerial, % 26 36 —
Technical/skilled, % 43 55 —
Semiskilled/unskilled/unemployed, % 30 10 .001
aBirth wt.2 SD below the mean for gestational age and gender. bBased on Papile classification.
cAssessed using the Elley-Irving Socioeconomic Index.
our national school curriculum. Test– retest reliabilities range from 0.75 to 0.95, and test performance corre-lates highly with other standardized measures of educational achievement (r= 0.59–0.80).24Developmental delay
for each subtest was defined as a score .1 SD below the FT group mean.
RESULTS
School Readiness of VPT and FT Children
Table 2 describes VPT and FT born children’s functioning in each school readiness domain at age 4 years. Across all measures, VPT children fared less well than FT children with mean differences ranging from 2–10 points (P#.001). Across the 5 school-readiness domains, VPT children were 2 to 3 times more likely to have prob-lems (24%–38% vs 11%–15%; odds ra-tios [ORs] 2.5–3.5). With the exception of social and emotional adjustment problems which was reduced to mar-ginal significance (unadjusted OR = 2.5,
P= .01; adjusted OR = 2.1,P= .06), these risks remained unchanged after the
(adjusted ORs 2.1–3.6).
Table 3 shows the proportion of chil-dren in each group subject to varying levels of school readiness difficulties. Just over a quarter of VPT children were free of any difficulties compared with almost two-thirds (64%) of FT children. Although rates of single do-main impairment/delay were similar across both groups (VPT, 27%; FT, 24%), VPT children were 3 times more likely to have multiple (2, 3, or$4) readiness difficulties (47% vs 16%).
Educational Achievement of VPT and FT Children
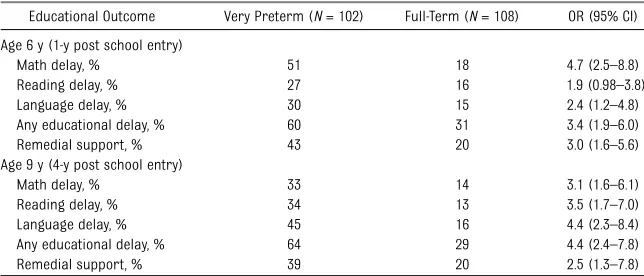
Table 4 describes the educational achievement of VPT and FT born chil-dren on measures of math, reading, and language at age 6 and 9 years. At both assessments, VPT children had higher rates of delay across all subject areas (27%–51% vs 13%–18%), with relative risks ranging from 1.7 to 2.8 and odds from 1.9 to 4.7. These risks persisted after taking into account the effects of family socioeconomic status (ORs 1.8–4.5).
years, the odds of any educational delay for VPT children relative to FT children increased from 3.4 to 4.4. The nature of their learning difficulties also changed. At age 6, their most prominent area of difficulty was math (OR 4.7) and the least was reading (OR 1.9). However, by age 9 years, language delay was most common (OR 4.4), followed by reading (OR 3.5) then math (OR, 3.1).
School Readiness Difficulties and Risk of Educational Delay in VPT and FT Children
Table 5 examines the relationship be-tween the number of school readiness difficulties at age 4 and risks of any educational delay at age 6 and 9 years. Results show that as the number of school readiness difficulties increased, odds of educational delay rose for both VPT and FT born children. For children with 1 school readiness difficulty, the odds of educational delay were small at age 6 (VPT, 1.9; FT, 2.8) and moderate at 9 (VPT, 3.8; FT, 2.8). However, as the number of difficulties increased to 2 and then 3 affected readiness domains, the odds of delay increased sharply (VPT, 7.2–14.0; FT, 7.4–10.6). Almost all children with $4 domains affected experienced later educational delay. These associations were robust to sta-tistical control for the effects of family socioeconomic status.
Diagnostic Utility of a School Readiness Framework for Identifying Risk of Educational Delay in VPT Children
The results described here suggest that a school readiness assessment of a VPT-born child’s developmental needs before school entry could offer a useful framework for the early identification of those needing learning supports. To examine this issue, the predictive TABLE 2 School Readiness Outcomes of VPT and FT Children at Age 4 Years
Outcome Very Preterm
(N= 105)
Full-Term (N= 107)
OR (95% CI) P
Physical well-being and motor development
Total number of primary care visits in past year, M6SD 767 465 — .001
Frequent health care visits, % 22 12 2.1 (0.97–4.6) .06
Cerebral palsy, % 16 1 20.5 (2.7–156.9) ,.001
Developmental coordination disorder, % 7 2 3.8 (0.8–18.5) .10
Any problem, % 38 15 3.5 (1.8–7.0) ,.001
Social and emotional development
SDQ overall behavioral adjustment score, M6SD 1066 865 — .001
Any problem, % 24 11 2.5 (1.2–5.4) .01
Approaches to learning
BRIEF-P global executive composite T-score, M6SD 59611 5569 — .001
Any problem, % 30 11 3.4 (1.6–7.1) .001
Language development
CELF-P total language score, M6SD 91614 98613 — ,.001
Any problem, % 31 15 2.5 (1.3–4.9) .008
General knowledge and cognition
WPPSI-R total IQ score, M6SD 95616 105613 — ,.001
Any problem, % 34 13 3.5 (1.7–6.9) ,.001
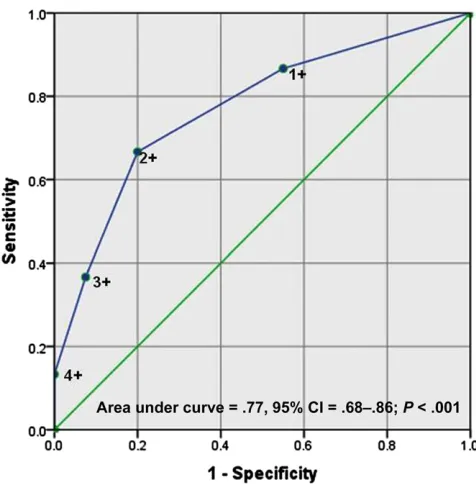
accuracy of 3 potential school readi-ness cut points was examined. These included children having difficulties in at least 1, 2, or 3 readiness domains. The results of this analysis are sum-marized in Supplemental Table 6 and Figs 1 and 2. As shown in Supplemental Table 6, screening children for $1 readiness difficulties had the highest sensitivity (86%–87%) but lowest specificity (45%–50%) for later delay. That is, using this criterion, nearly 90% of VPT children subject to educational delay could be identified before start-ing school, but a substantial number of children not likely to develop prob-lems, at least to age 9, would also be identified. Adopting the more stringent criterion of $3 difficulties had poor sensitivity (31%–37%) but good
speci-ficity (89%–93%) indicating that while correctly excluding most low-risk dren, approximately two-thirds of chil-dren at clear risk would fail to be detected. This suggests that a single readiness difficulty may be too in-clusive, whereas $3 difficulties may be overly stringent. Finally, a middle ground criterion of$2 readiness
dif-ficulties showed reasonable diagnostic
accuracy, with moderate sensitivity (59%–67%) and good specificity (75%– 80%). This was further confirmed by
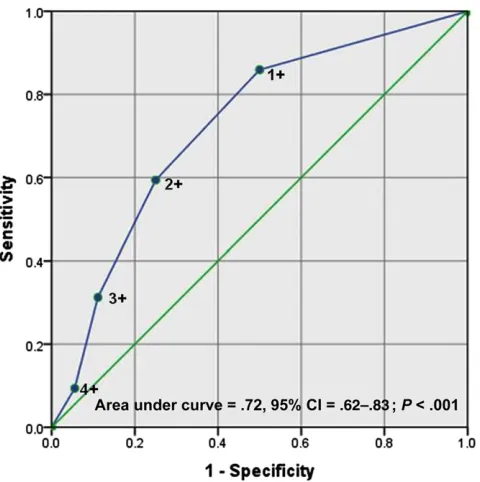
fitting receiver operating characteris-tic curves to the data. As illustrated in Fig 1, after taking into account the trade-off between sensitivity and
speci-ficity,$2 readiness difficulties provided the optimal threshold for identifying VPT children at risk of educational delay, with the area under the curve being 0.77 (P,.001) at age 6 years and 0.72 (P,.001) at 9 years (Fig 2).
DISCUSSION
Findings confirm that VPT born children are at high risk of neurodevelopmental problems that are likely to have an impact on their subsequent school achievement. Within a school readiness framework, these problems span health/physical development, socio-emotional adjustment, core learning skills, language, and general cognition. Rates of single-domain impairment ranged from 24% for social-emotional adjustment to 38% for physical health and motor functioning. Children in the VPT group were also at increased risk
of comorbid or multiple domain im-pairments (47% vs 16%), potentially adding further to their long-term risk. Indeed children with $3 readiness domains affected were almost exclu-sively in the VPT group (8%–17% vs 2%–3%). These rates are remarkably consistent with those reported by Roberts et al11 despite differences in
the measures used. This consistency in
findings across the 5 key“readiness to learn” domains suggests that the na-ture of the skills assessed may be more important than the actual measures used, provided of course that mea-sures are psychometrically sound. If this is the case, this would alleviate, at least to some extent, concerns about the effects of measurement variation across centers and potentially allow clinicians someflexibility in measure-ment choice.10,25Studies in other
con-texts should help clarify this issue further.
By ages 6 and 9 years, at least 60% of VPT born children were subject to some form of educational delay com-pared with around a quarter of FT children. There was also some sug-gestion that the nature of VPT children’s learning difficulties changed some-what over time. At age 6, the most prominent area of difficulty was math and the least prominent reading. However by age 9, VPT children’s risk of math delay had decreased somewhat relative to their FT peers, whereas language and reading difficulties had become more frequent. This suggests that for some VPT children, mathfl u-ency or the ability to quickly solve simple addition, subtraction, and multiplication problems improved with age. However, knowledge of mathemat-ical facts is only 1 of the domain-specific skills involved in math performance. Thus, it will be important to assess how other, more complex skills develop in these children, such as selecting and applying the most appropriate math TABLE 3 Proportion of Children with School Readiness Difficulties at Age 4 Years
Number of Readiness Difficulties Very Preterm (N= 103) Full-Term (N= 107) OR 95% CI
0 26 60 — —
1 27 24 2.6 (1.3–5.1)
2 22 11 4.5 (2.0–10.4)
3 17 3 13.4 (3.6–49.6)
4+ 8 2 9.5 (1.9–47.6)
TABLE 4 Educational Outcomes of VPT and FT Children at Age 6 and 9 Years
Educational Outcome Very Preterm (N= 102) Full-Term (N= 108) OR (95% CI) Age 6 y (1-y post school entry)
Math delay, % 51 18 4.7 (2.5–8.8)
Reading delay, % 27 16 1.9 (0.98–3.8)
Language delay, % 30 15 2.4 (1.2–4.8)
Any educational delay, % 60 31 3.4 (1.9–6.0)
Remedial support, % 43 20 3.0 (1.6–5.6)
Age 9 y (4-y post school entry)
Math delay, % 33 14 3.1 (1.6–6.1)
Reading delay, % 34 13 3.5 (1.7–7.0)
Language delay, % 45 16 4.4 (2.3–8.4)
Any educational delay, % 64 29 4.4 (2.4–7.8)
Remedial support, % 39 20 2.5 (1.3–7.8)
strategy to different problems. In their review, Simms et al26suggested that it
may be these latter, more complex skills that pose the greatest challenge for VPT children. With respect to the observa-tions that rates of language and reading delay appeared to increase with age and curricular demand, this is in line with results from a recent study exam-ining the linguistic performance of 4- to
6-year-old and 6- to 12-year-old children, which found that VPT children tend to do well in early linguistics but experi-ence more difficulties in complex than simple word reading at older ages.27
Longer-term follow-up and analysis of domain-specific skills is needed to fully understand age and curricular varia-tions in the development of math and reading difficulties over time.
for both FT and VPT born children, there were corresponding increases in the likelihood of later educational delay. Children with problems in 1 school-readiness domain had odds of delay that ranged from 2 to 3 at age 6 and 3 to 4 at 9 years. At age 6, almost half of VPT and a third of FT children in this group were delayed. By age 9, the risk of delay for VPT children in this group had increased to 65%, whereas risks remained stable for FT children. This suggests that even 1 affected readiness domain carries considerable educational risk for VPT children. On the basis of these
findings, it could be argued that early remedial support may be warranted for these children, especially given that they are likely to have less severe problems that may be more amenable to improvement through short, pro-active interventions than children with multiple and probably more se-vere problems.
Consideration of children with prob-lems in .1 school-readiness domain showed that for both VPT and FT chil-dren with problems in 2 domains, the odds of later educational delay rose to 8 to 11 at age 6 and to 7 at 9 years, with 80% of VPT and 58% to 67% of FT subject to later educational delay. For children with problems in $3 school-readiness domains, educational delay was almost inevitable (82%– 100%), emphasizing the importance of assessing a child’s preschool func-tioning across multiple domains.28,29Of
those with some form of educational delay, only half were receiving addi-tional learning supports, suggesting that, similar to other studies,30not all
children in need of support were re-ceiving it. Currently in New Zealand, children typically access government-resourced early childhood education from the age of 3; earlier, they use
Number of Readiness Difficulties Educational Delay
Very Preterm (N= 100) Full-Term (N= 106)
% OR (95% CI) % OR (95% CI)
Age 6 y (1-y post school entry)
0 31 — 16 —
1 46 1.9 (0.6–6.0) 35 2.8 (0.98–8.0)
2 78 8.1 (2.2–29.6) 67 10.6 (2.7–42.0)
3 82 10.5 (2.3–47.0) 100 —
4+ 100 — 100 —
Age 9 y (4-y post school entry)
0 33 — 16 —
1 65 3.8 (1.2–11.8) 35 2.8 (0.98–8.0)
2 78 7.2 (2.0–25.7) 58 7.4 (2.0–28.1)
3 88 14.0 (2.6–75.4) 100 —
4+ 75 6.0 (1.0–35.9) 100 —
FIGURE 1
private preschool settings. For children with high needs or who are enrolled in early intervention, an education sup-port worker may be assigned for some attendance hours per week. Only very high-needs children are eligible for teacher aide on commencing school between the ages of 5 and 6 years.
Examination of the diagnostic utility of a school readiness framework for the early identification of VPT children at
educational risk showed that adopting a criterion of $2 school-readiness problems offered the best trade-off between sensitivity and specificity. A cutoff of $1 readiness difficulties tended to be somewhat overinclusive, although also potentially justifiable given later risk rates. In contrast, the cutoff of $3 was too stringent and resulted in the exclusion of a large proportion of children at clear
educa-tional risk. We would note that this analysis was confined to VPT children because of the low base rate of problems in our FT control group. However, because similar associations were found between school readiness and educational risk across both study groups, evaluation of the diagnostic utility of a school-readiness framework using a larger general pop-ulation sample would seem warranted.
Several study limitations should be acknowledged. First our FT comparison group was recruited at age 2 by retro-spectively accessing hospital records. Second, although associations between school readiness and educational out-comes were adjusted for family socio-economic status, measures of family social background were not included in predictive models despite clear evidence showing that they have an important influence on a child’s long-term school success.10,12,29 Although beyond the
scope of the current study, including a measure of family social risk in pre-dictive models may help to improve the identification of those at greatest educational risk. Nonetheless, current
findings do offer useful risk and di-agnostic information to guide the early identification of VPT children at educa-tional risk and also to help advocate for additional educational resources for these children at high risk.
REFERENCES
1. Woodward LJ, Moor S, Hood KM, et al. Very preterm children show impairments across multiple neurodevelopmental domains by age 4 years.Arch Dis Child Fetal Neonatal Ed. 2009;94(5):F339–F344
2. Woodward LJ, Clark CA, Bora S, Inder TE. Neonatal white matter abnormalities an important predictor of neurocognitive out-come for very preterm children.PLoS ONE. 2012;7(12):e51879
3. van Baar AL, van Wassenaer AG, Briët JM, Dekker FW, Kok JH. Very preterm birth is associated with disabilities in multiple
developmental domains.J Pediatr Psychol. 2005;30(3):247–255
4. Hornby G, Woodward LJ. Educational needs of school-aged children born very and ex-tremely preterm: a review. Educ Psychol Rev. 2009;21:247–266
5. Aylward GP. Cognitive and neuropsychological outcomes: more than IQ scores.Ment Retard Dev Disabil Res Rev. 2002;8(4):234–240 6. Pritchard VE, Clark CA, Liberty K, Champion
PR, Wilson K, Woodward LJ. Early school-based learning difficulties in children born very pre-term.Early Hum Dev. 2009;85(4):215–224
7. Darlow BA, Horwood LJ, Woodward LJ. Psy-chosocial outcomes of a national cohort of young adults born very low birthweight.
Pediatrics. 2013;132(6). Available at: www. pediatrics.org/cgi/content/full/132/6/e1521 8. McCarty CA, Mason WA, Kosterman R, Hawkins
JD, Lengua LJ, McCauley E. Adolescent school failure predicts later depression among girls.
J Adolesc Health. 2008;43(2):180–187 9. Dewalt DA, Berkman ND, Sheridan S, Lohr
KN, Pignone MP. Literacy and health out-comes: a systematic review of the literature.
J Gen Intern Med. 2004;19(12):1228–1239
FIGURE 2
Receiver operating characteristic curve showing the predictive utility of different cut points for school readiness difficulties at age 4 to identify VPT born children at risk of educational delay by age 9 years. CI, confidence interval
and Dependent Care and Council on School Health. School readiness.Pediatrics. 2008; 121(4). Available at: www.pediatrics.org/cgi/ content/full/121/4/e1008
11. Roberts G, Lim J, Doyle LW, Anderson PJ. High rates of school readiness difficulties at 5 years of age in very preterm infants compared with term controls.J Dev Behav Pediatr. 2011;32(2):117–124
12. Patrianakos-Hoobler AI, Msall ME, Marks JD, Huo D, Schreiber MD. Risk factors af-fecting school readiness in premature infants with respiratory distress syndrome.
Pediatrics. 2009;124(1):258–267
13. Zealand SN. 2001 Census: regional summary. Available at http://www.stats.govt.nz/Census/ 2001-census-data.aspx. Accessed May 2008 14. Crampton P, Jatrana S, Lay-Yee R, Davis P.
Ex-posure to primary medical care in New Zealand: number and duration of general practitioner visits.N Z Med J. 2007;120(1256):U2582 15. Palisano R, Rosenbaum P, Walter S, Russell
D, Wood E, Galuppi B. Development and reliability of a system to classify gross mo-tor function in children with cerebral palsy.
Dev Med Child Neurol. 1997;39(4):214–223 16. Goodman R. The Strengths and Difficulties
Questionnaire: a research note.J Child Psychol Psychiatry. 1997;38(5):581–586
the parent and teacher versions of the strengths and difficulties questionnaire for 4- to 12-year-olds: a review.Clin Child Fam Psychol Rev. 2010;13(3):254–274
18. Gioia GA, Espy KA, Isquith PK. Behavior Rating Inventory of Executive Function Preschool Version (BRIEF-P). Odessa, FL: Psychological Assessment Resources; 2003
19. Isquith PK, Crawford JS, Espy KA, Gioia GA. Assessment of executive function in preschool-aged children.Ment Retard Dev Disabil Res Rev. 2005;11(3):209–215
20. Wiig EH, Secord W.Semel E. Clinical Evalua-tion of Language Fundamentals—Preschool: Examiner’s Manual. New York, NY: The Psy-chological Corporation; 1992
21. Morrow CE, Vogel AL, Anthony JC, Ofir AY, Dausa AT, Bandstra ES. Expressive and re-ceptive language functioning in preschool children with prenatal cocaine exposure.
J Pediatr Psychol. 2004;29(7):543–554 22. Wechsler Preschool and Primary Scale of
Intelligence—Revised. San Antonio, TX: The Psychological Corporation; 1989
23. LoBello SG. A short form of the Wechsler Preschool and Primary Scale of Intelligence-Revised.J Sch Psychol. 1991;29(3):229– 236
Itasca, IL: Riverside; 2001
25. Garber R, Timko G, Bunkley L, Lumpkins D, Duckens C.School Readiness Assessment: A Review of the Literature, Report. Columbus, OH: Franklin County Department of Jobs and Family Services; 2007
26. Simms V, Cragg L, Gilmore C, Marlow N, Johnson S. Mathematics difficulties in chil-dren born very preterm: current research and future directions. Arch Dis Child Fetal Neonatal Ed. 2013;98(5):F457–F463 27. Aarnoudse-Moens CS, Oosterlaan J,
Duivenvoorden HJ, van Goudoever JB, Weisglas-Kuperus N. Development of preschool and academic skills in children born very pre-term.J Pediatr. 2011;158(1):51–56 28. Msall ME. Measuring functional skills in
preschool children at risk for neuro-developmental disabilities. Ment Retard Dev Disabil Res Rev. 2005;11(3):263–273 29. Bauer SC, Msall ME. Optimizing
neuro-developmental outcomes after prematurity: lessons in neuroprotection and early in-tervention.Minerva Pediatr. 2010;62(5):485–497 30. Litt J, Taylor HG, Klein N, Hack M. Learning
DOI: 10.1542/peds.2013-3865 originally published online August 11, 2014;
2014;134;e825
Pediatrics
Lianne J. Woodward
Verena E. Pritchard, Samudragupta Bora, Nicola C. Austin, Karelia J. Levin and
Readiness Framework
Identifying Very Preterm Children at Educational Risk Using a School
Services
Updated Information &
http://pediatrics.aappublications.org/content/134/3/e825
including high resolution figures, can be found at:
References
http://pediatrics.aappublications.org/content/134/3/e825#BIBL
This article cites 21 articles, 2 of which you can access for free at:
Subspecialty Collections
http://www.aappublications.org/cgi/collection/neurology_sub
Neurology
al_issues_sub
http://www.aappublications.org/cgi/collection/development:behavior
Developmental/Behavioral Pediatrics following collection(s):
This article, along with others on similar topics, appears in the
Permissions & Licensing
http://www.aappublications.org/site/misc/Permissions.xhtml
in its entirety can be found online at:
Information about reproducing this article in parts (figures, tables) or
Reprints
http://www.aappublications.org/site/misc/reprints.xhtml
DOI: 10.1542/peds.2013-3865 originally published online August 11, 2014;
2014;134;e825
Pediatrics
Lianne J. Woodward
Verena E. Pritchard, Samudragupta Bora, Nicola C. Austin, Karelia J. Levin and
http://pediatrics.aappublications.org/content/134/3/e825
located on the World Wide Web at:
The online version of this article, along with updated information and services, is
http://pediatrics.aappublications.org/content/suppl/2014/08/06/peds.2013-3865.DCSupplemental
Data Supplement at:
by the American Academy of Pediatrics. All rights reserved. Print ISSN: 1073-0397.