61 | P a g e
Photo-catalytic treatment of Azo dye: Optimization of
Process Parameters Using Response Surface Methodology
Manpreet Kaur Verma
a, Dr. ArchanaTomar
ba. Research Scholar, Department of Chemistry, DeshBhagat University, Mandi-Gobindgarh (Punjab).
b. Assistant Professor, Department of Chemistry, DeshBhagat University, Mandi-Gobindgarh (Punjab).
ABSTRACT
Water pollution poses serious threats to both the environment and the organisms that depend on their environment for survival. Due to the toxicity from dyes in textile wastewater, there is a dire need for the development of innovative and efficient treatment technologies. In this study efforts have been made to treat the wastewaters contaminated with reactive azo dye using photocatalytic process.Photocatalytic process uses TiO2
as catalyst to generate OH* radicals from air. In this study, optimized conditions were derived, using response surface methodology, for the degradation of reactive azo dye and to obtain efficienttreatment. At TiO2 = 169.2
mg L-1 and pH=5.48, 73.70% degradation was reported in the duration of 2 h. Therefore, in mid latitude regions such as India, where intensity of sunlight is prominent, photocatalytic processes can play a vital role in the treatment of textile industry wastewaters.
Keywords: Photocatalysis, Reactive azo dye, sunlight, water pollution, response surface methodology
1.0.INTRODUCTION
Textile industries have been growing at a higher rate and the discharge of dyes from these industries highly alters the chemical composition of the water and water becomes unsuitable for drinking purposes. Therefore, removal of toxicants from the wastewaters of the textile industries has become a crucial issue in various nations. Among the various types of industries, dye and textile industries have a huge impact. Among the numerous organic dyes, azo dyes and its pigments are most famous among users as they are easily bound to synthetic as well as natural textile fibers. The major problem with these azo dyes is their complex chemical structure due to which they are not easily degraded by microorganisms and they get accumulated in different food chains. Therefore, they finally enter into bodies of living beings and affect their body. These complex compounds if enter in human body could cause carcinogenic effects. Chemical structure of an azo dye is shown in figure 1.1.:
62 | P a g e
In earlier years, primitive technologies were used for the treatment of wastewater coming from textile industries. Biological treatment of dyes poses serious problems because of the presence of non-biodegradable compounds. Therefore, pre-treatment methods, such as adsorption on activated carbon, coagulation, precipitation and chemical oxidation, have been applied to treat the effluent from textile industries. Among the chemical oxidation processes, advanced oxidation processes (AOPs) offer great potential for dyes treatment (Glaze, et al. 1997; Deng et al., 2006). From different types of AOPs, heterogeneous photocatalysis, has emerged as an efficient water treatment technology because of its ambient operation conditions, non-toxicity and inexpensiveness (Pekakis, et al., 2006).
In TiO2 photocatalysis, catalyst is radiated by UV light (300-400 nm; black light) which excites its
electrons from valence band to conduction band, leading to generation of hole in valence band. These excited electrons and valence band holes react with oxygen and water molecules to produce various oxidizing species such as OH-; e- and H-. These oxidizing species causes degradation of organic compounds such as reactive azo dye (Hoffmann, et al., 1995; Mills and Hunte, 1997).
Various studies have investigated the photocatalysis for the treatment of dyes however much work has not been done on treatment of a reactive azo dye using chemical processes. Therefore in present study this effort has been made and investigations have also been made in using the multivariate statistical approach for optimizing the process parameters to achieve maximum degradation of reactive azo dye.
2.0.
MATERIALS AND METHODS
2.1.Chemicals and reagents
pH of the reaction mixture was maintained using Sulphuric acid and Sodium hydroxide. These chemicals were supplied by Sigma Aldrich and were of analytical grade as well. TiO2 (anatase, purity > 99%),also known as
Titania, used in photocatalytic and adsorption studies was purchased from Sigma Aldrich. Chlorpyrifos with technical grade (99.5% purity) were purchased from Sigma Aldrich.
63 | P a g e
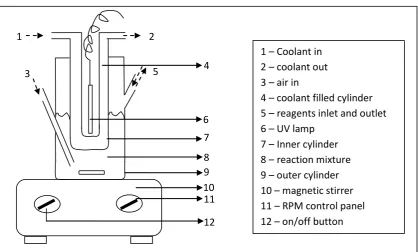
2.1.1. Photo-chemical reactorAll the experiments were performed in a photo-reactor shown in figure 2:
Figure 2. Experimental setup for Photocatalytic treatment
This photo-reactor is made up of glass and due to circular bottom of the inner cylinder UV light, produced by a UV lamp placed in an innermost cylinder, is directed towards the outer cylinder where reaction mixture is kept. UV lamp used in this study was a Mercury vapor lamp (60 Watts). This lamp emits radiations in the range of 300-400 nm (Irie, 2007). At outer cylinder openings are provided for air supply and taking out and injecting the reagents. Continuous mixing of reaction mixture was maintained using magnetic stirrer. Inner cylinder is having inlets for coolant (i.e. water) required for maintaining the temperature of the reaction mixture.
All the experiments were performed for two hours, at three levels of the operation parameters i.e. low level (-1), middle level (0) and high level (+1). After completion of every experiment, the reaction mixture was allowed to settle and the supernatant was collected for further analysis. The aliquots were treated with 3 M NaOH to neutralize remaining oxidants, so that no interference is caused during COD analysis (Lee, 2004). COD was analyzed using closed reflux titrimetric method, as per Standard Methods, using DRS 800 (HACH, USA) digester. Biochemical Oxygen Demand (BOD5) was analyzed using Standard Methods (Wu, 2010).
2.1.2. Preparation of reaction mixture
Reactive azo dye contaminated water sample (500 mg/L) was prepared fresh every time before initiating the reaction. Firstly, 100 ml of the reactive azo dye contaminated solution was added in the outer cylinder of a photo reactor having a capacity of 250 ml. Now, required amount of TiO2wasadded to the solution
1 – Coolant in
2 – coolant out
3 – air in
4 – coolant filled cylinder
5 – reagents inlet and outlet
6 – UV lamp
7 – Inner cylinder
8 – reaction mixture
9 – outer cylinder
10 – magnetic stirrer
11 – RPM control panel
12 – on/off button
6
7
8
9
10
11
12
5
1
2
64 | P a g e
the experiment, using sulphuric acid and sodium hydroxide. Finally the volume of the reaction mixture was
made up to 200 ml using reactive azo dye contaminated solution.
2.2.Experimental procedure
2.2.1. Experimental design and statistical analysis
Instead of using a time consuming and labor demanding one variable at a time (OVAT) approach a multivariate statistical approach was used to generate a relation between operating parameters and response (i.e., % COD degradation). A 2 level central composite design (CCD) approach in combination with Response Surface Methodology(RSM) was used to design experiments and generate models based on quadratic relations between the operating and response parameters. The relation developed between the operating and process
parameters using this approach can be described using Eq. (1):
𝑋 = 𝑐𝑜+ 𝑐1𝑌1+ 𝑐2𝑌2+ 𝑐3𝑌3+ 𝑐12𝑌1𝑌2+ 𝑐13𝑌1𝑌3+ 𝑐23𝑌2𝑌3+ 𝑐11𝑌12+ 𝑐22𝑌22+ 𝑐33𝑌32 (1)
Where, ci = response function coefficients which were determined using Stat–Ease Design Expert
(version 8.0.7.1) regression software.
The software was also used to assess the adequacy of the generated models using analysis of variance (ANOVA). The various parameters calculated for the adequacy check were correlation regression coefficients, adjusted regression coefficients and goodness of fit. After all the statistical analysis, 3D plots of the results were also generated using RSM. Using these plots the optimum operating parameters for maximum COD degradation were evaluated.
3.0.
RESULTS AND DISCUSSION
3.1.RSM and statistical results
The quadratic equations, developed using CCD for photocatalytic treatment, are mentioned in Eq. (2) through Eq. (3):
𝑋1= 77 + 5.61 𝑍1+ 2.06𝑍2− 1.0𝑍1𝑍2− 11.81 𝑍12− 6.56𝑍22 (2)
𝑋2= 57.5 − 14.02 𝑍1− 5.15𝑍2+ 2.5𝑍1𝑍2+ 29.53𝑍12− 16.41𝑍22 (3)
Where, X1 = % degradation; X2 = COD
Z1 = TiO2 concentration; Z2 = pH
65 | P a g e
Table 1: Experimental and predicted responses from the CCD experiments for Photocatalytic treatmentVariables
Experimental Responses
Predicted Responses
pH TiO2
S.No. Coded values Actual values
Coded values
Actual values
mg/L mg/L X1 X2 X1 X2
1 0 4 *Misc 18.93
50 125 200 125 125 50 125 200 125 125 231.06 125
45 137.5 61.12 82.75
2 -1 2 -1 50 125 53.62 70.75
3 0 4 0 77 57.5 52.38 67.25
4 +1 6 +1 63 92.5 41.88 54.25
5 0 4 0 77 57.5 55.87 73.5
6 0 4 0 77 57.5 49.37 60.5
7 +1 6 -1 56 110 51.63 64.5
8 0 4 0 77 57.5 40.13 52.5
9 -1 2 +1 61 97.5 55.99 71.76
10 *Misc 6.8 0 68 80 43.75 56.26
11 *Misc 1.17 0 62 95 47.25 63.76
12 0 4 *Misc 64 90 39.01 47.26
13 0 4 0 77 57.5 61 83
*Misc = values considered randomly by software
A significant similarity was observed between the experimental and predicted results. At 95 % confidence level predicated results were plotted against actual experimental results in figure 3 and figure 4. which showed that a significant relationship exists between both of them.
66 | P a g e
Figure 4: Plot of actual vs predicted responses for COD in Photo-catalytic treatment3.2.Analysis of variance
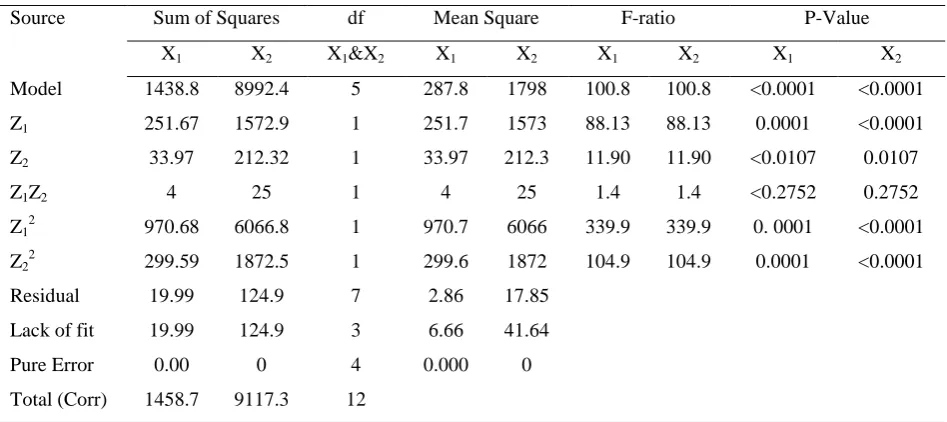
ANOVA was performed to assess the adequacy of the generated models at 95 % confidence level. The results obtained from this process are shown in Table 2:
Table 2: ANOVA test for response parameters X1 and X2for photocatalytic treatment
Source Sum of Squares df Mean Square F-ratio P-Value
X1 X2 X1&X2 X1 X2 X1 X2 X1 X2
Model 1438.8 8992.4 5 287.8 1798 100.8 100.8 <0.0001 <0.0001 Z1 251.67 1572.9 1 251.7 1573 88.13 88.13 0.0001 <0.0001
Z2 33.97 212.32 1 33.97 212.3 11.90 11.90 <0.0107 0.0107
Z1Z2 4 25 1 4 25 1.4 1.4 <0.2752 0.2752
Z12 970.68 6066.8 1 970.7 6066 339.9 339.9 0. 0001 <0.0001
Z22 299.59 1872.5 1 299.6 1872 104.9 104.9 0.0001 <0.0001
Residual 19.99 124.9 7 2.86 17.85 Lack of fit 19.99 124.9 3 6.66 41.64 Pure Error 0.00 0 4 0.000 0 Total (Corr) 1458.7 9117.3 12
R2 for X1 = 0.9681, R2 for X2 = 0.9414; R2adj for X1 = 0.9538, R2adj for X2 = 0.9103
67 | P a g e
for Fenton, photo Fenton and photocatalytic processes was 0.9681 for %degradation and 0.9414 for COD removal. These values being close to 1 show that variations observed among experimental and observed results are insignificant and models generated are adequate for the present study (Kiely, 1997; Ehrig, 1992). The generated models can also be used satisfactorily to analyze the responses from even more input variables as the
values of correlation coefficients were very close to adjusted correlation coefficients (R2adj) (Ehrig, 1992).
3.3.Response surface plots and Optimization of responses
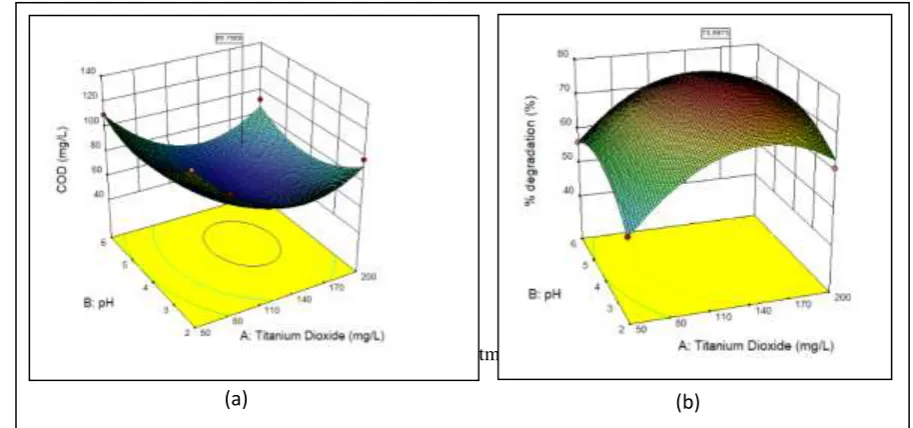
After the validation of models, Design Expert software was used to plot 3-Dimensional surface plots for all the operating parameters. RSM approach was used to draw these plots as shown in figure 5:
Figure 5: Response surface plots for Photocatalytic treatment: (a)- COD removal; (b)-% degradation
Optimal values of the operating parameters causing maximum COD degradation are shown with a marker at surface plot of each figure. Maximum COD degradation at different optimum operating conditions is described
in Table 3 and shown in figure 6:
Table 3: Maximum values of responses at optimum condition in photocatalytic treatment
Maximum values for Responses S.No. Control
Parameters
Symbolic representation
% degradation (X1 = 73.70)
169.2 5.48
1 TiO2 Y1
2 pH Y2
68 | P a g e
Fig 6: Results of optimization for Photocatalytic treatment3.4.Effects of pH
pH of the reaction mixture in advanced oxidation processes plays a very crucial role. Most of the AOPs show best efficiency in acidic conditions i.e pH of about 2 to 6 i.e. acidic pH (Benatti, 2006; Kiril, 2010, Wang, 2000).In this study the surface plots of pH/TiO2 show increase in degradation with increase in pH up to
5.48 after which the rate of degradation started decreasing slowly.
Such a pattern was reported because at pH lower then optimal conditions, the production of OH radicals is comparatively less that leads to lesser oxidation of organic contaminants (Deng and Englehardt, 2006).
Whereas increasing the pH of the reaction mixture above optimum conditions decrease in production of H+ ions occurs that further leads in lesser generation of OH radicals (Walling, 1975)
3.5.Effects of TiO2
TiO2 particles help in removal of reactive azo dye from contaminated water by not only adsorption but
also by oxidation. Photons generated from UV lamp leads to charge separation on TiO2particles as described in
Eq. (4):
𝑇𝑖𝑂2+ ℎ𝑣 → 𝑇𝑖𝑂2 𝑒− + 𝑇𝑖𝑂2 ℎ+ (4)
69 | P a g e
oxidation of reactive azo dye molecules by producing hydroxyl radicals from water molecules as shown in Eq. (5) and Eq. (6):
𝑂2+ 𝑒− → 𝑂𝐻∗ (5)
𝐻2𝑂 + ℎ+ → 𝑂∗ 𝐻 (6)
Therefore, with the increase in its concentration the degradation of reactive azo dye is reported in all the surface plots. In this study at optimum conditions of pH and H2O2 maximum reactive azo dye degradation
was reported at the 169.2 mg/L of TiO2 concentrations. Degradation of reactive azo dye also showed decrease
with TiO2 after certain concentration of TiO2. This could be explained due to increase in opacity and hindrance
of passage of UV light due to excess of TiO2 catalysts (Toor, 2005). Studies also reported that increase in
opacity leads to collision of ground state and activated molecules that further causes latter’s deactivation (Fu,
2007). This collision reduces the effective surface area of the catalyst particles for adsorption of the contaminants (Davis, 1995).
Similar behavior was reported in studies conducted on other organic chemicals such as bisphenol (Kaneco, 2004), hymatoxylin (Sioi, 2006), chloramphenicil (Chatzitakis, 2008) and paracetomol (Yang, 2008).
4.0.
CONCLUSIONS
From the above mentioned outcomes of this study, it could be concluded that photocatalytic treatment of wastewater contaminated with reactive azo dye has proven to be a promising method. At 169 mg/L concentration of TiO2 and pH of 5.48 an efficient treatment of 73.3% of the dye was achieved. Moreover,
response surface methodology has also proven to be an prominent technique in reducing the number of steps for optimization of the process parameters and vis-à-vis lower down the cost of the treatment process. Along with this, in countries like India where a sunlight is available almost all around the year and where textile industry is
also advancing, such a treatment technology can prove to be beneficial.
REFERENCES
[1.] Benatti, C. T., Tavares, C. R. G., Guedes, T. A. Optimization of Fenton's oxidation of chemical laboratory wastewaters using the response surface methodology, J. Environ. Manage. 80 (2006) 66-74.
[2.] Chatzitakis, A., Berberidou, C., Paspalsis, I., Kyriakou, G., Sklaviadis, T., Poulios, I. Photocalalytic degradation and drug activity reduction of chloramphenicol, Water Res. 42 (2008) 386-394.
[3.] Davis, R.J., Gainer, K. A., Neal, G.O., Wenwu, I. Photocatalyticdecolourisation of wastewater dyes, Water Environ. Res. 66 (1995) 50–53.
[4.] Deng Y, Englehardt JD. Treatment of landfill leachate by the Fenton Process. Water Research. 2006; 40: 3683-3694.
[5.] Ehrig H, Stegmann R. Biological process. In: Landfilling of Waste: Leachate, London, New York: Elsevier Applied Science (Chapter 3.1); 1992.
70 | P a g e
semiconductor analysis, Chem. Rev. 95(1995) 69-96.
[8.] Irie, H., Maruyama, Y., Hashimoto, K. Ag- and Pb2+ doped SrTiO3photocatalysts. A correlation between
band structure and photocatalytic activity, J. Phys. Chem. C 111 (2007) 1847.
[9.] Kaneco, S., Rahman, M. A., Suzuki, T., Katsumata, H., Ohta, K. Optimization of solar-photocatalytic degradation conditions of bisphenol A in water using titanium dioxide, J. Photochem. Photobiol. A 163 (2004) 419-424.
[10.] Kiely G. Solid waste treatment. Environmental engineering, New York, McGraw Hill. 1997; 623–692. [11.] Kiril, M. B., Yonar, T., Yalili, K. M., Kestioglu, K. Pre-treatment studies on olive oil mill effluent using
physicochemical Fenton and Fenton-like oxidations processes, J. Hazard. Mater. 174 (2010) 122-128. [12.] Mills, A., Hunte, S.L., 1997. An overview of semiconductor photocatalysis, J. Photochem. Photobiol. A.
108 (1997) 1-35.
[13.] Pekakis, P.A., Xekoukoulotakis, N.P., Mantzavinos, D., Treatment of textile dyehouse wastewater by TiO2 photocatalysis, Water Res. 40(2006) 1276-1286.
[14.] Sioi, M., Bolosis, A., Kostopoulou, E., Poulios, I., Photocatalytic treatment of colored wastewater from medical laboratories: photocatalytic oxidation of hematoxylin, J. Photochem. Photobiol. A. 184 (2006) 18-25.
[15.] Toor, A. P., Verma, A., Jotshi, C. K., Bajpai, P. K., Singh, V. Photocatalytic degradation of 3,4- dichlorophenol using TiO2 in a shallow pond slurry reactor, Indian J Chem Technol. 12 (2005) 75. [16.] Walling C. Fenton's reagent revisited. Acc. Chem. Res. 1970; 8: 125-131.
[17.] Wang, P. I., Lau, W. C., Fang, H. H. P., Zhou, D. Landfill leachate treatment with combined UASB and Fenton coagulation, J. Environ. Sci. Health A: Toxic/Hazardous Subst. Environ. Eng. 35 (2000).