*Corresponding author, E-mail: [email protected]
GROWTH AND YIELD RESPONSE OF WHEAT GENOTYPES TO RAINFED
CONDITION OF ASSAM
PRAKASH KALITA*, RANJAN KALITA, RANJAN DAS AND BIMAL KUMAR RABHA
Department of Crop Physiology, Assam Agricultural University, Jorhat -785013 Received on 12th July, 2010, Revised and Accepted on 15th March, 2011
SUMMARY
Non-availability of well adapted genotypes for rainfed situation of Assam is the major factor contributing to poor productivity of wheat in Assam. This crop is raised with residual moisture left behind by the previous winter rice, because of which the crop faces terminal moisture deficit especially during the pre-anthesis period right from seed germination stage, affecting badly the various physiological processes resulting in lower yield realization. In order to address this crucial production problem, a study was undertaken with seven genotypes of wheat namely Sonalika, HDR-77, PBW-343, PBW-154, Raj-3077, C-306 and K-8027 under rainfed situation during the normal crop season to evaluate their growth and yield performance. The genotypes C-306 followed by PBW-343 were found to be the highest biomass producers at various stages of plant growth. These two genotypes accumulated higher vegetative dry matter, recorded longest root length, higher root surface area and root to shoot ratio at maximum tillering and ear emergence stages, and higher leaf area duration after anthesis, soluble protein content in flag leaf, total plant dry matter, number of effective tillers and grain growth rate.
Key words: Dry matter partitioning, grain yield, phenological stage, rainfed, grain growth rate (GGR).
INTRODUCTION
In Assam wheat is presently being grown in an area of 0.1 million hectares and it is rainfed (Saikia et al. 2006). Wheat growing is gradually gaining popularity in Assam since early seventies, especially in view of the frequent failure of winter rice (Sali) owing to flood as well as irregular monsoon rains. The productivity of wheat in Assam is only 1219 kg per hectare (Anonymous 2004) compared to the national average of 2900 kg/ha which mainly appears to be due to lack of irrigation facility and also non-availability of well adapted genotypes for rainfed situation of this region.
reaches around 76% during grain filling stage. Assam receives substantial amount of rainfall during grain filling and maturation (mean around 80 mm per month) because of which pre harvest sprouting occurs in a number of wheat genotypes. Daily average bright Sunshine hours varies between 4 to 6 hours and the highest Sunshine hour of above 7 hours is received during February which corresponds to flowering stage of the crop.
Better expression of inherent potential and efficient utilization of environment and soil resources is dependent on effective development of plant parts, dry matter production and plant dry matter allocation between roots and shoots (Zhao et al. 1997). Maintenance of better root length and surface area especially during moisture shortage period is a contributing factor leading to realization of potential yield. Zheng et al. (2006) found that better adapted rice varieties exhibited increase in maximum root length, root surface area and grain yield under moisture deficit situation compared to the poorly adapted genotypes.
Wheat plants can respond to nutrient and water stress via various mechanisms; viz. alternations of root branching and root extension rates (Horst et al. 1996), higher root: shoot ratios (Manske, 1989; Hamblin et al. 1990), more and longer root hairs (Foehse et al. 1991), and by lowering demand for nutrients and water for growth. Grain growth takes place entirely during post – anthesis period and is determined by the rate and duration of grain filling (McMaster 1997). Grain filling is directly related to efficiency of the photosynthesing part of plant (leaf) as well as remobilization of photosynthates from vegetative parts. As the enzyme ribulose-bis–phosphate carboxylase and other photosynthetic enzymes constitute a major fraction of the soluble protein in the leaves, a relationship between soluble protein and photosynthetic rate is expected. Consequently biomass production and grain yield may also have a causal relationship with soluble protein content
Keeping in view the above facts, a study was undertaken with seven genotypes of wheat differing in crop duration and adaptability; namely Sonalika, HDR-77, PBW-343, PBW-154, Raj-30HDR-77, C-306 and K-8027 to evaluate them for dry matter yield, partitioning pattern,
root characters and yield parameters under rainfed situation of Assam.
MATERIALS AND METHODS
The crop was raised for two years during Rabi as a normal season crop in the instructional cum research farm, Assam Agricultural University, Jorhat-13. The surface soil of the experimental plot was sandy loam in texture with a pH of 5.16. Geographical location of Jorhat is 26.470N latitude and 940 12 E longitude with an altitude of 86.6 meters above mean sea level.
Weekly average rainfall received during the crop season was 21.15 mm. During the period between first week of December and third week of January there was no rainfall which corresponded with the tillering and jointing stage of the crop, however the rain fall again resumed from mid of January and it continued till the harvest. Soil moisture content was between 12-13% from sowing to ear emergence, thereafter it was between 14-18%. Rows were made maintaining a gap of 20 cms in between in which three seeds were sown at every 10 cm. After germination, thinning was done and retained only one plant in each spot of sowing. Recommended package of practices were followed with a fertilizer dose of 40:20:20 kg N:P :K/ha. Entire dose of fertilizer N, P, K was applied basally two days before sowing.
duration was calculated using the formula suggested by Friend et al. (1962). Data on various traits were statistically analyzed by the methods of analysis of variance as described by Panse and Sukhatme (1978).
RESULTS AND DISCUSSION
Growth and growth parameters
Total plant dry matter accumulation: At all the stages
of observation significant variation was observed among the genotypes in terms of accumulated plant dry matter and the genotype C-306 recorded the highest value (2.75, 9.0 and 17.87 g plant-1 at two leaf, ear emergence and dough stage respectively, Table 1); this genotype was closely followed by PBW-343 (2.07, 8.02 and 15.73 respectively). The genotypes Sonalika and HDR-77 accumulated comparatively lower plant dry matter in all the three stages of observation.
Dry matter accumulation in leaf: Significant variation
in accumulated leaf dry matter was observed among the genotypes in all the stages of observations. At two leaf and ear emergence stage, PBW-343 showed highest value of accumulated leaf dry matter (1.01 and 1.49 g plant-1, Table1) followed by C-306 (0.96 and 1.48) and K-8027 (0.77 and 1.43). Genotype Sonalika (0.40) and HDR-77 (1.16) recorded the least leaf dry matter at two leaf and ear emergence stage respectively. At two leaf and ear emergence stage the genotypes C-306 and PBW-343 could maintain higher leaf area (data not shown). At dough stage the genotype C-306 recorded the highest value of leaf dry matter (1.87) followed by Raj-3077 (1.81), Sonalika (1.79) and K-8027 (1.78) and lowest leaf dry weight was found in case of PBW-343 (1.43). During grain filling since only the flag leaves are the primary source of current assimilate and most other leaves get senesced, the reduced share of total plant bio-mass by leaves at dough stage as observed in the genotype PBW-343 compared to previous stages may be of advantage for higher grain yield. Kumar et al. (2000) also has reported changes in leaf dry matter with stages of growth in wheat varieties.
Dry matter accumulation in stem: At two leaf stage
and at ear emergence stage the genotype PBW-343 was found to be the highest stem dry matter accumulator
(0.75 and 1.39 g plant-1,Table 1) followed by C-306 (0.73and 1.38), however PBW-343 did not show higher values of stem dry matter at dough stage. The lowest value of accumulated stem dry matter was found in Sonalika at two leaf stage but at ear emergence and dough stage HDR-77 recorded the lowest value of stem dry matter. Turner and Begg (1981) and Ehdaie et al. (2006) highlighted the important contribution of remobilized stem dry matter during post anthesis period to grain yield in wheat, considering the fact that photosynthesis declines drastically at that period.
Dry matter accumulation in root: At two leaf stage,
Table 1.
Dry matter accumulation and partitioning (g/plant) in wheat genotypes at different stages of growth.
Dry matter partitioning pattern
Genotype
Two leaf stage
Ear emergence stage
Dough stage Leaf Stem Root Total Leaf Stem Root Spike Total Leaf Stem Root Spike Total Sonalika 0.40 0.27 0.25 0.91 1.32 1.15 0.98 2.65 6.11 1.79 1.47 1.01 7.07 11.34 HDR-77 0.43 0.35 0.31 1.09 1.16 0.56 0.70 2.49 4.92 1.55 1.36 0.73 8.10 11.74 PBW-343 1.01 0.75 0.31 2.07 1.49 1.39 1.66 3.48 8.02 1.43 1.39 1.90 11.01 15.73 PBW-154 0.74 0.35 0.43 1.53 1.35 1.06 0.97 3.09 6.47 1.76 1.52 1.08 10.26 14.62 Raj-3077 0.62 0.48 0.27 1.37 1.31 1.23 1.01 3.09 6.64 1.81 1.57 1.17 8.83 13.38 C-306 0.96 0.73 1.06 2.75 1.48 1.38 2.59 3.54 9.00 1.87 1.66 2.85 11.49 17.87 K-8027 0.77 0.54 0.20 1.51 1.43 1.28 1.03 2.99 6.73 1.78 1.66 1.09 9.34 13.87 S E d 0.04 0.05 0.05 0.08 0.03 0.03 0.15 0.04 0.22 0.03 0.02 0.48 0.06 0.56
CD at 0.05
correlation between economic yield and biological yield, harvest index in sorghum. Genotype HDR-77 although showed third highest value of harvest index, due to its lower total dry weight, the grain yield was one of the lowest. In the present investigation reproductive dry matter at ear emergence stage was found to have significant positive correlation with plant dry matter (r=0.89).
Longest root length: The genotype C-306 recorded
the highest value of longest root length (53.97,56.33 and 75.03 cm at maximum tillering, ear emergence and dough stage respectively, Table2). The genotypes PBW-343 and Raj-3077 also recorded comparatively higher values of longest root length next to C-306.
Root surface area: At maximum tillering and ear
emergence stage highest root surface area was found in PBW-343 (53.50 and 54.33 sq. cm respectively, Table 2) followed by C-306 (48.00 and 52.17, respectively). However, at dough stage the genotype C-306 recorded the highest root surface area (54.93) followed by PBW-343 (55.50).
Root to shoot dry weight ratio: Significant genotypic
variation was observed in respect of root: shoot dry weight ratio at all the stages of observation. At maximum tillering the genotype K-8027 showed the highest value Genotypic differences in partitioning of assimilates
between roots and shoots have been reported in wheat (Sadhu and Bhaduri 1984). In the present study at maximum tillering the genotype K-8027 registered the highest value of root: shoot dry weight ratio (1.55) but at later stages C-306 and PBW-343 recorded the highest values (Table 2).
Dry matter accumulation in reproductive parts: Genotype C-306 recorded the highest reproductive dry matter (3.54 g plant-1,Table 1) at ear emergence followed by PBW-343 (3.48), PBW-154 and Raj-3077 (3.09). The lowest reproductive dry matter was found in genotype HDR-77 (2.49). The genotype C-306 had registered the highest dry matter accumulation in reproductive parts at dough stage (11.49) which was followed by PBW-343 (11.01) and PBW-154 (10.26) and Sonalika had recorded lowest reproductive dry matter (7.07). The genotypes HDR-77 and Sonalika registered the lowest values of spike dry matter accumulation at ear emergence and dough stage respectively. These two genotypes showed lower total plant biomass accumulation which could be the factor responsible for lower values of reproductive dry matter in them. Total plant dry matter along with higher harvest index is one of the important factors for increased grain yield. Tariq et al. (2007) reported a significant positive
Table 2. Longest root length, root surface area and root to shoot dry weight ratio of wheat genotypes at different
stages of growth.
Longest root length (cm) Root surface area (cm2/plant) Root: shoot ratio
Genotype Maximum Ear Dough Maximum Ear Dough Maximum Ear Dough tillering emergence stage tillering emergence stage tillering emergence stage
Sonalika 30.58 33.00 54.20 30.67 34.50 36.00 0.56 0.98 1.08
HDR-77 12.79 27.30 47.33 35.50 38.17 39.93 0.93 1.12 1.19
PBW-343 38.07 46.57 62.40 53.50 54.33 55.50 1.25 0.90 1.27
PBW-154 28.70 44.83 59.38 24.50 27.97 29.27 1.03 0.83 0.87
Raj-3077 42.23 45.20 63.97 32.17 39.50 41.50 1.05 0.98 1.00
C-306 53.97 56.33 75.03 48.00 52.17 54.93 0.97 1.32 1.14
K-8027 35.13 36.26 36.73 35.97 46.27 46.33 1.55 1.08 0.90
SEd 0.49 1.08 0.48 1.21 0.93 1.02 0.10 0.23 0.07
(1.55, Table 2) while Sonalika showed the lowest value (0.56). At ear emergence C-306 registered the highest value of root to shoot dry weight ratio (1.32) however at dough stage PBW-343 recorded the highest (1.27).
Leaf area duration: The genotypes differed widely in
terms of leaf area duration measured between anthesis and 15 days after anthesis. The genotype PBW-343 recorded the highest LAD value of 47.3 (Table 3) closely followed by C-306 (45.68) and the lowest value was found in Sonalika (32.40). Maintenance of higher LAD in the genotypes PBW-343 and C-306 may be one of the factors responsible for higher grain yield by way of maintenance of higher current photosynthate supply to developing grains.
Soluble protein content in flag leaf: At 15 days after
anthesis the genotype C-306 recorded the highest soluble protein content in flag leaf (5.36 mg g-1 fw, Table 3) followed by PBW-343 (4.87). C-306 and PBW-343 also showed higher values of specific leaf weight of flag leaf after anthesis (published elsewhere), supporting higher photosynthetic increment in leaf weight.
Grain growth rate: Significant variation was observed
among genotypes in terms of grain growth rate measured between 7 and 15 days after anthesis, with PBW-343
showing the highest value (1.27 mg day-1,Table 3) followed by PBW-154 (1.15) and C-306 (1.14). The genotype PBW-343 took comparatively longer duration for anthesis and shorter duration from anthesis to maturity. Genotype PBW-343and C-306 recorded higher number of grains per ear and 1000 grain weight in the present study, however Ehdaie et al. (2008) opined that genotypic variation in linear rate of grain growth was not significantly correlated with either the number of grain per spike or grain weight
Yield attributes and yield
Biological yield at harvest: Significant genotypic
variation was recorded in terms of this trait. Genotype C-306 showed the highest value (848.0 g m-2,Table3) followed by PBW-343 (755.6) and the lowest biomass content was found in Raj-3077 (434.8).
Number of ears: Significant variation in the number of
ears was observed among the genotypes. Genotype C-306 showed the highest value for this trait (218.10 m -2, Table 3) followed by K-8027 and HDR-77 (190.0 and 185.0 respectively). Khumkar et al. (2001) reported a significant positive association of grain yield per plot with the final number of tillers per meter length.
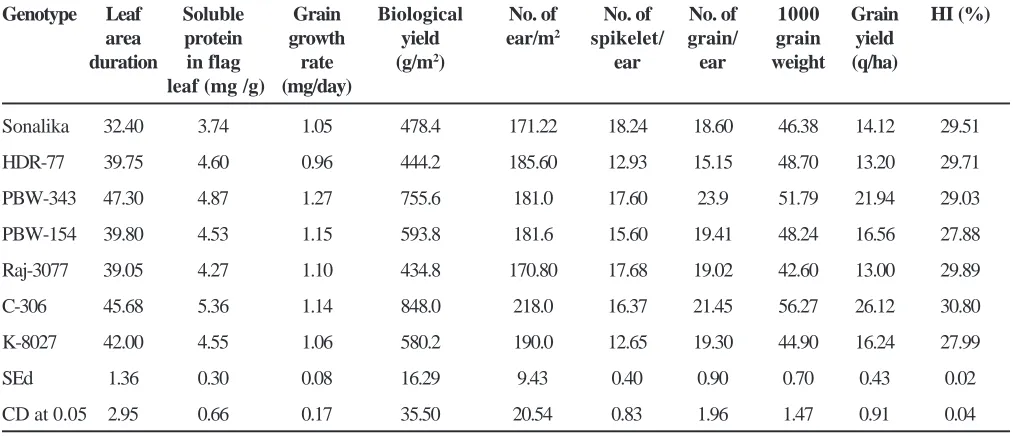
Table 3. Physiological traits and yield characters of wheat genotypes
Genotype Leaf Soluble Grain Biological No. of No. of No. of 1000 Grain HI (%) area protein growth yield ear/m2 spikelet/ grain/ grain yield
duration in flag rate (g/m2) ear ear weight (q/ha)
leaf (mg /g) (mg/day)
Sonalika 32.40 3.74 1.05 478.4 171.22 18.24 18.60 46.38 14.12 29.51
HDR-77 39.75 4.60 0.96 444.2 185.60 12.93 15.15 48.70 13.20 29.71
PBW-343 47.30 4.87 1.27 755.6 181.0 17.60 23.9 51.79 21.94 29.03
PBW-154 39.80 4.53 1.15 593.8 181.6 15.60 19.41 48.24 16.56 27.88
Raj-3077 39.05 4.27 1.10 434.8 170.80 17.68 19.02 42.60 13.00 29.89
C-306 45.68 5.36 1.14 848.0 218.0 16.37 21.45 56.27 26.12 30.80
K-8027 42.00 4.55 1.06 580.2 190.0 12.65 19.30 44.90 16.24 27.99
SEd 1.36 0.30 0.08 16.29 9.43 0.40 0.90 0.70 0.43 0.02
Number of spikelets per ear: A perusal of the data on number of spikelet per ear at harvest revealed that Sonalika recorded the highest value (18.24, Table 3) and K-8027showed the lowest (12.65). Genotype Raj-3077 registered the second highest value (17.68). The genotype C-306 showed the highest number of ears per square meter but it had moderate number of spikelet per ear. This finding was in contrary to the report of Khawas et al. (1999) in which they opined that in wheat the increased number of spikelet per ear was associated with more number of effective tillers per meter length. In the present study the highest grain yielder viz. C-306 and PBW-343 did not show higher number of spikelet per ear.
Number of grains per ear: The genotype PBW-343
registered the highest values of number of grains per ear (23.9, Table 3) followed by C-306 (21.45) and PBW-154 (19.41) and the least value was observed in HDR-77 (15.15). Highest number of grains per ear in PBW-343 and C-306 may be related to the higher number of fertile florets per ear. Entz and Fowler 1990) also reported differential response of wheat genotypes under water deficit condition, resulting in production of variable number of grains per spike. Arduini et al. (2006) were of the opinion that an improved partitioning of dry matter to the developing kernels leads to increased number of kernels per unit area and increased kernel weight.
Thousand grain weight: Genotypes showed significant
variation in 1000 grain weight. Genotype C-306 recorded the highest value (56.27 g, Table 3) followed by PBW-343 (51.79) and the Raj-3077 registered the lowest value (42.60). Bush and Kofoid (1982) reported that the number of spikelets per ear was negatively correlated to grain test weight. This again appears to be a matter of competition amongst the spikelets of individual ear for photosynthates. In present study, the genotype C-306 and PBW-343 showed higher values of 1000 grain weight but, their values for number of spikelet per ear were only moderate ones. Khan et.al (2010) reported positive correlation between grain yield with tillers per unit area and number of grains spike-1 and negative correlation of grain yield with 1000 grain weight in rice.
Grain yield: Significant variations were observed among
genotypes for this trait; C-306 showing the highest yield
(26.12 q/ ha, Table 3) followed by PBW-343 (21.94). Genotype Raj-3077 showed the least value (13.00). Khawas et al. (1999) also reported higher grain yield in genotype C-306, compared to a number of other genotypes under rainfed condition. Papakosta (1994) showed the existence of positive correlation between grain yields with number of grains expressed per unit area. In the present study also the higher grain yielder viz. C-306 and PBW-343 recorded higher number of grains per ear. Kumar et al. (2006) reported higher remobilization of assimilates to fill the grains from stem and leaves in high yielding rice cultivars under drought situation. In wheat, pre-anthesis assimilate reserves from stem and sheath contribute 25-33 % of the final grain weight (Hans, 1993; Gebbing and Schnyder, 1999). Fanny et al. (2008) reported that due to breeding efforts contribution of pre-anthesis assimilates to grain yield increased to values of 31 and 27 % in Italian and Spanish modern cultivars of wheat respectively. The recorded higher grain yield in C-306 and PBW-343 also indicates their higher capacity for grain development at a comparatively higher post-anthesis average temperature of around 21 degree Celsius as it has been reported that mean temperature greater than 15-18 degree Celsius following anthesis can result in decrease in grain weight at maturity (Wardlaw 1994).
Harvest Index: Significant genotypic variation was
recorded in respect of harvest index. The genotype C-306 recorded the highest value (30.80 %, Table 3) followed by Raj-3077 and HDR-77 (29.89 and 29.71 respectively). PBW-154 showed the lowest value of harvest index.
production. These two genotypes allocated greater amount of dry matter to stem and leaf at two leaf and ear emergence stage. Maintenance of higher total plant dry matter and current photosynthesis through out the crop season may be considered as one of the major contributors towards realization of higher grain yield in these two genotypes.
REFERENCES
Anonymous (2004). Agricultural guide book, Argil. Information Press, Department of Agriculture, Assam, India, pp.37
Ansari, S.A., Kumar, P. and Gupta B.N. (1995). Root surface area measurements based on adsorption and desorption
of nitrite. Plant Soil. 175: 133-137.
Arduini, I., Masoni, A., Ercoli, L. and Mariotti, M. (2006). Grain yield and dry matter and nitrogen accumulation and remobilization in durum wheat as affected by variety and
seeding rate. Euro. J. Agron. 25: 309- 318.
Bush, L.N. and Kofoid, W.A. (1982). Physiological studies on
nitrogen metabolism and grain yield in wheat (Triticum
aestivum L). J. Plant Nutr. 3: 842-852.
Egle, K., Manske, G.G.B., Romer, W. and V1ek, P.L.G. (1999). Improved phosphorus efficiency of three new wheat genotypes from CIMMYT in comparison with an older
Mexican variety. J. Plant Nutr. Soil Sci.162: 353-358.
Ehdaie, B., Alloush, G.A., Madore, M.A. and Waines, J.G. (2006). Genotypic variation for stem reserves and mobilization in wheat : II. Photosynthesis changes in
internode water soluble carbohydrates. Crop Sci. 46:
2093-2103.
Ehdaie, B., Alloush, G.A., Madore, M.A. and Waines, J.G. (2008). Genotypic variation in linear rate of grain growth and contribution of stem reserves to grain yield in
wheat. Field Crops Res. 106: 34-43.
Entz, M.H. and Fowler, D.B. (1990). Differential agronomic response of winter wheat cultivars to pre anthesis
environmental stress. Crop Sci. 30: 1119- 1123.
Fanny, A., Julio, I., Dolors, V., Luis, F., Garcia del, M. and Conxita, R. (2008). Breeding effects on grain filling, biomass partitioning, and remobilization in
Mediterranean Durum wheat. Agron. J. 100: 361-370.
Fohse, D., Claassen, N. and Jungk, A. (1991). Phosphorus efficiency of plants. II. Significance of root radius, root hairs and cation-anion balance for phosphorus influx
in seven plant species. Plant Soil. 132: 261-272.
Friend, D.J.C., Helson, V.A. and Eisher, J.E. (1962). Leaf growth in marquis wheat as regulated by temperature,
light intensity and day length. Can. J. Bot. 40:
1299-1311.
Gebbing, T. and Schnyder, H. (1999). Pre-anthesis reserve utilization for protein and carbohydrate synthesis in
grains of wheat. Plant Physiol. 121: 871-878.
Hans, S. (1993). The role of carbohydrate storage and redistribution in the source –sink relations of wheat and
barley during grain filling – a review. New Phytol. 123:
233-245.
Horst, W.J., Abdou, M. and Wiesler, F. (1996). Differences between wheat cultivars in acquisition and utilization
of phosphorus. Z Pflanzenerniihrung Bodenkunde.
159: 155.
Kanbar, A., Toorchi, M. and Shashidhar, H.E. (2009). Relationship between root and yield morphological
characters in rainfed low land rice (Oryza sativa L.).
Cereal Res. Commun. 37: 261-268.
Khan, A.J., Azam, F. and Ali, A. (2010). Relationship of morphological traits and grain yield in recombinant
inbred wheat lines grown under drought conditions Pak.
J. Bot. 42: 259-267.
Khawas, B., Bhattacharjee, I. and Sutradhar, A.K. (1999). Varietal discrimination and variance analysis of wheat
(Triticum aestivum). Ann. Agric. Res. 20: 43-46.
Khumkar Mahesh, S., Choudhury, H.B. and Deshmukh, P.S. (2001). Genetic variability and association of morpho physiological characters with grain yield in late sown
wheat (Triticum aestivum L. em Thell). Ann. Agric. Res.
22: 217-220.
Kumar, S., Singh, M. and Verma, R.S. (2000). Pattern of photosynthates partitioning and its remobilization
during grain growth period in wheat varieties. Ann.
Agric. Res. 21: 267- 270.
Kumar, R., Sarawgi, A.K., Ramos, C., Amarante, S.T. Ismail, A.M. and Wade, L.J. (2006). Partitioning of dry matter
during drought stress in rainfed lowland rice. Field
Kumar, P., Lakshmi, J., Dube, N. and Mani V.P. (2000). Genotypic differences in photosynthesis and its associated parameters in relation to yield among barnyard millet genotypes under rain fed conditions in
hills. Indian J. Agric. Sci. 70: 374-377.
Lowry, O.H., Rosenborough, N.J., Farr, A.L. and Randall, R.J. (1951). Protein measurement with the Folin’s phenol
reagent. J. Biol. Chem. 193: 265-275.
McMaster, G.S. (1997). Phenology, development and growth
of wheat (Triticum aestivum) shoot apex : A review.
Advan. Agron. 59: 63-118.
Panse, V.G. and Sukhatme, P.V. (1978). Statistical methods for agricultural workers. Pub. ICAR, New Delhi.
Papakosta, D.K. (1994). Analysis of wheat cultivars differences in grain yield, grain nitrogen yield and
nitrogen utilization efficiency. J. Agron. Crop Sci. 172:
3015-3016.
Sadhu, D. and Bhaduri, P.N. (1984). Variable traits of roots
and shoots of wheat. Z Acker- Pflanzenbau. 153: 216.
Samtsevich, S.A. (1965). Active secretions of plant root and
their significance. Fiziol Rast. 12: 837-846.
Saikia, T.P., Barman, B. and Ortiz Ferrara, G. (2006). Participatory evaluation by farmers of on-farm seed
priming in wheat in Assam, India in Proceedings of 13th
Agronomy conference 2006, 10-14 Sept 2006 Perth,
Western Australia Eds. N.C. Turner, Acuna T and Johnson R.C.
Siddique, K.H.M. Belford, R.K. and Tennant, D. (1990). Root/ shoot ratio of old and modern tall and semi-dwarf wheat
in a Mediterranean environment. Plant Soil. 121:
89-98.
Tariq, M., Awan, S.I. and Irshad-ul-Haq, M. (2007). Genetic Variability and Character Association for Harvest Index
in Sorghum under Rainfed Conditions. Intern. J. Agric.
Boil. 3: 470–472.
Turner, N.C. and Begg, R.A. (1981). Plant productivity in arid
and semi arid zones. Annu. Rev. Plant Physiol. 29:
277-317.
Wardlaw, I.F. (1994). The effect of high temperature on kernel development in wheat: variability related to pre-heading
and post anthesis conditions. Aus. J. Pl. Physiol. 21:
731- 739.
Weiner, J. (1990). Plant population ecology in agriculture. In:
Ronald, C., Carrol et al. (Eds.), Agroecology.
McGraw-Hill, New York, pp. 235-261.
Zhao, S.L., Li, F.M. and Zhang, D.Y. (1997). Crop production
is a population process. Acta Ecol. Sin. 17: 100-104.
Zheng, B., Jiang, D., Wu, P., Weng, X., Lu, Q. and Wang, N.
(2006). Relation of root growth of rice seedling with
nutrition and water use efficiency under different water