November-December 2018 996
Research Paper
Tuberculosis (TB) treatment regimens followed in India under the Revised National Tuberculosis Control Programme (RNTCP) 1997. The initial phase of category-III TB (new cases of smear-negative pulmonary TB with limited parenchymal involvement or less severe forms of extrapulmonary TB, viz., lymph node TB, unilateral pleural effusion, bone (excluding spine), peripheral joint or skin TB) treatment, the
combinations of first-line antitubercular drugs (ATDs),
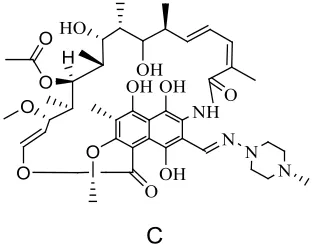
isoniazid (INH), pyrazinamide (PYZ) and rifampicin (RIF) are widely used daily per week for at least 2 mo[1]. Structures of these first-line three ATDs are depicted
in fig. 1A, B and C, respectively. These combination
preparations are available in the world market. The International Union against tuberculosis and lung disease and the World Health Organization recognize
the potential benefits of using such preparations[2,3]. Spectrophotometric and reversed-phase high-performance liquid chromatography (RP-HPLC) techniques have been reported for individually or the
combination of two or more ATDs and other drugs
estimation in biological samples and pharmaceutical formulations[4-19]. In the previous years, simultaneous estimation of INH, PYZ and RIF in fixed combination
of unit doses by high-performance thin layer chromatography[20], multivariate spectrophotometric calibration method[21] and calorimetric analysis[22] have been published. However, many of these methods suffer from limitations such as complex and tedious procedures and are not validated as well.
HPLC is the method of choice for analysis of multi-component pharmaceutical preparation because
of its sensitivity, reproducibility and specificity.
The problems associated with optimization of chromatographic conditions such as selection of column type, column temperature, the composition of
Development and Validation of a RP-HPLC Method for
Simultaneous Estimation of Antitubercular Drugs in Solid
Lipid Nanoparticles
S. KHATAK, MAMTA KHATAK, F. ALI1, ASHU RATHI1, R. SINGH1, G. N. SINGH1 AND H. DUREJA*
Department of Pharmaceutical Sciences, Maharshi Dayanand University, Rohtak, Haryana-124 001, 1Indian Pharmacopoeia
Commission (IPC), Sector–23, Raj Nagar, Ghaziabad-201 003, India
Khatak et al.: Simultaneous Estimation of Antitubercular Drugs in SLNs
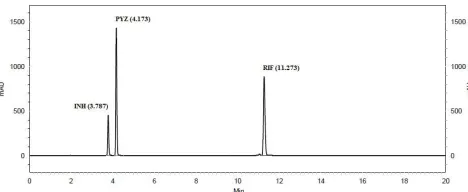
A new simple, rapid and sensitive reversed-phase high-performance liquid chromatography method was developed and validated as per International Conference on Harmonization guidelines, Q2 (R1), for simultaneous estimation of isoniazid, pyrazinamide and rifampicin in solid lipid nanoparticles. Separation was achieved on a 250×4.6 mm, 5 μm, C-18 column using a linear gradient flow rate of 1.5 ml/min. Isoniazid, pyrazinamide and rifampicin were identified based on their retention times as compared to standards and confirmed with characteristic spectra on a spectrophotometer at 238 nm and eluted at 3.787, 4.173 and 11.273 min, respectively, achieved within 20 min. This method was linear, precise with % RSD values of 0.18 % for isoniazid, 0.15 % for pyrazinamide and 0.47 % for rifampicin, accurate with mean recovery yields of 101.312 % for isoniazid, 99.910 % for pyrazinamide and 99.767 % for rifampicin and selective over the concentration range of 10-150 % for all the three drugs. This method is suitable due to its simplicity and accuracy for routine quality control and stability analysis of antitubercular drugs-loaded solid lipid nanoparticles.
Key words: Simultaneous estimation, RP-HPLC, isoniazid, pyrazinamide, rifampicin, solid lipid nanoparticles
*Address for correspondence
E-mail: [email protected]
This is an open access article distributed under the terms of the Creative Commons Attribution-NonCommercial-ShareAlike 3.0 License, which allows others to remix, tweak, and build upon the work non-commercially, as long as the author is credited and the new creations are licensed under the identical terms
997
the mobile phase, selection of the specific wavelength
and injection volume. In spite of the fact, this method undoubtedly provides the more sensitive determination than the spectrophotometric methods. It has now become the method of choice for most of the drug and their combinations. Gaitonde and Pathak reported a RP-HPLC method for the simultaneous estimation of INH, PYZ and RIF. They used tetrabutylammonium hydroxide as an ion-pairing agent in the mobile phase which shortens column life[23]. Calleri et al. developed an HPLC method having high buffer concentration in the
mobile phase of acetonitrile (A) and 50 mM phosphate buffer pH 3.5 (B). The gradient profile was (A:B) 3:97 v/v for 5 min, then a linear gradient to 50:50 v/v at 30 min and return to 3:97 v/v in 10 min. Chromatography was performed at room temperature using a flow rate of 1 ml/min and a run time of 40 min. Diode-array detector
with three different corresponding maximum of
254 nm for RIF, 261 nm for INH and 265 nm for
PYZ were used, this method was time consuming
and conditions specific[24]. Dhal and Sharma reported RP-HPLC method for simultaneous estimation of pyridoxine hydrochloride, INH, PYZ and RIF. The result showed that the highest values for limits
of detection (LOD) were 0.043, 0.063, 0.036 and 0.059 µg/ml and limits of quantification (LOQ) were 0.13, 0.19, 0.11 and 0.18 µg/ml, respectively. So, this
method is not sensitive to detect the lowest concentration
of combined ATDs[25]. The Indian Pharmacopoeia 2014
and United States Pharmacopeia 2016 published HPLC
method for simultaneous determination of INH, PYZ and RIF in the tablet and capsule dosage forms[26,27].
The aim of this study was to develop and validate an accurate and sensitive RP-HPLC method for simultaneous estimation of INH, PYZ and RIF in solid lipid nanoparticles (SLNs). The validation results obtained showed that this method was simple, accurate,
precise and suitable for the determination of ATDs in
SLNs.
MATERIALS AND METHODS
The working standards employed for INH, PYZ and RIF were obtained from Indian Pharmacopoeia Commission (IPC) Ghaziabad, Uttar Pradesh, India.
The Poloxamer 118 (Pluronic F-68) was purchased
from HiMedia Laboratory Pvt. Ltd., India. Sodium taurocholate was purchased from LOBA Chemie,
India. Stearic acid (octadecanoic acid), mannitol was
purchased from Qualigens Fine Chemicals (Division
of GSK Pharmaceutical Ltd.). Ortho-phosphoric
acid, sodium hydroxide, methanol and acetonitrile of analytical grade were purchased from Thermo
Fisher Scientific India Pvt. Ltd. Water was deionized by passing through a Milli-Q™ Integral-3 water purification system (M-Millipore, Fisher Scientific
India Pvt. Ltd.).
Chromatographic experiments were performed using a
HPLC instrument (Agilent Technologies 1260 Infinity
with EZ Chrome Elite software) equipped with
auto-sampler, ultra-violet/photodiode-array detector (PDA)
and stainless steel C-18 column (Nucleodur®) packed with octadecylsilane bonded to porous silica (5 µm), 250×4.6 mm (Macherey-Nagel GmbH and Co, Düren,
Germany) and the column temperature was maintained at 30°.
Chromatographic conditions:
Chromatographic analysis were performed in a
linear gradient programme using mobile phase A and mobile phase B with the flow rate of 1.5 ml/min
(Table 1). Chromatographic system set the spectrophotometer at 238 nm and the column temperature was maintained at 30°. The samples
were diluted with orthophosphoric acid (OPA) buffer solution pH 6.8±0.02 and 20 µl was injected into the
column.
Preparation of the solutions:
Buffer solution was prepared by diluting 1 ml of OPA in 1000 ml of water and adjusts the pH 6.8±0.02 with dilute
solution of sodium hydroxide. This buffer solution was
equivalent to 17.85 mmol OPA buffer solution. Mobile phase A used was a mixture of 96 volumes of buffer and 4 volumes of acetonitrile. Mobile phase B used was a mixture of 45 volumes of buffer and 55 volumes
of acetonitrile.
Preparation of stock and standard solution:
Stock solution was prepared using 0.04 % w/v of INH, 0.2 % w/v of PYZ and 0.08 % w/v of RIF in
methanol. The prepared stock solution was stored at 4°
until before use. 5 ml of stock solution was transferred to a volumetric flask and diluted up to 25 ml with buffer. The prepared final concentration of INH, PYZ and RIF were 80, 400 and 160 µg/ml, respectively.
Calibration solutions:
Appropriate dilutions of the stock solution were
998 November-December 2018
40, 50, 60, 70, 80, 90, 100, 110, 120, 130, 140 and 150 % were prepared and analysed for linearity.
Method validation:
Validation of the RP-HPLC method was performed as per the International Conference on Harmonization
guideline, Q2 (R1) specifications after the establishment
of chromatographic and the experimental conditions[28].
System suitability:
To ensure the validity of the analytical procedure, a system suitability test (SST) was established. Percent
relative standard deviation (% RSD) of the area, RSD
of retention time (RT), USP tailing factor, theoretical plates, and resolution were selected for SST. These parameters were analysed by injecting the standard solution six times. The system suitability results are summarized in Table 2 and could be observed as the parameters analysed were in accordance with acceptance criteria.
Specificity:
Specificity of the method was established to ensure that
the components of the SLNs dispersion such as lipid(s)
and surfactant(s), does not interfere in the quantification
of the drugs[29]. The specificity of the method was evaluated by comparing the chromatograms of ATDs
extracted from SLNs and of blank nanoparticles to determine the peak purity.
Linearity:
For linearity, stock solutions of INH, PYZ and RIF at
15 concentrations between 10 to 150 % were injected
in triplicate. Calibration curves of standard INH, PYZ and RIF were generated by plotting the analyte peak area versus % drug concentration. Linearity is
confirmed if the % RSD values of the slope and the
intercept are <1 %.
Precision:
The system precision of the method was determined by performing intra-day and inter-day analysis
by triplicate injections of the QCS. The % RSD (% RSD=SD/mean×100) and % accuracy (% accuracy = mean area of test/mean area of standard×100) were
calculated by comparing the theoretical and measured
concentration for each case (Table 3). According to the ICH guideline, coefficients of variation for the precision shall not exceed 5 %.
Accuracy:
To determine the accuracy of the proposed method, recovery studies were conducted. The extraction
process of the method was quantified by comparing
three separately extracted sample preparation (SLNs
containing ATDs and excipients) against a standard
solution. The acceptance criterion for the extraction
study was the mean recovery of the extracted ATDs
from SLNs relative to the standard solution shown in Table 4.
LOD and lower LOQ:
LOD was the lowest concentration of the analyte
in a sample that could be detected under the
stated experimental condition. LOQ is the lowest
concentration of the active ingredients in a sample that could be determined with acceptable precision
and accuracy. According to the ICH recommendation, the approach based on the standard deviation (SD) of
OH OH NH
OH O
O N N
O HO
N OH
N NH
O NH
2
N N
H2N O
O O O
H
O
A B C
Fig. 1: Chemical structures (A) INH; (B) PYZ and (C) RIF
Time
(min) Flow rate(ml/min) Mobile phase A(% v/v) Mobile phase B(% v/v)
0 1.5 100 0
10 1.5 100 0
11 1.5 0 100
15 1.5 0 100
16 1.5 100 0
20 1.5 100 0
999
the response and slope (m) was used for determining
the detection and quantitation limits. LOD can be
calculated according to the formula, LOD=3.3 (SD/m) and LOQ according to the formula, LOQ=10 (SD/m)[30].
Determination of ATDs encapsulation efficiency
(EE)in SLNs:
SLNs were prepared using a modified microemulsion
technique, freeze-dried and stored at 4°[31]. The mean particle size and the polydispersity index (PDI)
were determined using dynamic light scattering
(Malvern Instruments Ltd. Zetasizer Ver. 7.11), at room temperature. To determine the amount of ATDs in SLNs, 5 mg of lyophilized SLNs were transferred into a 5-ml volumetric flask and 3 ml of ethanol was added. This mixture was heated to 50° with sonication and final volume was made up to 5 ml of ethanol[32,33]. The above solution (1 ml) was placed in a 50 ml volumetric flask and diluted with buffer. The sample
was ultrasonicated for 10 min and filtered with nylon syringe filter (0.22 µm). Further 1 ml of the filtrate
was diluted up to 10 ml with buffer. The sample was analysed by using the designed chromatographic conditions as discussed earlier. Subsequently, the EE was calculated with the help of the reported Eqn.[34], % EE = (total drug–free drug)/(total drug)×100. Where, total drug corresponds to the amount of ATDs
initially added to the SLNs dispersion and free drug is the amount of the drug not incorporated into the lipid
nanoparticle, quantified by RP-HPLC method. The % EE was quantified by RP-HPLC method and the value of % EE was expressed as mean and SD[34].
RESULT AND DISCUSSION
In order to optimize good separation between all the
three ATDs drugs at different buffer pH and organic
solvents like acetonitrile and water tested binary and tertiary eluents. Therefore, best chromatographic
conditions concluded with different ratio of 17.85 mmol OPA buffer (pH 6.8) and acetonitrile, flow rate of 1.5 ml/min and detected at 238 nm. The analytical profile
obtained by injection of a standard working solution
was reported in fig. 2. The analytical profiles obtained
Parameters Limits INH ATDsPYZ RIF
% RSD of the area Less than 2 0.05 0.05 0.06 RSD of retention time Less than 1.0 0.09 0.08 0.02 USP tailing factor Less than 2 1.26±0.069 1.25±0.147 1.27±0.070 Theoretical plates More than 2000 27647±226.57 33317±267.23 98821±268.59 Resolution More than 2 - 3.94±0.01 58.72±0.12
TABLE 2: SYSTEM SUITABILITY RESULTS
System suitability was checked by injecting the working solution six times
QCS Amount (µg/ml)
Standard (Intra-days)
Found (µg/ml) Accuracy (%) Precision (% RSD)
INH PYZ RIF INH PYZ RIF INH PYZ RIF INH PYZ RIF
10 % 8 40 16 7.90 39.60 15.90 98.72 99.00 99.35 0.04 0.05 0.47 50 % 40 200 80 39.64 198.19 79.29 99.09 99.09 99.11 0.18 0.15 0.16 100 % 80 400 160 79.36 396.56 158.27 99.20 99.14 98.92 0.03 0.07 0.06 150 % 120 600 240 119.17 595.15 237.53 99.31 99.19 98.97 0.05 0.02 0.08
Standard (Inter-days)
10 % 8 40 16 7.85 40.11 15.73 98.09 100.28 98.30 0.14 0.01 0.32 50 % 40 200 80 39.84 200.36 79.73 99.60 100.18 99.67 0.03 0.05 0.06 100 % 80 400 160 79.98 400.91 159.74 99.98 100.23 99.84 0.08 0.05 0.07 150 % 120 600 240 119.98 601.05 240.64 99.98 100.18 100.27 0.01 0.01 0.01
TABLE 3: INTRA-DAY AND INTER-DAY PRECISION AND ACCURACY OF INH, PYZ AND RIF
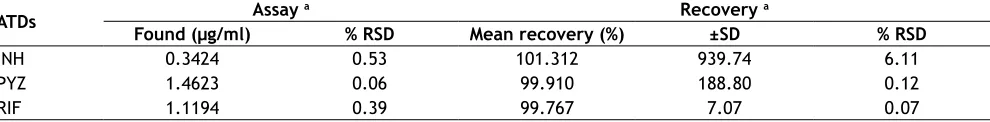
ATDs Found (µg/ml)Assay a % RSD Mean recovery (%) Recovery ±SD a % RSD
INH 0.3424 0.53 101.312 939.74 6.11
PYZ 1.4623 0.06 99.910 188.80 0.12
RIF 1.1194 0.39 99.767 7.07 0.07
TABLE 4: RECOVERY ANALYSIS OF ATDs-LOADED SLNs
1000 November-December 2018
by injection of extracted spiked SLNs without active pharmaceutical ingredients and of extracted spiked
ATDs-loaded SLNs were reported in fig. 3. The SST
parameters such as RT, USP tailing, theoretical plates and resolution for optimizing standard chromatogram are tabulated in Table 2.
The SST is an integrated part of the analytical method and it ascertains the suitability and effectiveness of the operating system. The results were within the limit and are presented in Table 2 and system suitability
chromatogram in fig. 2. The USP tailing factor for the analytes peaks were less than 2.0, the % RSD of the
peak areas responses less than 2 % and the migration times within seconds.
Specificity is the ability of the method to measure the analyte response in the presence of its potential impurities and degradation products[35]. The
representative chromatograms of INH, PYZ and RIF
were identified with the RT as compared with the
standard at 3.887, 4.200 and 11.327 min, respectively.
The specificity studies revealed the absence of any
other excipients interference, since none of the peaks
appeared at the same RT, as shown in fig. 3. The specificity was justified from complete separation
of drugs from SLNs and indicated that there was no
interference in the quantitative determination of ATDs
from SLNs components.
Linear responses were observed in the range of 8-120,
40-600 and 16-240 µg/ml for INH, PYZ and RIF,
respectively. The linear regression analysis obtained by plotting the peak areas of the three analytes versus percent concentration. The result showed excellent
correlation coefficients (R2≥0.999) and the linearity data was reported in Table 5.
Intra-day and inter-day precision, as well as accuracy data obtained from the experiments, are given in
Table 3. The % RSD values for intra-day and inter-day precision study were <0.18 % for INH, <0.15 % for PYZ and <0.47 % for RIF confirming that the method was adequately precise. Accuracy values were >98.09 and <98.98 % for INH, >99.00 and <100.28 % for PYZ and >98.30 and <100.27 % for RIF indicated the level
of accuracy of the method.
The mean recovery data obtained were within 2 %. The mean recovery yields were 101.312, 99.910 and
99.767 % for INH, PYZ and RIF, respectively. The
recovery data is reported in Table 4. Since the results
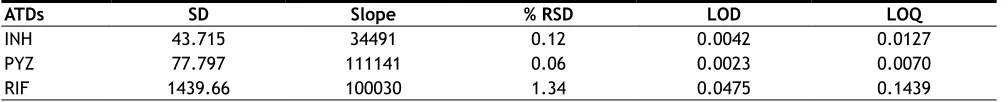
obtained were within the acceptable ±3 % range, the method was deemed to be accurate. Estimation of LOD and LOQ considered the acceptable SD of the response and the slope of the standard curve. The LOD and LOQ
was calculated as 0.0042 and 0.0127 for INH, 0.0023
and 0.0070 for PYZ and 0.0475 and 0.1439 µg/ml for RIF, respectively (Table 6).
The SLNs containing ATDs were successfully obtained
by microemulsion technique and proposed analytical
method was applied to evaluate the EE of ATDs in SLNs. As shown in the specificity test, no alterations
or unusual peaks were observed in the chromatograms during the drug quantitation. The mean recovery yields
were 101.312, 99.910 and 99.767 % for INH, PYZ and
RIF, respectively. The results demonstrated that the
method used was efficient in associating the drugs with
SLNs. The average diameter of the solid nanoparticles
was 374.1±3 nm and PDI (0.436±0.005) indicating
mono-modal size distribution. Therefore, the proposed RP-HPLC method represented an alternative method for the simultaneous estimation of INH, PYZ and RIF
in SLNs. The method fulfilled all requirements and
considered as reliable, feasible and could be applied for the determination of assay, EE, in vitro drug release
and stability of ATDs-loaded SLNs.
The RP-HPLC method developed was found to be a convenient and cost-effective method for the simultaneous estimation of INH, PYZ and RIF in SLNs. This method was validated according to the
ICH guidelines Q2 (R1) and was found to be a reliable
Fig. 2: System suitability chromatogram of INH, PYZ and RIF
Fig. 3: Analytical profile of extracted spiked SLNs without ATDs and with ATDs
1001
and feasible method, which included specificity, linearity, precision, accuracy, LOD and LOQ. The
chromatographic run time was 20 min, which allowed numerous samples to be analysed in a short period, as well as reduced solvent costs and damage to the environment. Hence it was concluded that the validation parameters showed the method to be excellent for the routine quality control analysis of INH, PYZ and RIF
ATDs-loaded SLNs.
Conflict of interest:
The authors confirm that this article content has no conflict of interest.
Acknowledgements:
One of the author’s Sunil Khatak is grateful to IPC, Ghaziabad, UP, India, for providing necessary
instrumental facilities and gift samples of ATDs.
REFERENCES
1. Khatak S, Dureja H. Recent advances in nanotechnology based tubercular chemotherapy. Int J Pharm Sci Nanotech
2015;8(4):2919-34.
2. Global tubercular report 2015, 20th ed. World Health
Organization. 2015; p. 1-115. Available from: www.who.int/ tb/publications/global_report/gtbr15_main_text.pdf.
3. The union health solutions for the poor. International union
against tuberculosis and lung disease, activity report 2012. 68, boulevard Saint-Michel-75006, Paris-France. 2012; p. 1-73. Available from: www.theunion.org/what-we-do/publications/ official/english/Rapport_2012-print5LR6.pdf.
4. Benetton SA, Kedor-Hackmann ER, Santoro MI, Borges VM. Visible spectrophotometric and first-derivative UV
spectrophotometric determination of rifampicin and isoniazid
in pharmaceutical preparations. Talanta 1998;47(3):639-43. 5. Swamy N, Prashanth KN, Basavaiah K. Redox-reaction based
spectrophotometric assay of isoniazid in pharmaceuticals.
ISRN Anal Chem 2014;2014:717019.
6. Kamel MS. Spectrophotometric determination of isoniazid
in pure form and pharmaceutical preparation. World J Chem
2008;3(1):11-6.
7. Tsai IL, Liu HY, Kuo PH, Wang JY, Shen LJ, Kuo CH.
Quantitative determination of isoniazid in biological
samples by cation-selective exhaustive
injection-sweeping-micellar electrokinetic chromatography. Anal Bioanal Chem 2011;401(7):2205-14.
8. Huang J, Zhang C, Zhang Z. Flow-injection chemiluminescence determination of isoniazid with electro-generated hypochlorite.
Fresenius J Anal Chem 1999;363:126-28.
9. Zheng X, Zhang Z. Flow-injection chemiluminescence determination of isoniazid using on-line electrogenerated BrO
as an oxidant. Analyst 1999;124:763-66.
10. Lapa RAS, Lima JLFC, Santos JLM. Fluorimetric
determination of isoniazid by oxidation with cerium (IV) in a
multi-commutated flow system. Anal Chim Acta 2000;419:17-23.
11. Smith PJ, van Dyk J, Fredericks A. Determination of
rifampicin, isoniazid and pyrazinamide by high-performance liquid chromatography after their simultaneous extraction from
plasma. Int J Tuberc Lung Dis. 1999;3(11 Suppl 3):S325-28.
12. Allanson AL, Cotton MM, Tettey LNA, Boyter AC. Determination of rifampicin in human plasma and blood
spots by high-performance liquid chromatography with UV
detection: A potential method for therapeutic drug monitoring.
J Pharm Biomed Anal 2007;44(4):963-69.
13. Li B, He Y, Lv J, Zhang Z. Simultaneous determination
of rifampicin and isoniazid by continuous-flow chemiluminescence with artificial neural network calibration. Anal Bioanal Chem 2005;383:817-24.
14. Padmarajaiah N, Kallanchira S, Ramanathapura V, Hemmige
Y. A novel method for the spectrophotometric determination
of isoniazid and ritodrine hydrochloride. Turk J Chem
2002;26:743-50.
15. Khuhawar MY, Rind FM. High performance liquid
chromatographic determination of isoniazid, pyrazinamide and rifampicin in pharmaceutical preparations. Pak J Pharm
Sci 1998;11(2):49-54.
16. Prasad ST, Rao KNV, Chaithanya Y, Raghavendha P, Surendra
M, Banji D. Method development and validation of RP–HPLC
method for simultaneous estimation of rifampicin, isoniazid and pyridoxine hydrochloride in bulk pharmaceutical dosage
form. Int J Pharm Res Develop 2012;4(8):153-62.
17. Rote AR, Sharma AK. Simultaneous spectrophotometric
determination of rifampicin, isoniazid and pyrazinamide
by first-derivative UV spectrophotometry in the combined pharmaceutical dosage form. Indian J Pharm Sci
1997;59(3):119-23.
18. Khuhawar MY, Rind FMA, Rajper AD. High-performance ATDs Linearity range (µg/ml) Slopea±% RSD Intercepta±% RSD Correlation coefficient (R2)
INH 8–120 34490.67±0.003967 –32035.00±0.234533 0.9980 PYZ 40–600 111140.7±0.000387 –5078.07±0.052567 0.9980 RIF 16–240 100030.3±0.001377 –101244±0.080767 0.9981
TABLE 5: LINEAR REGRESSION ANALYSIS
aMean (n=3)
ATDs SD Slope % RSD LOD LOQ
INH 43.715 34491 0.12 0.0042 0.0127
PYZ 77.797 111141 0.06 0.0023 0.0070
RIF 1439.66 100030 1.34 0.0475 0.1439
1002 November-December 2018
liquid chromatographic determination of isoniazid, pyrazinamide, and indomethacin in pharmaceutical
preparations. Acta Chromatogr 2005;15:269-75.
19. Hammam E, Beltagi AM, Ghoneim MM. Voltammetric assay
of rifampicin and isoniazid drugs, separately and combined in bulk, pharmaceutical formulations and human serum at a
carbon paste electrode. Microchem J 2004;77(1):53-62.
20. Argekar AP, Kunjir SS, Purandare KS. Simultaneous
determination of rifampicin, isoniazid and pyrazinamide by high-performance thin layer chromatography. J Pharm
Biomed Anal 1996;14(11):1645-50.
21. Goicoechea HC, Olivieri AC. Simultaneous determination of
rifampicin, isoniazid and pyrazinamide in tablet preparations by multivariate spectrophotometric calibration. J Pharm
Biomed Anal 1999;20:681-86.
22. Ellard GA. The colourimetric analysis of antitubercular fixed-dose combination tablets and capsules. Int J Tuberc Lung Dis 1999;3(11 Suppl 3):S343-46.
23. Gaitonde CD, Pathak PV. Rapid and sensitive estimation
of isoniazid, pyrazinamide and rifampicin in combined
dosage form by reversed-phase liquid chromatography. Drug Dev Ind Pharm 1991;17(9):1201-14.
24. Calleri E, De Lorenzi E, Furlanetto S, Massolini G, Caccialanza G. Validation of a RP–LC method for the
simultaneous determination of isoniazid, pyrazinamide and rifampicin in a pharmaceutical formulation. J Pharm Biomed
Anal 2002;29:1089-96.
25. Dhal SK, Sharma R. Development and validation of RP–
HPLC method for simultaneous determination of pyridoxine hydrochloride, isoniazid, pyrazinamide and rifampicin in
pharmaceutical formulation. Chem Anal 2009;54(6):1487-500.
26. Indian Pharmacopoeia. 7th ed. The Indian Pharmacopoeia
Commission. India: Indian Pharmacopoeia Laboratory, Govt. of India-MHFW; 2014. p. 2668-9.
27. The United States Pharmacopoeia-39, The National
Formulary-34. Baltimore, Maryland: United State Pharmacopeial Convention, United Book Press; 2016. p. 5707-8.
28. International Conference on Harmonization (ICH), harmonised tripartite guideline for validation of analytical
procedures, text and methodology Q2 (R1). 2005: Part 1; p. 1-13. Available from: www.ich.org/fileadmin/Public_Web_ Site/ICH_Products/Guidelines/Quality/Q2_R1/Step4/Q2_ R1__Guideline.pdf.
29. Ribani M, Bottoli CBG, Collins CH, Jardim ICSF, Melo LFC. Validação em métodos cromatográficos e eletroforéticos. Quim Nova 2004;27(5):771-80.
30. Sehrawat R, Khatak M, Kumar A, Khatak S. Development and validation of RP–HPLC method for simultaneous estimation
of phenylephrine hydrochloride and chlorpheniramine maleate
in pharmaceutical dosage form. Int Pharm Sci 2013;3(2):91-5.
31. Parhi R, Suresh P. Production of solid lipid nanoparticles-drug loading and release mechanism. J Chem Pharm Res
2010;2(1):211-27.
32. Pandey R, Sharma S, Khuller GK. Oral solid lipid
nanoparticle-based antitubercular chemotherapy. Tuberculosis 2005;85(5-6):415-20.
33. Pandey R, Khuller GK. Solid lipid particle-based inhalable sustained drug delivery system against experimental
tuberculosis. Tuberculosis 2005;85(4):227-34.
34. Antunes JOR, Antônio E, Mainardes RM, Khalil NM. Development and validation of HPLC-PDA method
for quantitative determination of diphenyl diselenide in poly(lactide) nanoparticles. Curr Pharm Anal 2016;12:121-8. 35. Garcıia A, Rupérez FJ, Marıin A, Maza A, Barbas C.
Poly (ethylene glycol) column for the determination of acetaminophen. chlorpheniramine and phenylephrine in the pharmaceutical preparation. J Chromatogr B