Retinal Blood Vessel Segmentation Based on Heuristic
Image Analysis
Maja Braovi´c1, Darko Stipaniˇcev1and Ljiljana Šeri´c1
Faculty of Electrical Engineering, Mechanical Engineering and Naval Architecture Ru ¯dera Boškovi´ca 32, 21000 Split, Croatia
Abstract. Automatic analysis of retinal fundus images is becoming increasingly present today, and diseases such as diabetic retinopathy and age-related macular degeneration are getting a higher chance of being discovered in the early stages of their development. In order to focus on discovering those diseases, researchers commonly preprocess retinal fundus images in order to detect the retinal landmarks - blood vessels, fovea and the optic disk. A large number of methods for the auto-matic detection of retinal blood vessels from retinal fundus images already exists, but many of them are using unnecessarily complicated approaches. In this paper we demonstrate that a reliable retinal blood vessel segmentation can be achieved with a cascade of very simple image processing methods. The proposed method puts higher emphasis on high specificity (i.e. high probability that the segmented pixels actually belong to retinal blood vessels and are not false positive detections) rather than on high sensitivity. The proposed method is based on heuristically determined parametric edge detection and shape analysis, and is evaluated on the publicly avail-able DRIVE and STARE datasets on which it achieved the average accuracy of 96.33% and 96.10%, respectively.
Keywords:Retinal blood vessels, fundus images, heuristic analysis, image segmen-tation.
1.
Introduction
According to the World Health Organization (WHO) [27], some of the leading causes of visual impairment are glaucoma, diabetic retinopathy and age-related macular degenera-tion. These diseases can be identified and/or monitored by using a non-intrusive technique called retinal fundus imaging. Retinal fundus imaging is usually performed in hospitals or clinics with a specialized digital mydriatic or non-mydriatic fundus camera the output of which is an image of the retina of the eye. This image shows various retinal landmarks such as blood vessels, optic disc, fovea and macula, but it can also show abnormalities that could potentially represent a sign of disease. Traditionally, an analysis of these images and their subsequent diagnosis was performed by ophthalmologists, specialized medical doc-tors trained to be experts in the field of ophthalmology. Unfortunately, this analysis was often both costly and slow. Today, many automated methods for the detection of abnor-malities in retinal images exist (e.g. [3], [7]), and they often include the segmentation of retinal blood vessels.
modified SUSAN edge detector [37] [38] and shape analysis. For shape analysis we used commonly employed measures such as compactness, rectangularity and eccentricity, and gave detailed analysis of thresholds and constraints we used for their values. The proposed method was evaluated on two publicly available retinal image datasets, DRIVE (Digital Retinal Images for Vessel Extraction) [25] [41] and STARE (STructured Analysis of the Retina) [14] [15], on which it achieved the average accuracy of 96.33% and 96.10%, re-spectively. When compared with a number of existing methods on the same datasets, it achieved the overall highest accuracy and specificity, and the lowest false positive rate (FPR).
The proposed method can serve as one of the first steps in automatic systems whose goal is to detect various retinal abnormalities from retinal fundus images. The application of the proposed method is not limited to medical use only, as there are other applications that use retinal blood vessel segmentation as well (e.g. biometrics [4], [8], [11]).
This paper is structured as follows. In Section 2 we give an overview of the related work. In Section 3 we give an overview of the proposed method for the automatic seg-mentation of retinal blood vessels. In Section 4 we present an evaluation of the pro-posed method and compare it to various state-of-the-art methods on two publicly available datasets. In Section 5 we give a conclusion and discuss future work.
2.
Related work
Methods for automatic retinal blood vessel segmentation can broadly be categorized as either being based on classifiers, matched filters or rules.
Classifier-based methods are fairly recent and they use classifiers to either segment the blood vessels or to improve the segmentation results obtained in some other way. Different classifiers are used for this purpose, such as SVM [42], Bayes [39] or neural networks [19] [21], and they usually perform binary classification, i.e. classify pixels into
vesselornon-vesselcategories.
Matched filters for blood vessel detection in retinal images were introduced by Chaud-huriet al. in [6], where they were constructed on the basis of several properties of the blood vessels, one of them being the property that the gray-level profile of the blood ves-sel’s cross-section can be approximated by a Gaussian curve. Chaudhuriet al.constructed 12 kernels (for 12 different orientations with angular resolution of15◦) to detect piece-wise linear segments that belong to blood vessels, and for each pixel of the image only kept the maximum of responses to those kernels. Matched filters or their improvements and modifications are commonly used today in retinal blood vessel detection, for example in [2], [5], [18], [40], [43] and [44].
that were later expanded by a region growing process. Miri and Mahloojifar [23] used a method based on a curvelet transform in order to enhance the retinal image and prepare it for blood vessel segmentation. They performed edge detection by using multistruc-ture elements morphology, and removed false blood vessel edges by using morphological operators by reconstruction, connected component analysis and length filtering. Salazar-Gonzalez et al. [34] used a graph cut technique to segment the retinal blood vessels. Akram and Khan [1] proposed a retinal blood vessel segmentation method that involved 2-D Gabor wavelet and multilayered thresholding technique. Martinez-Perezet al.[20] proposed a method for segmentation of retinal blood vessels in both red-free and fluo-rescein images. It was based on multiscale analysis and able to detect blood vessels with different properites (e.g. width or length). Panchalet al.[29] presented an algorithm for retinal feature extraction and some of the methods that they used were edge detection, thinning operation, and scanning window (of size 3x3 pixels) analysis that searched for ridges and bifurcations. Hatanakaet al.[12] proposed a blood vessel detection method that used a square double ring filter. The width of the inner square was set to 3 pixels, while the width of the outer square was set to 39 pixels. The output image obtained when this filter was applied to the retinal fundus image represented the differences in average pixel values in the square and the rim regions. Hatanakaet al.[12] also presented a method for the detection of blood vessels crossing sections that used a ring filter the radius of which was experimentally set to 40 pixels. The edge detection method that we used in this paper is somewhat similar to the blood vessel detection method presented in [12].
Algorithms for the automatic segmentation of retinal blood vessels are commonly evaluated on DRIVE (Digital Retinal Images for Vessel Extraction) [25] [41] and STARE (STructured Analysis of the Retina) [14] [15] image datasets. DRIVE dataset consists of 40 retinal fundus images that are divided into training and testing sets, each of which contains 20 images. The images in the testing set have two ground truth segmentations of blood vessels each. The first of these two segmentations is commonly used as a gold standard. STARE dataset [16] contains 20 images that have two ground truth segmenta-tions of blood vessels each. The first ground truth segmentasegmenta-tions are provided by Adam Hoover [16] and are commonly used as a gold standard. In this paper we evaluated the proposed method on DRIVE and STARE datasets, as they are most commonly used in the evaluation of retinal blood vessel segmentation methods.
Additional information on the various blood vessel segmentation methods and tech-niques in digital retinal images acquired from fundus cameras can be found in [9].
3.
Proposed method
The proposed method for retinal blood vessel segmentation encompasses iterative edge detection and shape analysis procedures. An iterative approach in this case assumes the modification of heuristically determined parameters used for edge detection and/or shape analysis at each iteration of the algorithm, thus allowing these methods to detect retinal blood vessels in different lighting conditions. 20 images from the training set of images from the DRIVE dataset were used in the heuristic determination of all of the parameters for edge detection and shape analysis procedures that we used in our method.
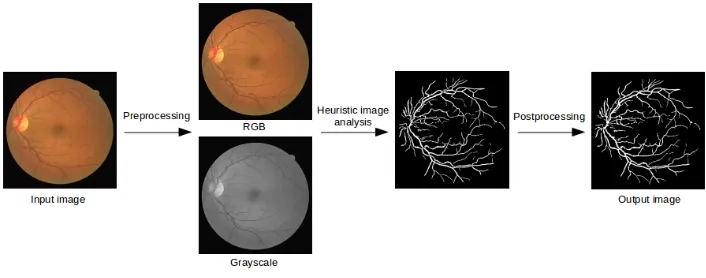
preprocess-ing step, heuristic image analysis step, and postprocesspreprocess-ing step. Preprocesspreprocess-ing step in-cludes image sharpening and smoothing. Heuristic image analysis step is the main part of the proposed method and it includes the derivation of heuristic rules that we used in the proposed method. Postprocessing step encompasses morphological closing operation. Proposed method is schematically shown in Figure 2. Thresholds shown in Figure 2 are explained in detail in section 3.2.
Fig. 1.Overview of the proposed method. The input image was taken from the DRIVE dataset
3.1. Preprocessing
Color fundus images often have low contrast between blood vessels and image back-ground, so some image enhancement technique is usually necessary to improve later seg-mentation results. For this purpose we employ a 3x3 sharpening filter to the original input image, and a 3x3 Gaussian smoothing filter to the obtained resultant image. Gaussian smoothing filter is used to lower the effects of noise in the subsequent fundus image anal-ysis.
The proposed method uses RGB values of image pixels in the process of extraction of the circular retinal fundus image area from the darker background, but uses grayscale images for every other step of the algorithm.
3.2. Heuristic image analysis
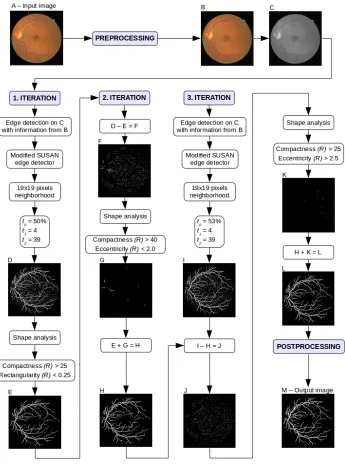
Heuristic image analysis is the main part of the proposed method for retinal blood vessel segmentation. As shown in Figure 2, it consists of 3 iterations that are detailed in the text below.
1. iteration
Fig. 2.Proposed method. The input image was taken from the DRIVE dataset
on the image can be detected. Since blood vessels in retinal images appear darker than the background [6], an edge detector like the SUSAN edge detector can provide good edge detection results. Instead of using original SUSAN edge detector, in this paper we used a modified version. This modified version uses larger size of the local pixel neighbour-hood than it is usually used in the original SUSAN edge detector, and rectangular pixel neighbourhood instead of a circular one.
The edge detection method that we used in the segmentation of retinal blood vessels can be summarized as follows. For each pixel of the grayscale retinal image we examine a rectangular local neighbourhood and compare the grayscale intensity of each pixel in the neighbourhood to the one in its center. If the intensity of the central pixel is lower than the intensities (temporarily increased by a small threshold t1 = 4) of more than
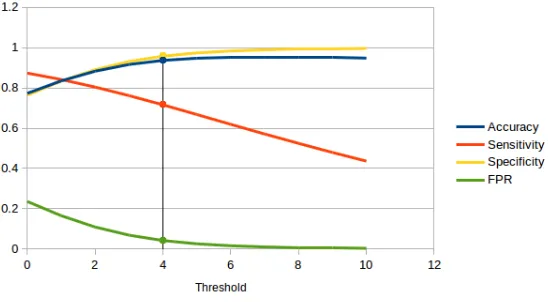
t0 = 50%of neighbouring pixels, and if its intensities in the RGB color space are all above a certain thresholdt2= 39, then we assume that the center pixel potentially belongs to a blood vessel. Thresholdt0was chosen with the purpose of locating pixels that are likely to belong to either the edges of blood vessels or to their inner pixels. It allows us to dismiss pixels that are part of a bright uniform area that does not have any sort of edge in its vicinity and therefore probably does not belong to a blood vessel at all. Thresholdt1is used to lower the effects of noise on the final blood vessel segmentation and was chosen on the basis of a graph shown in Figure 3. This graph shows how the accuracy, sensitivity, specificity and false positive rate (FPR) change for this step of the proposed method when the thresholdt1changes. The final value oft1 = 4was selected as a trade-off between the accuracy, sensitivity and specificity (which we tried to keep high), andFPR(which we tried to keep low) of the edge detection method that we used. Even though the accuracy was higher when the thresholdt1assumed values higher than4, the negative impact that this increase would have on the sensitivity of the edge detection method that we used would be greater that the positive impact this increase would have on the accuracy, specificity orFPR, i.e. sensitivity would decrease more than the accuracy or specificity would increase orFPRdecrease, as can be seen from Figure 3.
Thresholdt2is used to ignore the dark pixels that are outside of the circular fundus image area and was estimated heuristically. Other methods for blood vessel segmentation (e.g. [23]) often use Otsu’s method [28] for this purpose, but since thresholding the chan-nels of an RGB image with thresholdt2usually accomplishes the separation of a circular fundus image from the darker background very well, we used that instead as it was simple to implement.
The size of the local pixel neighbourhood used in the edge detection part of the retinal blood vessel segmentation in this paper was determined heuristically and fixed at 19x19 pixels. If this size was smaller, the algorithm would have had problems with the detection of inner blood vessel pixels because the local neighbourhood around one of those pixels would be too uniform to be picked up by the modified SUSAN edge detector. If this size was larger, it would introduce too much noise, especially in the macula region of the retina. To illustrate our point, Figure 4 shows examples of blood vessel segmentation using modified SUSAN edge detector for local neighbourhoods of different sizes. Local neighbourhood size of 19x19 pixels was chosen as a trade-off between the amount of noise and the amount of accurately segmented blood vessel pixels.
Fig. 4.Examples of edge detection for local neighbourhoods of different sizes. (a) Image from the DRIVE dataset, (b) edge detection for 9x9 neighbourhood, (c) edge detection for 19x19 neighbour-hood, (d) edge detection for 35x35 neighbourhood
In order to remove the noise from the image obtained after edge detection, we first ex-tract the connected components that represent possible blood vessel pixels (regions) from the image, and then perform shape analysis of each of those regions. For each of those regions we calculate 4 shape descriptors: their area, perimeter, compactness and rectan-gularity. The area is defined as the total number of pixels in the region. The perimeter is defined as the number of pixels on the border of a region, and in the process of its calcu-lation we used 8-connectivity. 8-connectivity is commonly used in image processing and more information about it can be found in [31]. Compactness is defined as the ratio of the squared perimeter of the region and the region’s area [17]. Rectangularity is defined as the ratio of the region’s area and the area of the minimum bounding rectangle of that region [32].
compactness(R)> CC1 (1)
rectangularity(R)< CR1 (2)
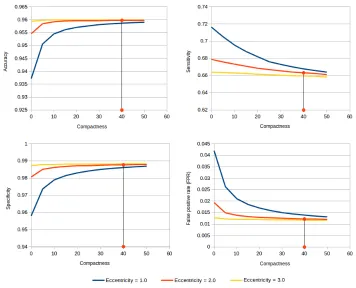
The parametersCC1andCR1were set to 25 and 0.25, respectively, and were chosen
on the basis of graphs shown in Figure 5. These graphs show how the accuracy, sensitivity, specificity andFPRchange for different values of parametersCC1andCR1after the first
iteration of the proposed method. It can be seen from Figure 5 that the two best options for threshold CR1 are 0.2 and0.25, as the accuracies associated with them are two of
the highest ones in the graph (the accuracy associated withCR1 = 0.2is0.959701, and
the accuracy associated withCR1 = 0.25is0.959691). Additionally, specificity andFPR
are similar for these two options - specificity is a little bit higher forCR1 = 0.2than it
is forCR1 = 0.25, andFPRis a little bit lower, but these are small differences, as can
be seen from Figure 5. However, sensitivity forCR1 = 0.25is significantly higher than
the one forCR1 = 0.2, and this was the reason why we usedCR1 = 0.25instead of CR1 = 0.2in the first iteration of the proposed method. When it comes to parameterCC1,
we decided to useCC1 = 25because that was the point in the graphs in Figure 5 where
the sensitivity was kept relatively high,FPRwas slightly decreasing and specificity was slightly increasing. It can be seen from Figure 5 thatCC1 = 20was also a good option,
but we chose not to use it as it had slightly higher FPR and slightly lower specificity in comparison toCC1 = 25, and it also decreased the accuracy of the overall proposed
method.
2. iteration
Even though the majority of blood vessel regions satisfied the constraints 1 and 2, some of them did not. Thinner blood vessels and blood vessels the color of which is very similar to the color of the background might not satisfy these constraints, as illustrated in Figure 6. Figure 6 shows the results of edge detection for local neighbourhood of 19x19 pixels, and it also shows the regions that satisfy and do not satisfy constraints 1 and 2. It can be seen that the regions labeled as noise contain a small number of blood vessels that the edge detection method failed to extract in their entirety. These blood vessels are mostly represented only by their unconnected fragments, and each of those fragments is treated as a different region. Since the observed areas are very small, they do not demonstrate the same characteristics in terms of compactness and rectangularity as blood vessels that were not fragmented as much.
Since some of the blood vessel regions were segmented as noise because of their frag-mentation, we performed additional shape analysis on all of the regions that were detected as possible blood vessel regions by an edge detection algorithm, but dismissed after the initial shape analysis procedure. In this additional shape analysis we used compactness and eccentricity (the ratio of the length and width of a minimal bounding rectangle of a region, where length is the longer side of the rectangle [10]) as shape descriptors in a way shown in constraints 3 and 4. Image regions that satisfy the constraints 3 and 4, alongside the output of the first iteration of the proposed method, represent the output of the second iteration of the proposed method.
Fig. 5.Graphs used in the process of determination of parametersCC1andCR1
Fig. 6.(a) Image from the DRIVE dataset, (b) edge detection for 19x19 local neighbourhood, (c) regions labeled as blood vessels after shape analysis, (d) regions labeled as noise after shape analysis
eccentricity(R)>=CE1 (4)
The parametersCC2andCE1were set to 40 and 2.0, respectively, and were chosen on
specificity and FPR change for different values of parametersCC2 andCE1 after the
second iteration of the proposed method. It can be seen from Figure 7 that the two best options for parameterCE1are2.0and3.0, because the accuracy and specificity associated
with them are high, andFPRis low. Since the sensitivity is visibly higher forCE1 = 2.0
than forCE1 = 3.0, we chose2.0as the value for parameterCE1. Furthermore, we used
40as the value for parameterCC2because the accuracy associated with it was one of the
highest in the first graph shown in Figure 7. The accuracy and specificity associated with
CC2 = 45andCC2 = 50were slightly higher than the one associated withCC2 = 40, and
theirFPRwas also slightly lower, butCC2 = 45andCC2 = 50had lower sensitivity in
comparison toCC2 = 40. We decided to useCC2 = 40instead ofCC2= 45orCC2 = 50
because, out of all the tests we performed, the use of this value gave the highest accuracy results for the overall proposed method. We should mention that the Sinthanayothinet al.
[36] used a rule similar to constraint 3 in their blood vessel segmentation procedure. In the post-processing stages of their blood vessel detection method, one of the rules that they used was that the compactness of an isolated region should be above 39 in order to possibly belong to a blood vessel.
3. iteration
In order to locate possible blood vessel pixels that were left undetected by the previous two iterations, we perform two additional steps. In the first step we perform edge detection on the original fundus image with parameterst0= 53%andt1= 4, and neighbourhood size of 19x19 pixels. The reason why we set thresholdt0to53%instead of50%as we used previously is because we wanted to make edge detection a little bit stricter in this iteration of the proposed method because most of the blood vessels pixels that exist in the input fundus image have been found until now. This stricter rule (which we derived heuristically) for edge detection allowed us to work with fewer pixels in this iteration of the proposed method, and therefore speed it up. The resultant image we obtain after the edge detection process is a binary image where white pixels correspond to detected edges, and black pixels to the background. Any white pixel in this image that was segmented as a blood vessel pixel in the first two iterations of the proposed method is transformed into a black pixel to eliminate it from further analysis. In the second step we perform shape analysis of the connected components of this new image, and only treat regions that satisfy constraints 5 and 6 as possible blood vessels. These regions, alongside the blood vessel pixels detected in the first two iterations of the proposed method, represent the output of the third iteration of the proposed method.
compactness(R)> CC3 (5)
eccentricity(R)> CE2 (6)
The parametersCC3 andCE2 were set to 20 and 2.5, respectively, were chosen on
the basis of graphs shown in Figure 8. These graphs show how the accuracy, sensitivity, specificity andFPRchange for different values of parametersCC3andCE2after the third
iteration of the proposed method. It can be seen from Figure 8 that the two best options for parameterCE2 are2.5and3.0, because the accuracies associated with them are the
highest. We decided to use CE2 = 2.5 instead of CE2 = 3.0 because the sensitivity
associated withCE2 = 2.5was mostly higher than the one associated withCE2 = 3.0.
When it comes to parameterCC3, the value we decided to use for it was20because we
found that to be a good trade-off between high accuracy, sensitivity and specificity, and lowFPR.
3.3. Postprocessing
Morphological closing operation (dilation followed by erosion) [30] [33] is applied to the image obtained by heuristic image analysis. The purpose of this postprocessing step is to fill in any small openings that the image might contain. The resultant image represents the final retinal blood vessel segmentation, i.e. the output image of the proposed method.
Fig. 8.The process of determination of parametersCC3andCE2
4.
Results and discussion
The proposed blood vessel segmentation method was implemented in C++. For various image processing related functions we used the OpenCV library [26]. In the evaluation of the proposed method we used commonly employed statistical measures: sensitivity (true positive rate,TPR), specificity (true negative rate,TNR), false positive rate (FPR), and accuracy. These measures are defined in terms of true positives (TP), true negatives (TN), false positives (FP) and false negatives (FN). In our case,TPrepresents pixels accurately identified as belonging to the blood vessles,TN representes pixels accurately identified as belonging to the image background, FP represents pixels inaccurately identified as belonging to the blood vessles, andFNrepresentes pixels inaccurately identified as be-longing to the image background. Sensitivity, specificity, accuracy andFPRare defined by equations 7, 8, 9 and 10.
Sensitivity= T P
T P +F N (7)
Specif icity= T N
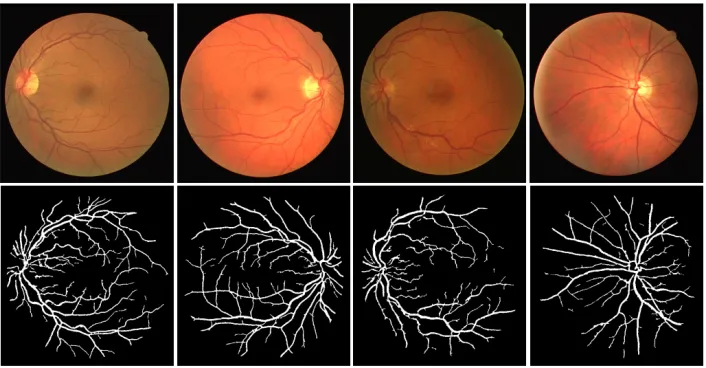
Fig. 9.Retinal blood vessel segmentation using the proposed method. First row shows images from the DRIVE dataset, while the second row shows corresponding segmentations obtained by the pro-posed method
Accuracy= T P +T N
T P +F P +T N+F N (9)
F P R= F P
F P +T N (10)
The proposed method was evaluated on DRIVE and STARE image datasets. For the evaluation of our method we used 20 images from the testing set of images from the DRIVE dataset, and for their ground truth segmentations of blood vessels we used the segmentations provided by the first observer as that is the usual practice amongst re-searchers. When it comes to the STARE image dataset, 20 images were accompanied by ground truth segmentations of blood vessels so we used them in the evaluation of our method. For their ground truth segmentations of blood vessels we used the segmentations provided by the first observer as that is the usual practice amongst researchers.
The values forTP,TN,FPandFNthat we obtained for the DRIVE database were the following: 405834, 5950875, 70380 and 172111, respectively. The values forTP,TN,FP
andFNthat we obtained for the STARE database were the following: 447894, 7692080, 133867 and 196159, respectively. We used these values in the calculation of sensitivity, specificity, FPR and accuracy of the proposed method for blood vessel segmentation. Sen-sitivity, specificity, FPR and accuracy of the proposed method was rounded to 4 decimals, as can be seen from Tables 1 and 2.
cited in Tables 1 and 2. The results we obtained for the proposed method are shown in Tables 1 and 2 in terms of average sensitivity, specificity,FPRand accuracy.
Method Sensitivity
(TPR)
Specificity
(TNR) FPR Accuracy
Mendonc˛a and Campilho [22]
(Input: gray-intensity images) 0.7315 / 0.0219 0.9463
Mendonc˛a and Campilho [22]
(Input: green channel images) 0.7344 / 0.0236 0.9452
Kande et al. [18] / / / 0.8911
Xu and Luo [42] 0.7760 / / 0.9328
Zhang et al. [44] 0.7120 / 0.0276 0.9382 Marín et al. [19] 0.7067 0.9801 / 0.9452
Miri and Mahloojifar [23] 0.7352 / 0.0205 0.9458
Yin et al. [43] 0.6522 0.9710 / 0.9267 Salazar-Gonzalez et al. [34] 0.7512 / 0.0316 0.9412
Melinscak et al. [21] 0.7276 / 0.0215 0.9466
Sreejini and Govindan [40] 0.7132 0.9866 / 0.9633 Zhao et al. [45] 0.742 0.982 / 0.954
Proposed method 0.7022 0.9883 0.0117 0.9633
Table 1.Performance evaluation of different retinal blood vessel segmentation methods on the DRIVE dataset
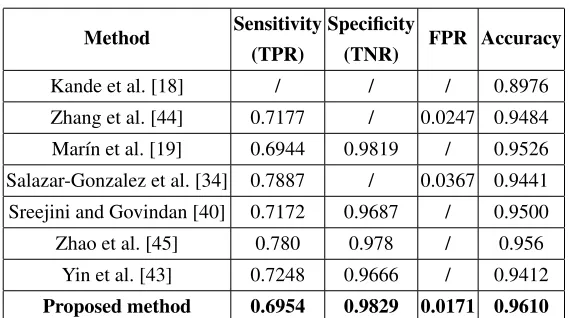
It can be seen from Table 1 that the proposed method has higher accuracy on the DRIVE dataset than any of the listed methods except for the one proposed in [40], the accuracy of which is the same as ours. On the other hand, it can be seen from Table 2 that our method has higher accuracy on the STARE dataset than any other listed method, and that includes the one presented in [40]. The results that we obtained on the STARE dataset are even more significant given the fact that we did not train our method on that dataset, but rather only on the training part of the DRIVE dataset.
Method Sensitivity (TPR)
Specificity
(TNR) FPR Accuracy
Kande et al. [18] / / / 0.8976
Zhang et al. [44] 0.7177 / 0.0247 0.9484
Marín et al. [19] 0.6944 0.9819 / 0.9526 Salazar-Gonzalez et al. [34] 0.7887 / 0.0367 0.9441
Sreejini and Govindan [40] 0.7172 0.9687 / 0.9500
Zhao et al. [45] 0.780 0.978 / 0.956 Yin et al. [43] 0.7248 0.9666 / 0.9412
Proposed method 0.6954 0.9829 0.0171 0.9610
Table 2.Performance evaluation of different retinal blood vessel segmentation methods on the STARE dataset
blood vessels it would locate would have a higher probability of actually belonging to the blood vessels and not the image background or other retinal features or signs of various retinal diseases. Furthermore, Tables 1 and 2 also contain information about theFPR. It can be seen from Tables 1 and 2 that theFPRof our method is the lowest out of all the other compared methods listed in Tables 1 and 2 whoseFPRis known, which means that the number of pixels that the proposed method inaccurately identified as belonging to retinal blood vessels (i.e.FP) is lower than in those other methods.
It can be seen from the text above that we decided to put higher emphasis on the specificity rather than on sensitivity of the proposed method. This decision was made in the wake of our future research where we plan to use the proposed method in the seg-mentation and classification of retinal diseases. In that research we will use the proposed method to remove pixels belonging to retinal blood vessels from the retinal fundus im-ages in order to have a more reliable retinal disease segmentation and classification later on. If the sensitivity of the proposed method was higher, its specificity would decrease and this would cause problems because the proposed method would probably detect some signs of the disease as retinal blood vessels, which would exclude these pixels from the automated retinal disease segmentation and classification. This would, of course, perhaps cause the automated method to miss out on signs of a disease, which in our opinion is a larger problem than having false signs of a disease that can easily be disregarded by an experienced ophthalmologist once the automated system for retinal disease classification and segmentation raises an alarm.
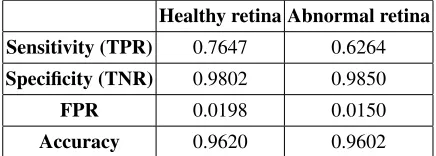
lower on the images that showed retinas with signs of the disease, but this was expected given that a large number of retinal diseases can appear similar in color to retinal blood vessels. The proposed method is designed in such a way that it rathers fails to detect a pixel belonging to a retinal blood vessel than incorrectly detecting other pixels (usually connected to retinal abnormalities) as retinal blood vessels. As discussed previously, this decision was made in the wake of our future research where we plan to use the proposed method in the segmentation and classification of retinal diseases.
Healthy retina Abnormal retina
Sensitivity (TPR) 0.7647 0.6264
Specificity (TNR) 0.9802 0.9850
FPR 0.0198 0.0150
Accuracy 0.9620 0.9602
Table 3.Performance evaluation of the proposed method on the healthy and abnormal retinal images from the STARE dataset
Based on the results shown in Tables 1 and 2 and the discussion regarding them, we can conclude that the proposed method has the overall highest accuracy and specificity, and the lowestFPR, which would make it effective to use in retinal blood vessel segmen-tation. However, the reader should keep in mind that the proposed method was tested on low-resolution images from the DRIVE and STARE datasets. If it is to be used on high-resolution retinal fundus image datasets the heuristically determined parameters should probably be adjusted accordingly.
5.
Conclusion
In this paper we presented a novel method for iterative retinal blood vessel segmenta-tion based on heuristic image analysis. The presented analysis included the derivasegmenta-tion of heuristic rules and thresholds that we used in edge detection and shape analysis of retinal fundus images with the ultimate aim of achieving automatic and high accuracy retinal ves-sel segmentation. The proposed method can be used in biometrics or in computer-aided diagnosis in the medical field of ophthalmology. It was evaluated on the publicly avail-able DRIVE and STARE datasets on which it achieved the average accuracy of 96.33% and 96.10%, respectively. It achieved the overall highest accuracy and specificity and the lowest false positive rate out of all the methods it was compared against, and the obtained results indicate that it is effective in retinal blood vessel segmentation. In our future work we intend to expand the research proposed in this paper to the automatic detection of retinal abnormalities such as diabetic retinopathy, age-related macular degeneration and glaucoma.
- Centre of Research Excellence for Advanced Cooperative Systems (http://across.fer.hr). The au-thors would like to thank Dr. Ljubo Znaor from the Clinical Hospital Center in Split for all the help he provided during their research on this project. The authors would also like to thank Dr. Stephen M. Smith from the University of Oxford for letting them know that the SUSAN edge detector was always free to use for non-commercial purposes.
References
1. Akram, M.U., Khan, S.A.: Multilayered thresholding-based blood vessel segmentation for screening of diabetic retinopathy. Engineering with Computers 29(2), 165–173 (2013) 2. Al-Rawi, M., Qutaishat, M., Arrar, M.: An improved matched filter for blood vessel detection
of digital retinal images. Computers in Biology and Medicine 37(2), 262–267 (2007)
3. Arenas-Cavalli, J.T., Rios, S.A., Pola, M., Donoso, R.: A web-based platform for automated diabetic retinopathy screening. 19th International Conference on Knowledge Based and Intel-ligent Information and Engineering Systems. Procedia Computer Science 60, 557–563 (2015) 4. Barkhoda, W., Akhlaqian, F., Amiri, M.D., Nouroozzadeh, M.S.: Retina identification based
on the pattern of blood vessels uzing fuzzy logic. EURASIP Journal on Advances in Signal Processing 113 (2011)
5. Chakraborti, T., Jha, D.K., Chowdhury, A.S., Jiang, X.: A self-adaptive matched filter for retinal blood vessel detection. Machine Vision and Applications 26(1), 55–68 (2015)
6. Chaudhuri, S., Chatterjee, S., Katz, N., Nelson, M., Goldbaum, M.: Detection of blood ves-sels in retinal images using two-dimensional matched filters. IEEE Transactions on Medical Imaging 8(3), 263–269 (1989)
7. Datta, N.S., Dutta, H.S., De, M., Mondal, S.: An effective approach: image quality enhance-ment for microaneurysms detection of non-dilated retinal fundus image. International Confer-ence on Computational IntelligConfer-ence: Modeling Techniques and Applications (CIMTA). Proce-dia Technology 10, 731–737 (2013)
8. Fatima, J., Syed, A.M., Akram, M.U.: Feature point validation for improved retina recognition. IEEE Workshop on Biometric Measurements and Systems for Security and Medical Applica-tions (BIOMS) (2013)
9. Fraz, M., Remagnino, P., Hoppe, A., Uyyanonvara, B., Rudnicka, A., Owen, C., Barman, S.: Blood vessel segmentation methodologies in retinal images - a sur-vey. Computer Methods and Programs in Biomedicine 108(1), 407–433 (Oct 2012), http://dx.doi.org/10.1016/j.cmpb.2012.03.009
10. Frejlichowski, D., Go´sciewska, K.: The application of simple shape measures based on a min-imum bounding rectangle to the general shape analysis problem. Journal of Theoretical and Applied Computer Science 7(4), 35–41 (2013)
11. Fukuta, K., Nakagawa, T., Hayashi, Y., Hatanaka, Y., Hara, T., Fujita, H.: Personal identi-fication based on blood vessels of retinal fundus images. In: Medical Imaging 2008: Image Processing, Proceedings of SPIE. vol. 6914 (2008)
12. Hatanaka, Y., Muramatsu, C., Hara, T., Fujita, H.: Automatic arteriovenous crossing phe-nomenon detection on retinal fundus images. In: Proceedings of SPIE, Vol. 7963, 79633V, Medical Imaging 2011: Computer-Aided Diagnosis. vol. 7963 (2011)
13. Hoover, A.: STructured Analysis of the Retina, [Online]. Available: http://cecas.clemson.edu/ ahoover/stare/diagnoses/all-mg-codes.txt (current May 2018) 14. Hoover, A., Goldbaum, M.: Locating the optic nerve in a retinal image using the fuzzy
conver-gence of the blood vessels. IEEE Transactions on Medical Imaging 22(8), 951–958 (2003) 15. Hoover, A., Kouznetsova, V., Goldbaum, M.: Locating blood vessels in retinal images by
16. Hoover, A., Kouznetsova, V., Goldbaum, M.: STARE image dataset (2000), [Online]. Avail-able: http://cecas.clemson.edu/ ahoover/stare/probing/index.html (current March 2017) 17. Iivarinen, J., Peura, M., Särelä, J., Visa, A.: Comparison of combined shape descriptors for
irregular objects. In: Proceedings of the 8th British Machine Vision Conference. pp. 430–439 (1997)
18. Kande, G.B., Subbaiah, P.V., Savithri, T.S.: Unsupervised fuzzy based vessel segmentation in pathological digital fundus images. Journal of Medical Systems 34(5), 849–858 (2010) 19. Marín, D., Aquino, A., Gegúndez-Arias, M.E., Bravo, M.: A new supervised method for blood
vessel segmentation in retinal images by using gray-level and moment invariants-based fea-tures. IEEE Transactions on Medical Imaging 30(1) (2011)
20. Martinez-Perez, M.E., Hughes, A.D., Thom, S.A., Bharath, A.A., Parker, K.H.: Segmentation of blood vessels from red-free and fluorescein retinal images. Medical Image Analysis 11(1), 47–61 (2007)
21. Melinscak, M., Prentasic, P., Loncaric, S.: Retinal vessel segmentation using deep neural net-works. In: Proceedings of the 10th International Conference on Computer Vision Theory and Applications. pp. 577–582. Berlin, Germany (2015)
22. Mendonc˛a, A.M., Campilho, A.C.: Segmentation of retinal blood vessels by combining the de-tection of centerlines and morphological reconstruction. IEEE Transactions on Medical Imag-ing 25(9) (2006)
23. Miri, M.S., Mahloojifar, A.: Retinal image analysis using curvelet transform and multistructure elements morphology by reconstruction. IEEE Transactions on Biomedical Engineering 58(5) (2011)
24. Nguyen, U.T.V., Bhuiyan, A., Park, L.A.F., Ramamohanarao, K.: An effective retinal blood vessel segmentation method using multi-scale line detection. Pattern Recognition 46(3), 703– 715 (2013)
25. Niemeijer, M., Staal, J., van Ginneken, B., Loog, M., Abràmoff, M.D.: Comparative study of retinal vessel segmentation methods on a new publicly available database. In: Proceedings of SPIE - The International Society for Optic Engineering 5370 (2004)
26. OpenCV team: OpenCV (Open Source Computer Vision), [Online]. Available: http://opencv.org/ (current January 2017)
27. Organization, W.H.: Prevention of blindness and visual impairment, causes of blindness and visual impairment, [Online]. Available: http://www.who.int/blindness/causes/en/ (current De-cember 2016)
28. Otsu, N.: A threshold selection method from gray-level histograms. IEEE Transactions on Sys-tems, Man, and Cybernetics SMC-9(1) (1979)
29. Panchal, P., Bhojani, R., Panchal, T.: An algorithm for retinal feature extraction using hybrid ap-proach. 7th International Conference on Communication, Computing and Virtualization 2016, Procedia Computer Science 79, 61–68 (2016)
30. Petrou, M., Sevilla, P.G.: Image Processing - Dealing with Texture. John Wiley & Sons, Ltd (2006)
31. Rosenfeld, A.: Connectivity in digital pictures. Journal of the Association for Computing Ma-chinery 17(1), 146–160 (1970)
32. Rosin, P.L.: Measuring shape: ellipticity, rectangularity, and triangularity. Machine Vision and Applications 14(3), 172–184 (2003)
33. Russ, J.C.: The Image Processing Handbook, Second Edition. CRC Press, Inc. (1995) 34. Salazar-Gonzalez, A., Kaba, D., Li, Y., Liu, X.: Segmentation of the blood vessels and optic
disk in retinal images. IEEE Journal of Biomedical and Health Informatics 18(6), 1874–1886 (2014)
36. Sinthanayothin, C., Boyce, J.F., Cook, H.L., Williamson, T.H.: Automated localisation of the optic disc, fovea, and retinal blood vessels from digital colour fundus images. The British Journal of Ophthalmology 83(8), 902–910 (1999)
37. Smith, S.M., Brady, J.M.: SUSAN - A new approach to low level image processing. Technical report TR95SMS1c, Defence Research Agency, Farnborough, Hampshire, UK (1995) 38. Smith, S.M., Brady, J.M.: SUSAN - A new approach to low level image processing.
Interna-tional Journal of Computer Vision 23(1), 45–78 (1997)
39. Soares, J.V.B., Leandro, J.J.G., Cesar-Jr., R.M., Jelinek, H.F., Cree, M.J.: Retinal vessel seg-mentation using the 2-D Morlet wavelet and supervised classification. IEEE Transactions on Medical Imaging 25(9), 1214–1222 (2006)
40. Sreejini, K.S., Govindan, V.K.: Improved multiscale matched filter for retina vessel segmenta-tion using PSO algorithm. Egyptian Informatics Journal 16(3), 253–260 (2015)
41. Staal, J., Abràmoff, M.D., Niemeijer, M., Viergever, M.A., van Ginneken, B.: Ridge-based ves-sel segmentation in color images of the retina. IEEE Transactions on Medical Imaging 23(4), 501–509 (2004)
42. Xu, L., Luo, S.: A novel method for blood vessel detection from retinal images. BioMedical Engineering OnLine 9(14) (2010)
43. Yin, Y., Adel, M., Bourennane, S.: Automatic segmentation and measurement of vasculature in retinal fundus images using probabilistic formulation. Hindawi Publishing Corporation, Com-putational and Mathematical Methods in Medicine, Article ID 260410 2013 (2013)
44. Zhang, B., Zhang, L., Zhang, L., Karray, F.: Retinal vessel extraction by matched filter with first-order derivative of Gaussian. Computers in Biology and Medicine 40(4), 438–45 (2010) 45. Zhao, Y., Rada, L., Chen, K., Harding, S.P., Zheng, Y.: Automated vessel segmentation
us-ing infinite perimeter active contour model with hybrid region information with application to retinal images. IEEE Transactions on Medical Imaging 34(9), 1797–1807 (2015)
Maja Braovi´cis a post-doctoral researcher at the Faculty of Electrical Engineering, Me-chanical Engineering and Naval Architecture at the University of Split, Croatia. She ob-tained her PhD in Articifial Intelligence in 2015. Her research interests include image processing, medical and forensic image analysis, machine learning, expert systems, cryp-tography and artificial intelligence in general.
Darko Stipaniˇcevis a full professor at the Faculty of Electrical Engineering, Mechanical Engineering and Naval Architecture at the University of Split, Croatia. He obtained his PhD in Electrical Engineering in 1987. His research interests include image processing, video surveillance and monitoring, robotics, fuzzy systems, and artificial intelligence in general.
Ljiljana Šeri´cis an assistant professor at the Faculty of Electrical Engineering, Mechan-ical Engineering and Naval Architecture at the University of Split, Croatia. She obtained her PhD in Artificial Intelligence in 2010. Her research interests include image process-ing, video surveillance and monitorprocess-ing, sensor networks, distributed information systems and artificial intelligence in general.