Volume 18 Number 1 pp. 61–72 C The Author(s) 2014 doi:10.1017/thg.2014.74
A Twin Study of Breastfeeding With a Preliminary
Genome-Wide Association Scan
Lucia Colodro-Conde,1,2Gu Zhu,1Robert A. Power,3Anjali Henders,1Andrew C. Heath,4
Pamela A. F. Madden,4Grant W. Montgomery,1Sarah Medland,1Juan R. Ordo ˜nana,2and
Nicholas G. Martin1
1QIMR Berghofer Medical Research Institute, Brisbane, Queensland, Australia
2Murcia Twin Registry, Department of Human Anatomy and Psychobiology, University of Murcia, IMIB-Arrixaca, Murcia,
Spain
3MRC Social Genetic & Developmental Psychiatry Centre, Institute of Psychiatry, King’s College London, DeCrespigny
Park, Denmark Hill, London, UK
4School of Psychiatry, Washington University School of Medicine, St. Louis, MO, USA
Breastfeeding has been an important survival trait during human history, though it has long been recog-nized that individuals differ in their exact breastfeeding behavior. Here our aims were, first, to explore to what extent genetic and environmental influences contributed to the individual differences in breastfeed-ing behavior; second, to detect possible genetic variants related to breastfeedbreastfeed-ing; and lastly, to test if the genetic variants associated with breastfeeding have been previously found to be related with breast size. Data were collected from a large community-based cohort of Australian twins, with 3,364 women participating in the twin modelling analyses and 1,521 of them included in the genome-wide associa-tion study (GWAS). Monozygotic (MZ) twin correlaassocia-tions (rMZ=0.52, 95% CI 0.46–0.57) were larger than dizygotic (DZ) twin correlations (rDZ =0.35, 95% CI 0.25–0.43) and the best-fitting model was the one composed by additive genetics and unique environmental factors, explaining 53% and 47% of the variance in breastfeeding behavior, respectively. No breastfeeding-related genetic variants reached genome-wide significance. The polygenic risk score analyses showed no significant results, suggesting breast size does not influence breastfeeding. This study confers a replication of a previous one exploring the sources of variance of breastfeeding and, to our knowledge, is the first one to conduct a GWAS on breastfeeding and look at the overlap with variants for breast size.
Keywords:breastfeeding, twin study, genome-wide association study
Breast milk, either from an infant’s own mother or from an-other woman, can be assumed to have been the sole source of nourishment for infants during most of human evolu-tion, having evolved as an adaptation to transfer immune
factors to offspring and to space births (Sellen, 2007). It
has been suggested that breastfeeding duration in prehis-toric times was of two–three years and that from the Middle Ages to the 19th century, most infants in Europe were typi-cally weaned between the ages of one and two years (Sch¨on & Silv´en,2007). It was not until the end of the 19th cen-tury, that is, in our recent history, that artificial feeding became a safe alternative to breast milk, and breastfeeding became dependent on the mother’s choice in most milieus. Consequently, nowadays a large variability in this behavior can be observed both within and between countries, with
global statistics showing that 37% of infants were exclusively breastfed until six months age in 2007 (World Health
Or-ganization,2013), which is the current recommended
min-imum weaning age (World Health Organization & United
Nations Children’s Fund,2003). This percentage varied
con-siderably across countries; for example, 18.8% in the United States in 2011 (Centers for Disease Control and Prevention,
2014), 17.6% in Australia in 2011–2012 (Australian Bureau
RECEIVED14 July 2014;ACCEPTED29 September 2014. First pub-lished online 5 December 2014.
of Statistics,2013) and 28.5% in Spain in 2011–2012 (Min-isterio de Sanidad, Servicios Sociales e Igualdad,2012). The instruments for data collection vary between countries, for example, in being explicit about the inclusion of expressed milk in exclusive breastfeeding, so some rates could be higher.
Given the positive impact of breastfeeding on infants’
and mothers’ health (Ip et al.,2009; World Health
Organi-zation & United Nations Children’s Fund,2003), there is a current interest in determining which factors are related to women’s decisions regarding the method of feeding their infants, that is, the predispositions or situations that make them more likely to initiate breastfeeding or bottle feeding, and the duration of breastfeeding. Breastfeeding is a
biocul-tural behavior (Holman & Grimes,2003) and is influenced
by multiple factors (Thulier & Mercer,2009), such as the
action of prolactin and oxytocin (Heinig & Dewey,1997),
pain from nipple trauma, mastitis, maternal exhaustion and
perceived poor milk supply (Almqvist-Tangen et al.,2012;
Spencer,2008), babies’ sucking dynamics (Sakalidis et al.,
2013), body mass index (Wojcicki,2011), level of
educa-tion (Colodro-Conde et al.,2011), working conditions
(Cal-nen,2010), psychological factors, personality, self-efficacy,
anxiety (Brown,2014; Colodro-Conde et al., in press (a);
Colodro-Conde et al., in press (b); De Jager et al.,2012; Li et al.,2008; McFadden & Toole,2006; Wagner et al.,2006), support from partner, family and peers (Thulier & Mercer,
2009), social norms (Swanson & Power,2005), and advice
from health professionals (Brown et al.,2011).
The magnitude of the genetic and environmental sources of variance in breastfeeding behavior were explored in a pre-vious study in a cohort of Spanish twins from the Murcia Twin Registry (Ordo˜nana et al.,2006,2013). The best-fitting models explained the observed variance through additive genetic and non-shared environmental factors for initiation and duration in the first-born child and the average for the complete offspring, with heritability ranging between 44%
and 54% (Colodro-Conde et al.,2013). It was hypothesized
that among the genetic factors influencing breastfeeding be-havior, those related to the regulation of hormone produc-tion could play a part in breastfeeding outcomes. In support of this hypothesis, Jonas et al. (2013) found that the single nucleotide polymorphism (SNP) rs2740210 in the oxytocin peptide gene was associated with exclusive breastfeeding at three and six months postpartum. Other authors, however, did not find a relationship between selected oxytocin
re-ceptor SNPs and breastfeeding (Tharner et al.,2012). As
breastfeeding has been suggested to be significantly influ-enced by genetic factors, it would be interesting to explore the genetic variants underlying this trait.
Several studies have concluded that body mass index is associated with breastfeeding behavior, so mothers who are overweight or obese are less likely to initiate lactation, and are prone to early cessation of breastfeeding (Jevitt et al.,
2007; Wojcicki,2011). A study with health professionals
showed that from their experience, initiating was more dif-ficult than continuing breastfeeding for women with large
breasts and/or obesity (Katz et al.,2010). The link between
overweight, elevated serum testosterone concentration and pathologies such as the polycystic ovary syndrome could be underlying this relationship (Balen et al.,1995; Barber et al.,
2006). Heritability of breast cup size has been estimated to
be 56%, and one third of this variance was shared with
body mass index (Wade et al.,2010). Some genetic variants
associated with breast size also influence breast cancer risk (Eriksson et al.,2012).
This article has three main objectives. First, it aims to replicate previous findings related to heritability of breast-feeding by exploring the magnitude of the genetic and en-vironmental influences in the variation of breastfeeding be-havior in a sample of Australian twins. For that aim, we used a twin design, calculating twin correlations for breastfeed-ing and fittbreastfeed-ing an ACE variance components model. Second, in order to detect possible genetic variants related to breast-feeding behavior, we conducted a GWAS of this phenotype, using data collected from this large community-based co-hort of Australian twins. Lastly, we report the results of a polygenic risk score analysis examining whether an individ-ual’s number of genetic variants predisposing to breast size are associated with breastfeeding.
Materials and Methods
ParticipantsParticipants in this study were 3,364 female twin moth-ers from the QIMR health and lifestyle studies Cohorts I and II with data on breastfeeding. Women in Cohort
I were born between 1892 and 1963 (n = 3,205) and
women in Cohort II were born between 1,964 and 1971
(n = 419). At the time of the survey (1988–93), the
mean age was 43.41 years (SD = 12.32, range = 25–86
years), for women in Cohort I and 24.81 years (SD =
1.87, range=19–29 years) for women in Cohort II. Further
details of the sample, data collection and zygosity determi-nation are described elsewhere for cohort I (Heath et al.,
1997) and for cohort II (Knopik et al.,2004).
The sample comprised 992 complete twin pairs: 629 MZ and 363 DZ, and 1,380 individual twins from incom-plete pairs (411 MZ and 347 DZ from female-female pairs, 621 from female-male pairs and 5 of unknown zygosity). Genome-wide genotypic data were available for 1,521 of the 3,364 individuals.
Procedure
contact to establish the test-retest reliability of the interview measures.
As part of follow-up studies, blood samples were col-lected from the majority of participants in Cohorts I and II. DNA samples were genotyped using the Illumina 317, 370 and 610 SNP chips. Following quality control, the data were
imputed using the subset of281,000 markers, which were
available across all chips. The genotypes were phased us-ing MACH, then imputed (includus-ing the X chromosome) using Minimac based on the 283 European reference in-dividuals in the March 2013 release of phased haplotype from the 1000 Genomes project. In the analyses presented here, we used data from 6.59 M imputed SNPs that passed quality control (R2 > 0.3 and minor allele frequency >
1%) for association analysis. Details of SNP typing, qual-ity control, data cleaning (including ancestry exclusion) and analysis are given in detail elsewhere (Medland et al.,
2009).
This study was approved by the Queensland Institute of Medical Research Human Research Ethics Committee and the storage of the data follows national regulations regarding personal data protection. All of the participants provided informed consent.
Measures
Data were based on retrospective self-reports. All the par-ticipants were asked about details of the birth of up to eight children, including birth complications, time of birth, birth weight, hours of labor, feelings of depression and type of feeding in the first month (see Appendix). The variable we analyzed was the mean number of months they breastfed each child, averaged across all live births and standardized to a Z-score.
Data Analysis
Twin modelling. Data preparation and descriptive and preliminary analyses were performed in SPSS v.19 (SPSS,
2010). Assumptions of the twin design were checked,
in-cluding the homogeneity of the means and variances of first- and second-born twins and across zygosity groups. Further details of the twin design, including checking at
as-sumptions, can be found elsewhere (Neale & Cardon,1992;
Posthuma et al.,2003).
Statistical analyses employed full information
maximum-likelihood modelling (FIML) procedures
using the statistical package Mx (Neale et al., 2006). In
FIML, both complete and incomplete pairs of twins can be used in the analyses and the goodness-of-fit of a model
to the observed data is distributed as chi-square (2). By
testing the change in chi-square (2) against the change in
degrees of freedom (df), we can test whether dropping or
equating specific model parameters significantly worsens the model fit. The best-fitting model was chosen in each case by deducting the residual deviance of the compared
models and by comparing Akaike’s information criterion (AIC).
In a first step, we determined twin pair correlations per zygosity group for breastfeeding. We tested whether MZ correlations were higher than those of DZ twin pairs, which would suggest a genetic influence on individual differences in this trait. Then, variance component model-fitting was conducted to partition the variation in breastfeeding into genetic, shared environmental and non-shared environ-mental influences. Observed MZ and DZ twin correlations generally reflect a combination of A, C, D, and E influences, and structural equation modeling determines the combina-tion that best matches the observed data (Posthuma et al.,
2003). Age at the survey time was modelled as covariate in
all the analyses.
SNP-based genome-wide association study. One thou-sand genome imputed dosage data were tested for asso-ciation with breastfeeding using the additive family-based association test in Merlin-off line (Chen & Abecasis,2007). Correction for age at the survey time was performed by fitting the covariate in the regression model. We adopted a genome-wide significance level for the association between
SNP and phenotype of 5×10⁻⁸or smaller to correct for the
total number of independent tests (Dudbridge & Gusnanto,
2008).
Gene-based analysis. A gene-based test, Versatile Gene-based Association Study (VEGAS), designed for use with
GWAS data with related individuals (Liu et al.,2010), was
conducted to determine the level of association across the gene while correcting for linkage disequilibrium (LD) and gene size. Details of this procedure are summarized else-where (Verweij et al.,2010). In brief, this test explores as-sociation of each gene (including 50 Kb up and down of
the coding region) taking into account thepvalues of all
SNPs (after first pruning out those in high LD) (r2>0.20)),
and the LD between them. Apvalue below␣=2.8×10⁻⁶
was considered to be genome-wide significant as the gene-based association test included 17,585 genes (0.05/17,585 genes).
Polygenic study. To examine a potential shared genetic etiology between breastfeeding and breast size, we tested the effects of SNPs previously associated with breast size through a polygenic risk scoring approach. This took the top 2,079 SNPs associated with breast size in a previous
GWAS in an independent sample (Eriksson et al.,2012)
at ap value of.0001. These were then clumped within
PLINK (Purcell et al.,2007) to correct for LD within the
QIMR sample (R2 <0.2 in 250 kb windows), identifying
TABLE 1
Breastfeeding Duration (Months) According to Childbirth Order
Child order n Mean SD Range
1st child 3,295 5.32 4.74 0–48
2nd child 2,568 5.19 5.17 0–48
3rd child 1,362 5.24 5.51 0–36
4th child 547 5.67 6.63 0–60
5th child 209 4.93 5.99 0–36
6th child 76 3.93 4.44 0–20
7th child 25 4.76 8.07 0–40
8th child 8 4.12 3.44 0–9
for covariates of five principal components. Variance ex-plained by this score was derived as that of a model including the polygenic score and covariates minus the variance ex-plained by a model including only covariates as predictors of breastfeeding.
Results
Descriptive Results
As stated before, our sample is entirely comprised of moth-ers who reported data about breastfeeding. The mean
num-ber of children was 2.52 (SD=1.26, range=1–12). Three
out of four (75.2%) women breastfed for at least 1 month for each one of their births. The mean duration of
breastfeed-ing was 5.31 months (SD=4.69, range: 0–48), with slight
changes according to child order (Table 1).Table 2presents the correlation matrix for the duration of breastfeeding for the first five children. Breastfeeding reports showed a high test–retest reliability (r=0.96,p<.001) and internal
con-sistency among breastfeeding durations (Cronbach’s␣=
0.98; ICC=0.85).
Twin Correlations and Variance Component Model-Fitting
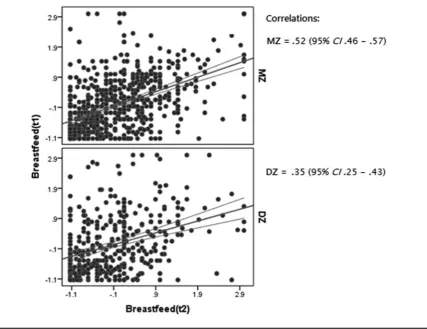
The MZ twin correlation for the mean breastfeeding
du-ration (rMZ=0.52, 95% CI 0.46–0.57) was larger than for
DZ twins (rDZ=0.35, 95% CI 0.25–0.43), which suggests
the presence of genetic influences (seeFigure 1). Lower cor-relations were found for the breastfeeding duration of the first-born child (rMZ=0.41, 95% CI 0.34–0.47;rDZ=0.27,
95% CI .17–0.37).
A univariate model was fit to disentangle the sources of
variance of the mean breastfeeding duration (seeTable 3).
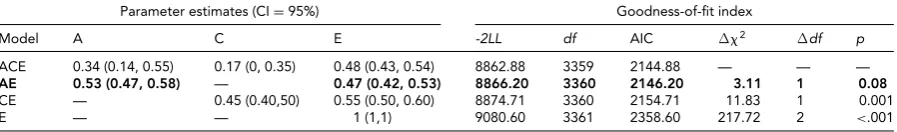
Since the DZ twin correlation was more than half the MZ twin correlation, C was estimated instead of D. The best-fitting model was the one that included additive genetic and non-shared environmental sources of variation — shared environmental factors did not account for a significant por-tion of variapor-tion. Additive genetic factors accounted for 53% in breastfeeding (95% CI 47%–58%) and the remain-ing 47% was due to unique environmental factors (95% CI 42%–53%). The reduced model fit well, as it did not differ significantly from the full ACE model. The model-fitting analysis revealed a similar structure of the underlying vari-ance for the breastfeeding duration in the first-born child, though with lower heritability (0.42 vs. 0.53 for average duration).
Genome-Wide Association Study
We conducted a GWAS of breastfeeding in 1,521 individu-als from 1,073 Australian families. The average age of the
genotyped sample was 46.46 years (SD= 11.38).
Breast-feeding mean duration in this subsample was 5.52 months
(SD=4.75). We tested 6.59 M SNPs for association with
breastfeeding, correcting for age at the time of survey.
TABLE 2
Correlations (N) for Breastfeeding Duration (Months) in the First Five Children
Child order 1st child 2nd child 3rd child 4th child 5th child
1st child 1 (3,295)
2nd child 0.67∗(2,508) 1 (2,568)
3rd child 0.51∗(1,317) 0.71∗(1,336) 1 (1,362)
4th child 0.47∗(525) 0.68∗(531) 0.77∗(531) 1 (547)
5th child 0.49∗(199) 0.61∗(205) 0.68∗(203) 0.82∗(206) 1 (209)
Note: Spearman’s rho (N).∗p<.01.
TABLE 3
Model-Fitting Results for Univariate Models for Breastfeeding Mean Duration and Proportions of Variance Explained By Additive Genetic Influences (A), Common Environment (C) and Unique Environment (E)
Parameter estimates (CI=95%) Goodness-of-fit index
Model A C E -2LL df AIC 2 df p
ACE 0.34 (0.14, 0.55) 0.17 (0, 0.35) 0.48 (0.43, 0.54) 8862.88 3359 2144.88 — — —
AE 0.53 (0.47, 0.58) — 0.47 (0.42, 0.53) 8866.20 3360 2146.20 3.11 1 0.08
CE — 0.45 (0.40,50) 0.55 (0.50, 0.60) 8874.71 3360 2154.71 11.83 1 0.001
E — — 1 (1,1) 9080.60 3361 2358.60 217.72 2 <.001
Note: A: additive genetic factors, AIC: Akaike’s information criterion, BF: breastfeeding mean duration across all births, C: common environmental
factors, CI: confidence interval,df: degrees of freedom, E: unique environmental factors, -2LL: twice negative log-likelihood,2: difference in
FIGURE 1
Scatter plot of twin correlations with 95% confidence intervals (CI) for breastfeeding duration. Note. t1: twin 1, t2: twin 2
FIGURE 2
(Colour online) Manhattan plot showing the results of the genome-wide association analyses for breastfeeding. Genes at or nearby best SNPs are indicated. The vertical axis shows the -log10of the associatedp values and the horizontal axis shows the chromosome numbers divided into 22 autosomes and the X chromosome.
The Manhattan plot of association p values for 6.59
M SNPs is shown in Figure 2. While no SNP achieved
genome-wide significance (p<6.6∗10−8), regions of
sug-gestive association signals, with the smallest p value of
1.2∗10−7obtained for a SNP (rs6950451) were observed on
chromosome 7. Suggestive association signals were also detected in chromosomes 2 (SNP rs930421) and 18 (rs9807759), withpvalues of 1.2∗10−6in both cases.
The quantile-quantile plot (Q-Q plot) of the
FIGURE 3
(Colour online) Quantile–quantile plot for breastfeeding mean duration. The horizontal axis shows the -log10of expectedp values of association from a 1 degree of freedom chi-square distribution and the vertical axis shows the -log10ofp values from the observed chi-square distribution. The colored dots represent the top hit SNPs. Genes at or nearby best SNPs are indicated.
association) log10(pvalue) from the association analysis is
presented inFigure 3. The genomic control l (1.007) was
close to 1.0, indicating that there was no evidence for in-flation of the test statistics or a bias because of possible population stratification in the results (Bacanu et al.,2000) and that the family-based association model had correctly accounted for relatedness.
The top SNPs and gene regions from GWAS analysis with the strongest association with breastfeeding are shown in
Table 4.
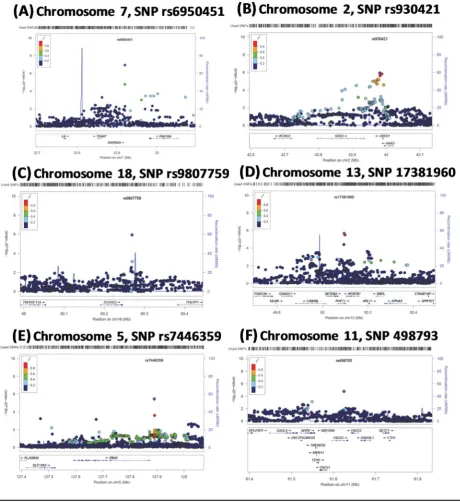
Figure 4 shows the locus zoom plots of the uncondi-tioned analyses for the top five SNPs, rs6950451, rs930451, rs9807759, rs17381960, rs7446359, and also for rs498793, since there are genes at or nearby this latter SNP that have
been emphasized for their role in the composition of fatty
acids in mothers’ milk (Glaser et al., 2011; Standl et al.,
2012). Notably, although LD structure surrounding the
chromosome 7 locus is rather sparse, rs6950451 was well
imputed (R2=0.84). Conditional analyses on the top SNP
were also performed, and there were no associated SNPs withp<.001.
Gene-Based Analysis
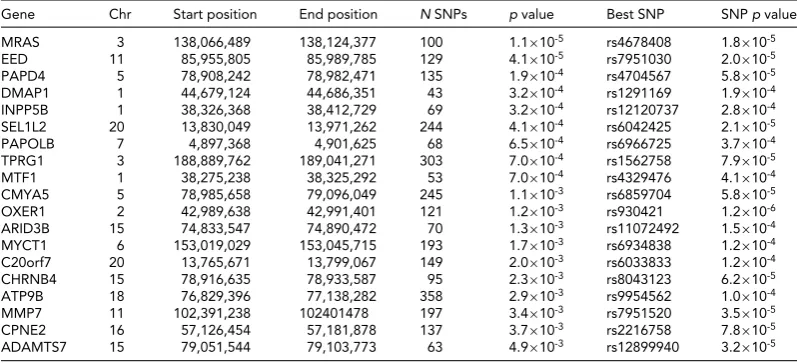
Gene-based test results are shown inTable 5. Although none
of the genes reached genome-wide significance, we list the top 20 genes. Two of these (MRAs and OXER1) have already
been noted in the top SNP analysis (Table 4), but the other
TABLE 4
Top Ten SNPs and Potential Candidates and Their Gene Regions From GWAS Analysis Showing the Strongest Associations With Breastfeeding
SNP CHR bp Alleles AL1% B SE B p value At or near gene(s)
rs6950451 7 22,979,808 A/G 77.1 -0.259 0.049 1.2×10⁻⁷ SNORD93, FAM126A
rs930451 2 42,981,239 A/G 68.4 -0.204 0.042 1.2×10⁻⁶ OXER1, HAAO, MTA3
rs9807759 18 60,269,356 C/T 84.4 -0.401 0.083 1.2×10⁻⁶ ZCCHC2
rs17381960 13 50,095,682 G/A 96.0 -0.778 0.164 2.2×10⁻⁶ PHF11, RCBTB1
rs7446359 5 127,890,720 G/A 98.3 -1.185 0.256 3.6×10⁻⁶ FBN2
rs7635879 3 193,736,373 T/A 55.2 0.176 0.039 5.8×10⁻⁶ DPPA2P3, LOC647323
rs7699884 4 181,295,238 T/C 60.2 0.179 0.040 7.7×10⁻⁶ (No Gene in±400 kb)
rs2277212 10 11,299,735 T/A 74.7 -0.298 0.067 8.7×10⁻⁶ CELF2, CELF-AS2
rs218271 4 55,411,591 C/G 79.4 -0.238 0.054 8.9×10⁻⁶ KIT
rs4724103 7 42,339,894 C/T 55.3 -0.167 0.038 9.8×10⁻⁶ GLI3
rs498793 11 61,624,705 C/T 61.3 -0.185 0.043 1.7×10⁻⁵ FADS2, FADS3, FADS1
TABLE 5
Genes (p<5×10⁻³) From VEGAS Gene-Based Analysis Showing the Strongest Associations With Breastfeeding
Gene Chr Start position End position N SNPs p value Best SNP SNPp value
MRAS 3 138,066,489 138,124,377 100 1.1×10⁻⁵ rs4678408 1.8×10⁻⁵
EED 11 85,955,805 85,989,785 129 4.1×10⁻⁵ rs7951030 2.0×10⁻⁵
PAPD4 5 78,908,242 78,982,471 135 1.9×10⁻⁴ rs4704567 5.8×10⁻⁵
DMAP1 1 44,679,124 44,686,351 43 3.2×10⁻⁴ rs1291169 1.9×10⁻⁴
INPP5B 1 38,326,368 38,412,729 69 3.2×10⁻⁴ rs12120737 2.8×10⁻⁴
SEL1L2 20 13,830,049 13,971,262 244 4.1×10⁻⁴ rs6042425 2.1×10⁻⁵
PAPOLB 7 4,897,368 4,901,625 68 6.5×10⁻⁴ rs6966725 3.7×10⁻⁴
TPRG1 3 188,889,762 189,041,271 303 7.0×10⁻⁴ rs1562758 7.9×10⁻⁵
MTF1 1 38,275,238 38,325,292 53 7.0×10⁻⁴ rs4329476 4.1×10⁻⁴
CMYA5 5 78,985,658 79,096,049 245 1.1×10⁻³ rs6859704 5.8×10⁻⁵
OXER1 2 42,989,638 42,991,401 121 1.2×10⁻³ rs930421 1.2×10⁻⁶
ARID3B 15 74,833,547 74,890,472 70 1.3×10⁻³ rs11072492 1.5×10⁻⁴
MYCT1 6 153,019,029 153,045,715 193 1.7×10⁻³ rs6934838 1.2×10⁻⁴
C20orf7 20 13,765,671 13,799,067 149 2.0×10⁻³ rs6033833 1.2×10⁻⁴
CHRNB4 15 78,916,635 78,933,587 95 2.3×10⁻³ rs8043123 6.2×10⁻⁵
ATP9B 18 76,829,396 77,138,282 358 2.9×10⁻³ rs9954562 1.0×10⁻⁴
MMP7 11 102,391,238 102401478 197 3.4×10⁻³ rs7951520 3.5×10⁻⁵
CPNE2 16 57,126,454 57,181,878 137 3.7×10⁻³ rs2216758 7.8×10⁻⁵
ADAMTS7 15 79,051,544 79,103,773 63 4.9×10⁻³ rs12899940 3.2×10⁻⁵
Polygenic Study
Next, we tested an association between the polygenic score for breast size and we found no significant associations between a polygenic score of genetic predisposition to breast
size and breastfeeding among the 66 SNPs withp<10−4
available (=0.011,r2=0.003,p=0.67).
Discussion
In this investigation, we used a broad behavioral genetics approach to analyze individual differences in breastfeeding. The first objective was to explore the proportion of genetic and environmental sources in the variation of breastfeed-ing. Correlations were higher for MZ twins than for DZ twins, suggesting the presence of genetic factors implicated in this behavior. The results of the twin analysis showed that the best-fitting model was the one including additive genetics effects and unique environmental factors, explain-ing 53% (CI 95%: 0.47–0.58) and 47% (CI 95%: 0.42–0.53) of the variance in breastfeeding behavior, respectively. The results are also compatible with the full model, in which 17% (CI 95%: 0–0.35) of variance was accounted for by
common environmental factors. The values obtained here are very similar to those found recently in a Spanish sample
(Colodro-Conde et al.,2013), where 54% of the variance
of breastfeeding duration of all the offspring was due to additive genetic factors and the remaining 46% to unique environmental factors. Despite the samples coming from two distinct cultural backgrounds (Australia vs. Spain) and measures being different (quantitative vs. ordinal), the silar results obtained confirm that genetic factors are an im-portant source of variation between women’s breastfeeding behavior. While we have not been able to detect any sig-nificant effect of shared environmental factors, this may be because of a lack of power due to sample size and our results,
which are compatible with a C2as high as 35%.
Confirmation that genetic factors influence breastfeed-ing behavior justified our explorbreastfeed-ing the genetic variants underlying this trait by GWAS, as is discussed below.
FIGURE 4
(Colour online) Regional association plots for breastfeeding. (A), showing the top associated SNP rs6950451 (p=1.2×10⁻⁷) on chromo-some 7; (B-F), showing the possible associated regions; on chromochromo-somes 2, 5, 11, 13 and 18.
gene-based analysis did not find any significant results. In addition, we detected suggestive associations of some ge-netic regions with plausible links to breastfeeding. Among
them, the oxoeicosanoid (OXE) receptor 1 gene (p =
1.2∗10−3) in chromosome 2 is a receptor for eicosanoids and
polyunsaturated fatty acids (Rebhan et al.,1997), which are
present in breast milk (Koletzko et al.,2008).
It is well known that breast milk provides a unique sup-ply of long chain polyunsaturated fatty acids and that their
synthesis is controlled by key enzymes encoded by the FADS gene cluster (Marquardt et al.,2000; Martin et al.,2011). In this work, we found a suggestive association of the FADS1 (p=2.3∗10−2), FADS2 (p=3.9∗10−2) and FADS3 (p=
been associated not only with higher colostrum levels of long chain polyunsaturated fatty acids but also with higher cognitive scores in their children (Morales et al.,2011).
Accordingly, changes in these gene regions may have an effect on breastfeeding duration. As no other study has explored the molecular genetic basis of breastfeeding, we cannot yet replicate our findings. The fact that we did not find genome-wide significant results is to be expected, con-sidering the low power.
This article has some limitations that need to be taken into consideration. First, measures of breastfeeding were based on self-report and much of the data used was re-ported a long time after the breastfeeding took place. A larger sample is also required for the GWAS as we expect that breastfeeding is influenced by a large number of SNPs with very small effect size. Ideally, we seek to conduct a meta-analysis combining different samples.
In summary, we have confirmed that genetic factors are significant in the explanation of breastfeeding behav-ior variability. However, we could neither identify any breastfeeding-related SNP reaching conventional levels of genome-wide significance, nor any overlap with an individ-ual’s genetic predisposition towards breast size. This study provides replication of a previous one that explored the sources of variance of breastfeeding in a Spanish sample and, to our knowledge, is the first one to conduct a prelim-inary GWAS on breastfeeding.
Acknowledgments
We are grateful to the twins for their participation and to the data collectors and data managers Anthony Conciatore, Richard Parker and Scott Gordon. We also thank Liz Ri-etschel, Jana Strohmaier, Brendan Zietsch, Ada Johansson, Patrick Jern, and Miguel Renteria for their comments on earlier drafts of this paper. Genome-wide genotyping in the Australian sample was funded by NIH Grants AA013320, AA013321, AA013326, AA011998 and AA017688. LCC was supported for a research visit at Genetic Epidemiology Lab-oratory, QIMR, and for a postdoctoral fellowship by Seneca Foundation — Regional Agency for Science and Technol-ogy, Murcia, Spain (12431/FPI/09 and 19151/PD/13).
References
Almqvist-Tangen, G., Bergman, S., Dahlgren, J., Roswall, J., & Alm, B. (2012). Factors associated with discontinuation of breastfeeding before 1 month of age.Acta Paediatrica,101, 55–60.
Australian Bureau of Statistics. (2013). Australian Health Survey: Health Service Usage and Health Re-lated Actions, 2011–12. Retrieved from http://www. abs.gov.au/ausstats/abs@.nsf/Lookup/6664B939E49FD 9C1CA257B39000F2E4B
Bacanu, S.-A., Devlin, B., & Roeder, K. (2000). The power of genomic control.The American Journal of Human Genetics, 66, 1933–1944.
Balen, A. H., Conway, G. S., Kaltsas, G., Techatraisak, K., Manning, P. J., West, C., . . . Jacobs, H. S. (1995). Androl-ogy: Polycystic ovary syndrome: The spectrum of the disor-der in 1741 patients.Human Reproduction,10, 2107–2111. Barber, T., McCarthy, M., Wass, J., & Franks, S. (2006). Obesity and polycystic ovary syndrome.Clinical Endocrinology,65, 137–145.
Brown, A. (2014). Maternal trait personality and breastfeeding duration: The importance of confidence and social support. Journal of Advanced Nursing,70, 587–598.
Brown, A., Raynor, P., & Lee, M. (2011). Healthcare profes-sionals’ and mothers’ perceptions of factors that influence decisions to breastfeed or formula feed infants: A compar-ative study.Journal of Advanced Nursing,67, 1993–2003. Calnen, G. (2010). A strategy for the future. Breastfeeding
Medicine,5, 95–95.
Centers for Disease Control and Prevention. (2014). Breastfeeding among US children born 2001–2011, CDC National Immunization Survey. Retrieved from http://www.cdc.gov/breastfeeding/data/nis˙data/
Chen, W.-M., & Abecasis, G. R. (2007). Family-based associa-tion tests for genomewide associaassocia-tion scans.The American Journal of Human Genetics,81, 913–926.
Colodro-Conde, L., Limi˜nana Gras, R. M., & Ordo˜nana, J.R. (in press (a)). Estilos de Personalidad y Adaptaci ´on Psi-col ´ogica en la toma de decisiones sobre Lactancia en mujeres prim´ıparas [Personality Styles and Psychological Adjust-ment when making decisions about Breastfeeding in prim-iparous women]. Revista Iberoamericana de Diagn ´ostico y Evaluaci ´on Psicol ´ogica.
Colodro-Conde, L., Limi˜nana Gras, R. M., S´anchez-L ´opez, M.P., & Ordo˜nana, J.R. (in press (b)). Gender, Health and Initiation of Breastfeeding.Women & Health.
Colodro-Conde, L., S´anchez-Romera, J. F., & Ordo˜nana, J. R. (2013). Heritability of initiation and duration of breast-feeding behavior.Twin Research and Human Genetics,16, 575–580.
Colodro-Conde, L., S´anchez-Romera, J. F., Tornero-G ´omez, M. J., P´erez-Riquelme, F., Polo-Tom´as, M., & Ordo˜nana, J. R. (2011). Relationship between level of education and breastfeeding duration depends on social context breast-feeding trends over a 40-year period in Spain.Journal of Human Lactation,27, 272–278.
De Jager, M., Hartley, K., Terrazas, J., & Merrill, J. (2012). Bar-riers to breastfeeding – A global survey on why women start and stop breastfeeding.European Obstetrics & Gynaecology, 7, 25–30.
Dudbridge, F., & Gusnanto, A. (2008). Estimation of signifi-cance thresholds for genomewide association scans.Genetic Epidemiology,32, 227–234.
Glaser, C., Lattka, E., Rzehak, P., Steer, C., & Koletzko, B. (2011). Genetic variation in polyunsaturated fatty acid metabolism and its potential relevance for human devel-opment and health.Maternal & Child Nutrition,7, 27–40. Heath, A. C., Bucholz, K., Madden, P., Dinwiddie, S., Slutske, W., Bierut, L., . . . Martin, N. (1997). Genetic and envi-ronmental contributions to alcohol dependence risk in a national twin sample: Consistency of findings in women and men.Psychological Medicine,27, 1381–1396.
Heinig, M. J., & Dewey, K. G. (1997). Health effects of breast feeding for mothers: A critical review.Nutrition Research Reviews,10, 35–56.
Holman, D. J., & Grimes, M. A. (2003). Patterns for the ini-tiation of breastfeeding in humans. American Journal of Human Biology,15, 765–780.
Ip, S., Chung, M., Raman, G., Chew, P., Magula, N., DeVine, D., . . . Lau, J. (2009). Breastfeeding and maternal and infant health outcomes in developed countries (Evidence Report/Technology Assessment No. 153). Rockville, MD: Agency for Healthcare Research and Quality.
Jevitt, C., Hernandez, I., & Gro¨er, M. (2007). Lactation com-plicated by overweight and obesity: Supporting the mother and newborn.Journal of Midwifery & Women’s Health,52, 606–613.
Jonas, W., Mileva-Seitz, V., Girard, A., Bisceglia, R., Kennedy, J., Sokolowski, M., . . . Steiner, M. (2013). Genetic variation in oxytocin rs2740210 and early adversity associated with postpartum depression and breastfeeding duration.Genes, Brain and Behavior,12, 681–694.
Katz, K. A., Nilsson, I., & Rasmussen, K. M. (2010). Danish health care providers’ perception of breastfeeding difficulty experienced by women who are obese, have large breasts, or both.Journal of Human Lactation,26, 138–147. Knopik, V. S., Heath, A. C., Madden, P. A., Bucholz, K. K.,
Slutske, W. S., Nelson, E. C., . . . Martin, N. G. (2004). Ge-netic effects on alcohol dependence risk: Re-evaluating the importance of psychiatric and other heritable risk factors. Psychological Medicine,34, 1519–1530.
Koletzko, B., Lien, E., Agostoni, C., B¨ohles, H., Campoy, C., Cetin, I., . . . Forsyth, S. (2008). The roles of long-chain polyunsaturated fatty acids in pregnancy, lactation and in-fancy: Review of current knowledge and consensus recom-mendations.Journal of Perinatal Medicine,36, 5–14. Li, J., Kendall, G., Henderson, S., Downie, J., Landsborough,
L., & Oddy, W. (2008). Maternal psychosocial well-being in pregnancy and breastfeeding duration.Acta Paediatrica, 97, 221–225.
Liu, J. Z., Mcrae, A. F., Nyholt, D. R., Medland, S. E., Wray, N. R., Brown, K. M., . . . Martin, N. G. (2010). A versatile gene-based test for genome-wide association studies.The American Journal of Human Genetics,87, 139–145. Marquardt, A., St¨ohr, H., White, K., & Weber, B. H. (2000).
cDNA cloning, genomic structure, and chromosomal local-ization of three members of the human fatty acid desaturase family.Genomics,66, 175–183.
Martin, N. W., Benyamin, B., Hansell, N. K., Montgomery, G. W., Martin, N. G., Wright, M. J., . . . Bates, T. C. (2011). Cognitive function in adolescence: Testing for interactions
between breast-feeding and FADS2 polymorphisms. Jour-nal of the American Academy of Child & Adolescent Psychia-try,50, 55–62.
McFadden, A., & Toole, G. (2006). Exploring women’s views of breastfeeding: A focus group study within an area with high levels of socio-economic deprivation.Maternal & Child Nu-trition,2, 156–168.
Medland, S. E., Nyholt, D. R., Painter, J. N., McEvoy, B. P., McRae, A. F., Zhu, G., . . . Henders, A. K. (2009). Com-mon variants in the trichohyalin gene are associated with straight hair in Europeans.The American Journal of Human Genetics,85, 750–755.
Ministerio de Sanidad, Servicios Sociales e Igualdad (MSSSI). Encuesta Nacional de Salud de Espa˜na [Spanish National Health Survey]. (2012). Re-trieved from http://www.msssi.gob.es/en/estadEstudios/ estadisticas/sisInfSanSNS/home.htm.
Morales, E., Bustamante, M., Gonzalez, J. R., Guxens, M., Torrent, M., Mendez, M., . . . Vrijheid, M. (2011). Genetic variants of the FADS gene cluster and ELOVL gene fam-ily, colostrums LC-PUFA levels, breastfeeding, and child cognition.PLoS One,6, e17181.
Neale, M., Boker, S., Xie, G., & Maes, H. (2006).Mx: Statistical modeling(7th ed.). Richmond, VA: Virginia Institute for Psychiatric and Behavioral Genetics. Department of Psy-chiatry.
Neale, M. C., & Cardon, L. R. (1992).Methodology for genetic studies of twins and families. Dordrecht, The Netherlands: Kluwer Academic Publishers.
Ordo˜nana, J. R., Perez-Riquelme, F., Gonzalez-Javier, F., Carrillo, E., Gomez-Amor, J., & Martinez-Selva, J. M. (2006). An initiative in Spain for the study of women’s health: The Murcia twin registry.Twin Research and Hu-man Genetics,9, 865–867.
Ordo˜nana, J. R., Rebollo-Mesa, I., Carrillo, E., Colodro-Conde, L., Garc´ıa-Palomo, F. J., Gonz´alez-Javier, F., . . . P´erez-Riquelme, F. (2013). The Murcia twin registry: A population-based registry of adult multiples in spain.Twin Research and Human Genetics,16, 302–306.
Posthuma, D., Beem, A. L., de Geus, E. J. C., van Baal, G. C. M., von Hjelmborg, J. B., Iachine, I., . . . Boomsma, D. I. (2003). Theory and practice in quantitative genetics.Twin Research and Human Genetics,6, 361–376.
Purcell, S., Neale, B., Todd-Brown, K., Thomas, L., Ferreira, M. A., Bender, D., . . . Daly, M. J. (2007). PLINK: A tool set for whole-genome association and population-based linkage analyses.The American Journal of Human Genetics, 81, 559–575.
Rebhan, M., Chalifa-Caspi, V., Prilusky, J., & Lancet, D. (1997). GeneCards: Encyclopedia for genes, proteins and diseases. Re-trieved fromhttp://www.genecards.org/.
Sakalidis, V. S., Williams, T. M., Garbin, C. P., Hepworth, A. R., Hartmann, P. E., Paech, M. J., . . . Geddes, D. T. (2013). Ultrasound imaging of infant sucking dynamics during the establishment of lactation.Journal of Human Lactation,29, 205–213.
Sellen, D. W. (2007). Evolution of infant and young child feed-ing: Implications for contemporary public health.Annual Review of Nutrition,27, 123–148.
Spencer, J. P. (2008). Management of mastitis in breastfeeding women.American Family Physician,78, 727–731.
SPSS. (2010).IBM SPSS Statistics Base 19. Chicago, IL: SPSS Inc.
Standl, M., Sausenthaler, S., Lattka, E., Koletzko, S., Bauer, C., Wichmann, H., . . . Schaaf, B. (2012). FADS gene cluster modulates the effect of breastfeeding on asthma. Results from the GINIplus and LISAplus studies.Allergy,67, 83– 90.
Swanson, V., & Power, K. G. (2005). Initiation and continua-tion of breastfeeding: Theory of planned behaviour.Journal of Advanced Nursing,50, 272–282.
Tharner, A., Luijk, M. P., Raat, H., IJzendoorn, M. H., Bakermans-Kranenburg, M. J., Moll, H. A., . . . Tiemeier, H. (2012). Breastfeeding and its relation to maternal sen-sitivity and infant attachment.Journal of Developmental & Behavioral Pediatrics,33, 396–404.
Thulier, D., & Mercer, J. (2009). Variables associated with breastfeeding duration.Journal of Obstetric, Gynecologic, & Neonatal Nursing,38, 259–268.
Verweij, K. J., Zietsch, B. P., Medland, S. E., Gordon, S. D., Benyamin, B., Nyholt, D. R., . . . Madden, P. A. (2010).
A genome-wide association study of Cloninger’s tem-perament scales: Implications for the evolutionary ge-netics of personality. Biological Psychology, 85, 306– 317.
Wade, T. D., Zhu, G., & Martin, N. G. (2010). Body mass index and breast size in women: Same or different genes?Twin Research and Human Genetics,13, 450–454.
Wagner, C. L., Wagner, M. T., Ebeling, M., Chatman, K. G., Cohen, M., & Hulsey, T. C. (2006). The role of personality and other factors in a mother’s decision to initiate breast-feeding.Journal of Human Lactation,22, 16–26.
Wojcicki, J. M. (2011). Maternal prepregnancy body mass in-dex and initiation and duration of breastfeeding: A re-view of the literature.Journal of Women’s Health,20, 341– 347.
World Health Organization. (2013). Global health observatory data repository [database].
World Health Organization, K. G. (1997).Growth patterns of breastfed infants and the current status of growth charts for infants. (No. Joint WHO/UNICEF Meeting on Infant and Young Child Feeding: Statement and Recommendations). Geneva, Switzerland: World Health Organization. World Health Organization, & United Nations Children’s
Appendix
Births
1. With each pregnancy resulting in birth have you had any of the following?
Birth
PLEASE TICK IF ANSWER IS YES 1 2 3 4 5 6 7 8+
1. High blood pressure, toxemia 2. Premature baby (over 2 weeks early) 3. Epidural anesthetic (block) 4. Induced labor
5. Stitches (episiotomy or tear) 6. Stillborn child
7. Forceps delivery 8. Cesarean section
2. What time was the baby born? (e.g., 2 pm) 3. How many hours was the labor? (e.g., ll hours) 4. What was the birth weight of the baby? 5. Was each labor painful/difficult? (1, 2 or 3)
(1) Extremely (2) Quite (3) Not really
6. Did you feel depressed after the birth of any of your children? TICK IF YES IF YES:
How many weeks did this go on for? Did you need to seek help for the depression? 7. How many months did you breastfeed for?