b y kill e r w h a l e s (O r ci n u s o r c a). M a r i n e M a m m a l S ci e n c e , 3 1 ( 2).
p p . 6 8 8-7 0 6 .
Do w n l o a d e d fr o m : h t t p ://i n si g h t . c u m b r i a . a c . u k /i d/ e p ri n t/ 1 6 8 9 /
U s a g e o f a n y i t e m s f r o m t h e U n i v e r s i t y o f C u m b r i a’ s i n s t i t u t i o n a l r e p o s i t o r y ‘I n s i g h t ’ m u s t c o n f o r m t o t h e f o l l o w i n g f a i r u s a g e g u i d e l i n e s .
Any it e m a n d it s a s s o ci a t e d m e t a d a t a h el d i n t h e U niv e r si ty of C u m b r i a ’s in s ti t u ti o n al r e p o si t o r y I n si g h t ( u nl e s s s t a t e d o t h e r wi s e o n t h e m e t a d a t a r e c o r d ) m a y b e c o pi e d , di s pl ay e d o r p e rf o r m e d , a n d s t o r e d i n li n e wi t h t h e JIS C f ai r d e a li n g g ui d eli n e s ( av ail a bl e h e r e) fo r e d u c a t i o n al a n d n o t-fo r-p r ofi t a c tiviti e s
p r o v i d e d t h a t
• t h e a u t h o r s , ti tl e a n d full bi blio g r a p h i c d e t ail s of t h e it e m a r e ci t e d cl e a rly w h e n a n y p a r t
of t h e w o r k is r ef e r r e d t o v e r b a lly o r i n t h e w ri t t e n fo r m
• a h y p e rli n k/ U RL t o t h e o ri gi n al I n si g h t r e c o r d of t h a t it e m is i n cl u d e d i n a n y ci t a ti o n s of t h e w o r k
• t h e c o n t e n t is n o t c h a n g e d i n a n y w a y
• all fil e s r e q ui r e d fo r u s a g e of t h e it e m a r e k e p t t o g e t h e r wi t h t h e m a i n it e m fil e.
Yo u m a y n o t
• s ell a n y p a r t of a n it e m
• r e f e r t o a n y p a r t of a n it e m wi t h o u t ci t a ti o n
• a m e n d a n y it e m o r c o n t e x t u ali s e it i n a w a y t h a t will i m p u g n t h e c r e a t o r ’s r e p u t a t i o n
• r e m ov e o r a l t e r t h e c o py ri g h t s t a t e m e n t o n a n it e m .
T h e full p oli cy c a n b e fo u n d h e r e.
For Peer Review
1
Geographic variation in the time-frequency characteristics of
high-1
frequency whistles produced by killer whales (Orcinus orca)
2
3
Filipa I. P. Samarra 1,2,a, Volker B. Deecke1,3, Anne E. Simonis4 and Patrick J. O. 4
Miller1 5
6
1 Sea Mammal Research Unit, Scottish Oceans Institute, University of St Andrews, St
7
Andrews, Fife KY16 8LB, UK 8
2 Current address: Marine Research Institute, Skúlagata 4, 121 Reykjavík, Iceland
9
3 Current address: Centre for Wildlife Conservation, University of Cumbria, Rydal
10
Road, Ambleside, Cumbria, LA22 9BB. UK 11
4 Scripps Institution of Oceanography, University of California, San Diego, 9500
12
Gilman Drive, La Jolla, California 92093-0205, USA 13
14
a email: filipa@hafro.is
15
16
For Peer Review
Abstract17
Investigating intra-specific variation in acoustic signals can indicate the extent of 18
isolation and divergence between populations and adaptations to local 19
environments. Here we analyze the variation in killer whale high-frequency (>17 20
kHz) whistles recorded off Norway, Iceland, and the North Pacific. We used a 21
combination of methods including multivariate comparisons of spectral and 22
temporal parameters and categorization of contours to types. Our results show that 23
spectral and temporal characteristics of high-frequency whistles recorded in the 24
North Pacific show significant differences from whistles recorded in the Northeast 25
Atlantic, being generally stereotyped, lower in frequency, and slightly longer in 26
duration. Most high-frequency whistles from the North Pacific were downsweeps, 27
while this was one of the least common types recorded in the Northeast Atlantic. 28
The repertoire of whistles recorded in Norway was similar to Iceland, but whistles 29
produced in Norway had significantly lower maximum frequency and frequency 30
range. Most methods were able to discriminate between whistles of the North 31
Pacific and the Northeast Atlantic, but were unable to consistently distinguish 32
whistles from Iceland and Norway. This suggests that macro- and 33
microgeographic differences in high-frequency whistles of killer whales may 34
reflect historical geographic isolation between ocean basins and more recent 35
divergence between adjacent populations. 36
37
Keywords: ultrasonic whistles, orcas, geographic variation 38
For Peer Review
3
Introduction
40
When describing geographic variation in acoustic signals it is useful to divide 41
differences into macrogeographic or microgeographic variation, depending on 42
whether populations being compared are neighboring, making interbreeding and 43
social interaction a possibility, or geographically separated, and thus socially and 44
reproductively isolated (Mundinger 1982). Comparative studies of odontocete 45
whistles have shown more pronounced inter- than intra-specific variation in whistle 46
spectral parameters, which could arise if intra-specific variability is constrained to 47
occur within a species-specific framework (Steiner 1981, Ding et al. 1995a, Matthews 48
et al. 1999, Rendell et al. 1999, Podos et al. 2002). Variation in whistle structural
49
parameters has previously been described for populations of the same dolphin species 50
both at microgeographic (e.g., Azevedo and Van Sluys 2005, Morisaka et al. 2005) 51
and macrogeographic levels (e.g., Camargo et al. 2006, Baron et al. 2008). Intra-52
specific geographic variations may occur due to genetic divergence, adaptations to 53
local environments or cultural differences (Janik 2009). A general correlation of 54
whistle variation with distance has been proposed whereby neighboring populations 55
appear to have more similar whistle structure than geographically distant populations 56
(Ding et al. 1995b, Azevedo and Van Sluys 2005, Rossi-Santos and Podos 2006, 57
May-Collado and Wartzok 2008), although this is not always the case (Camargo et al.
58
2006). Within populations, there is often variation in duration and complexity of 59
signals (i.e., number of inflection points) (Steiner 1981, Azevedo and Van Sluys 60
2005, Morisaka et al. 2005), while the time-frequency contour of whistles often varies 61
among individuals, providing information on individual identity (e.g., bottlenose 62
dolphin, Tursiops truncatus; Janik et al. 2006; common dolphin, Delphinus delphis: 63
Caldwell and Caldwell 1968; Pacific humpback dolphin, Sousa chinensis: Van Parijs 64
For Peer Review
and Corkeron 2001). Understanding the variation in the acoustic repertoire within and 65
between different populations may shed light on the evolution, movements, and 66
cultural traditions of a species. 67
There are known differences in the structure and use of pulsed calls and whistles 68
between different killer whale populations. In the North Pacific, pods of resident 69
(fish-eating) killer whales produce unique and stable repertoires of stereotyped pulsed 70
calls (Ford 1989, 1991). These calls differ between matrilines within pods (Ford 1991, 71
Miller and Bain 2000, Deecke et al. 2010), and to a lesser degree between individuals 72
within the same matriline (Nousek et al. 2006). The stability of resident pods may 73
explain why the variation in pulsed calls primarily encodes group, rather than 74
individual, identity (Tyack 1986). Killer whale whistles are generally more complex 75
and longer than other delphinid whistles (Thomsen et al. 2001) and some have 76
stereotyped frequency contours that are often produced in complex sequences (Riesch 77
et al. 2006, 2008). Resident killer whale groups in British Columbia that do not share
78
pulsed calls share stereotyped whistles, which may provide a community-level means 79
of recognition, facilitating social interactions (Riesch et al. 2006). Transient 80
(mammal-eating) killer whales in the North Pacific also produce stereotyped whistles 81
and the repertoire seems to be shared by all members of the population (Riesch and 82
Deecke 2011). Despite being sympatric with resident killer whales, transients have 83
distinct, population-specific repertoires of both pulsed calls and whistles (Ford and 84
Fisher 1982, Riesch and Deecke 2011). 85
In Iceland and Norway, early studies suggested that killer whales also produce 86
group-specific call repertoires (Moore et al. 1988, Strager 1995). A common ecotype, 87
known as the “herring-eating Scandinavian killer whale” (Simon et al. 2007) has been 88
suggested for killer whales in this region due to close genetic relatedness (Foote et al.
For Peer Review
5
2009b, Morin et al. 2010) and similar acoustic and foraging behavior. Killer whales 90
are thought to have regularly migrated between these two locations (Jonsgård and 91
Lyshoel 1970) due to the distribution of their main prey, Atlantic herring Clupea
92
harengus (Sigurjónsson et al. 1988, Similä et al. 1996, Simon et al. 2007). The
93
migration route of the Atlanto-Scandian herring stock spanned from western Norway 94
to eastern Iceland prior to the stock collapse in the 1960’s (Jakobsson and Østvedt 95
1999). The migration patterns of the Icelandic and Norwegian herring stocks changed 96
following the collapse and remained closer to each country’s coast (Jakobsson and 97
Stefánsson 1999, Kvamme et al. 2003). Photo-identification studies dating to the 98
1980’s show no matches between Iceland and Norway (Sigurjónsson et al. 1988, 99
Foote et al. 2009a), suggesting that if killer whales migrated between those two 100
locations in the past, there is currently little to no interaction between these 101
populations. Nevertheless, some Icelandic killer whales have been re-identified as far 102
east as Shetland (Foote et al. 2009a), showing that the movements of some 103
individuals do extend beyond coastal waters. The suggested historic contact of killer 104
whales between Iceland and Norway may have influenced their acoustic repertoire. 105
However, comparisons of their pulsed call type repertoire have found apparently little 106
repertoire sharing between the two locations (Moore et al. 1988, Strager 1995, 107
Stenersen and Similä 2004, Shamir et al. 2014). If killer whales in Iceland and 108
Norway were in contact in the past and their acoustic repertoires were similar, it is 109
possible that sufficient time has passed for call repertoires to have diverged - 110
explaining the pattern observed today. We might then expect that other signals 111
produced by these whales may also show divergence. A divergent call repertoire may 112
serve as a population-identifier, however, the extent of stereotypy and geographic 113
variation in other signals is little understood. 114
For Peer Review
High-frequency whistles ranging up to 75 kHz were first reported from herring-115
eating Northeast Atlantic killer whales (Samarra et al. 2010). High-frequency whistles 116
have since been described from killer whale recordings made in the North Pacific 117
(referred to as ‘high-frequency modulated signals’ and ‘ultrasonic whistles’; Simonis 118
et al. 2012, Filatova et al. 2012) and in the Antarctic (Trickey et al. 2014), indicating
119
that this is a widespread sound type produced by several populations although they do 120
not appear to be ubiquitous (Samarra et al. 2010, Filatova et al. 2012). In the North 121
Pacific, whistles were consistently downsweeps and, in some cases, highly 122
stereotyped (Simonis et al. 2012, Filatova et al. 2012). Here, we analyze qualitatively 123
and quantitatively the variation in time-frequency contours of high-frequency whistles 124
recorded from herring-eating killer whales in Norway and Iceland, and compare them 125
to stereotyped high-frequency whistles recorded in the North Pacific. Our objectives 126
were: 1) to investigate the degree of micro and macro-geographic variation of time-127
frequency parameters and; 2) to investigate whether high-frequency whistles 128
produced by killer whales in Iceland and Norway were also stereotyped and, if so, 129
evaluate the spatial distribution of different whistle types. This study of geographic 130
variation is a starting point to considering the potential function(s) of these poorly 131
understood signals. 132
133
Methods
134
In the Northeast Atlantic, acoustic recordings were collected in Tysfjord, Vestfjord 135
and Ofotfjord (Northern Norway) between 2005 and 2009 and off the Vestmannaeyjar 136
archipelago and the Reykjanes peninsula in 2004, 2008 and 2009 (Iceland, Fig. 1). In 137
both locations, recordings were collected during the day and most sounds were 138
For Peer Review
7
sighted. Recording systems used varied with year and location and included towed 140
and vertical hydrophone arrays, as well as sound recording tags attached to whales 141
using suction cups (“Dtags”; Johnson and Tyack 2003). All systems sampled at 96 or 142
192 kHz (Table 1). Further details of all systems used and data collected are given in 143
Samarra et al. (2010). High-frequency whistles analyzed here are the same as those 144
reported in that study, including whistles with frequency contours at least partially 145
below 48 kHz (up to 48 kHz whistles) and whistles with frequency contours entirely 146
above 48 kHz (>48 kHz whistles), when available. Only 2.6% of whistles at least 147
partially below 48 kHz recorded at 192 kHz sampling rate crossed 48 kHz, i.e. had 148
minimum frequency below 48 kHz and maximum frequency above 48 kHz. This 149
suggests that the lower sampling rate of 96 kHz likely resulted in a negligible loss of 150
whistles with frequency contours at least partially below 48 kHz that could be 151
sampled. High-frequency whistles were defined as signals with contours entirely 152
above 17 kHz (Samarra et al., 2010), as this was the maximum frequency previously 153
reported for killer whale whistles (Thomsen et al. 2001). 154
To compare whistles produced in the Northeast Atlantic with those produced by killer 155
whales in the North Pacific, we analyzed high-frequency whistles described by 156
Simonis et al. (2012). The recordings were collected at sampling rates of 192 or 200 157
kHz from either a ship-based hydrophone array or a high-frequency acoustic 158
recording package (HARP) and were scanned for high-frequency whistles through the 159
use of Long-Term Spectral Averages (LTSAs) (Wiggins and Hildebrand 2007). To 160
date, recordings from 19.9 cumulative years at 18 different sites across the North 161
Pacific have been examined by analysts trained to recognize the presence of these 162
signals (Fig. 1). There have been 19 acoustic encounters of killer whales at 9 different 163
locations that included HFM signals, of which the temporal and spectral 164
For Peer Review
characteristics of a subset from 6 locations are described here. The recording locations 165
of signals described here include: Aleutian Islands, Washington Coast, Southern 166
California Bight, Hoke Seamount, Kauai, and Pearl and Hermes Atoll (Table 1, Fig. 167
1). High-frequency whistles were attributed to killer whales by their clear association 168
with other sounds known to be produced by killer whales or by visual observations of 169
killer whales present in the area (Simonis et al. 2012). To ensure the data sets from 170
the two ocean basins were comparable we only used signals detected in the North 171
Pacific where contours were also entirely above 17 kHz. Table 1 shows the total 172
number of whistles analyzed from each location. We pooled all data from the North 173
Pacific for subsequent analyses, as sample sizes were too small to compare each 174
location separately. Following inspection of recordings using Adobe Audition 2.0
175
(Blackmann-Harris window; FFT=2048 and 4096, for 96 kHz and 192 or 200 kHz 176
sampling rates, respectively; 100% window width) whistle contours were traced from 177
visual inspection of the spectrogram using a peaks contour extraction algorithm as 178
developed by Buck and Tyack (1993; Hann window; frequency resolution=46.875 179
Hz; time resolution=0.667 ms). The following descriptive parameters were measured 180
from the extracted fundamental frequency contour: start, half-way duration point 181
(mid) and end frequency, minimum and maximum frequency, frequency range 182
(maximum-minimum frequency) and duration. 183
All high-frequency whistles were assigned a quality score based on visual 184
assessment of signal to noise ratio and overlap with other sounds, between 1 (poor, 185
when the signal was barely detectable in the spectrogram) and 3 (high, when the full 186
contour was clearly visible). Only clearly visible contours (of quality 3) with 187
sufficient signal-to-noise ratio to extract the measurements required were extracted in 188
For Peer Review
9
were produced by the same group or the same individuals (mean ± stdv [min; max] of 190
number of whistles per recording day: 22.4 ± 22 [1; 95]). Photographs of whales were 191
opportunistically collected while recordings were made in Iceland and Norway. 192
Estimates of group size were not consistently collected across recording sessions in 193
these two locations, but in general varied between 4-15 animals to large aggregations 194
containing 50-100 individuals. Photo-identification was particularly challenging in 195
Norway due to low-light conditions in winter and analysis has not been completed. In 196
Iceland, on average 17 ± 14 [2; 41] individuals were identified per recording session 197
and for those individuals that were resighted at least once (52 of 86) the number of 198
resightings was 4 ± 2 [1; 9]. Recordings in the North Pacific were mostly from a 199
single day in each location, and group sizes were generally not available (Table 1). It 200
was not possible to identify which individuals produced high-frequency whistles 201
recorded in this study, however, it is unlikely that the sampling procedure across 202
different days or across wide geographic areas (such as for the North Pacific data) 203
biased the repeated sampling of a small number of individuals within each location. 204
205
Stereotypy of high-frequency whistles
206
To investigate whether, like pulsed calls, high-frequency whistles fell into stereotyped 207
categories, the data set was categorized using two different methods: 1) visual 208
categorization by human observers as commonly used to identify whistle types and; 2) 209
automated categorization using ARTwarp (Deecke and Janik 2006). 210
211
1) Categorization by a human observer
212
We first conducted visual classification by a human observer using the entire sample 213
of high-frequency whistles to identify differences in the repertoires of different 214
For Peer Review
whistle types across locations. Spectrograms of all whistles were generated in 215
MATLAB (version 7.0.4; spectrogram parameters: FFT=2048 or 4096, for 96 kHz 216
and 192 or 200 kHz sampling rates, respectively; overlap=87.5%; window 217
function=Hann). The observer was blind to the origin of high-frequency whistles 218
being classified. High-frequency whistles seemed to show continuous rather than 219
discrete variation, and as a result were grouped into broad categories (e.g., Azevedo 220
and Van Sluys 2005): upsweeps (rise in frequency with no inflection points), 221
downsweeps (decrease in frequency with no inflection points), ascending-descending 222
(rise in frequency followed by one inflection point and then a decrease in frequency), 223
descending-ascending (decrease in frequency followed by one inflection point and 224
then an increase in frequency), constant (small or no change in frequency and no 225
inflection point), and other (if a contour did not fit any of the previous categories, Fig. 226
2). 227
228
2) Categorization using an automated method
229
To inspect variation at a finer scale, we conducted an independent automated 230
categorization in MATLAB (version 7.11). A subset of the extracted fundamental 231
frequency contours were analyzed by an adaptive resonance theory neural network 232
that uses dynamic time-warping to calculate contour similarity (ARTwarp; Deecke 233
and Janik 2006). Computation time constraints meant that it was impossible to input 234
all extracted contours unless whistles were downsampled, reducing their time 235
resolution. However, downsampling by a factor of 3 resulted in severe 236
misclassification of the data (18 out of 19 categories included misclassified whistles) 237
For Peer Review
11
resolution was used (0.667 ms), but only a subset of randomly chosen whistle 239
contours was categorized. 240
ARTwarp compares the similarity between an input contour and a contour that 241
defines each category (reference contour) to a user-defined similarity value, called the 242
vigilance parameter, to decide how each input contour should be categorized (Deecke 243
and Janik 2006). To find the categorization that would explain most variation in high-244
frequency whistles with the least number of categories, the vigilance parameter was 245
set to values between 0% and 100% in 50 logarithmic steps, and the subset of 246
contours was categorized for each vigilance parameter value. The optimal 247
categorization should have the highest variance ratio, calculated as the ratio of 248
average within-category similarity over average between-category similarity as in 249
Deecke and Janik (2006). This method was adopted because it has successfully 250
classified the signature whistles of bottlenose dolphins and pulsed calls of killer 251
whales (Deecke and Janik 2006). 252
253
Multivariate analysis of variation in time-frequency parameters
254
We conducted a multivariate discriminant function analysis (DFA) to investigate 255
differences between whistles from different locations. All frequency and time 256
parameters were included, except frequency range, as it is already represented by 257
minimum and maximum frequency. We used location as the grouping variable 258
(‘Iceland’, ‘Norway’ or ‘North Pacific’) and used a jackknife cross-validation 259
technique implemented in the lda function of package MASS version 7.3-16 260
(Venables and Ripley 2002) in R 2.11.1 for Mac OS (R Development Core Team 261
2011). The overall proportion of correct classifications and the proportion of correct 262
classifications by location were calculated. These were compared to the proportion of 263
For Peer Review
by-chance accuracy, calculated as the sum of the squares of all prior probabilities, 264
assumed to be equal for all locations. 265
266
Results
267
We measured the parameters of 985 high-frequency whistles (nIceland = 570;
268
nNorway = 256; nPacific = 159). One of the whistles in our sample (from Norway) was a
269
clear outlier, with duration of 4.2 s, much longer than the majority of remaining 270
whistles and was removed from the analyses. Table 2 presents the descriptive 271
statistics of all contour parameters measured. Duration and frequency range showed 272
the highest coefficients of variation across all locations. All other frequency 273
parameters had much lower coefficients of variation, however variation for Iceland 274
and Norway was consistently larger than variation in the North Pacific. This could be 275
due to the smaller sample size of whistles from the Pacific. However, in the North 276
Atlantic very high-frequency whistles were recorded that likely explain the larger 277
coefficients of variation observed here. There was a clear gap in the distribution of 278
frequency parameters between whistles with fundamental contours up to 48 kHz and 279
whistles with fundamental frequency contours entirely above 48 kHz (Fig. 3). 280
Whistles with contours entirely above 48 kHz were recorded in a small number of 281
encounters (nIceland = 4; nNorway = 2). They appeared as clear outliers in the
282
distributions and were thus removed from the comparisons of parameter distributions 283
(Fig. 3). 284
There was considerable overlap between the distributions of some of the contour 285
parameters from Iceland and Norway (Fig. 3). To compare these parameters across 286
locations, we employed a Mann-Whitney U test, due to the non-normality of most 287
For Peer Review
13
the North Pacific with p=0.09). We used Bonferroni correction to adjust the 289
significance level to account for multiple comparisons (0.05/21=0.002). Despite the 290
apparent overlap, comparisons between the parameter distributions from Iceland and 291
Norway revealed significant differences in end frequency (Mann-Whitney U test: 292
W=74148; P=0.0004), frequency range (Mann-Whitney U test: W=81867; P<0.0001) 293
and maximum frequency (Mann-Whitney U test: W=74203; P=0.0003). End 294
frequency and maximum frequency were significantly correlated within the two 295
locations (Pearson correlation; Iceland: end vs. maximum frequency: r=0.96, 296
P<0.001; Norway: end vs. maximum frequency: r=0.98, P<0.001), which likely 297
reflects a whistle upsweep shape. Whistles recorded in the North Pacific tended to 298
have lower start, mid, end, minimum, and maximum frequencies, a slightly longer 299
duration and a greater frequency range. The start frequency was not significantly 300
different between Iceland and the Pacific (Mann-Whitney U test: W=49578; 301
P=0.008), while all other parameters were (P-values<0.0001). All parameters were 302
also significantly different between the North Pacific and Norway, with the exception 303
of duration (Mann-Whitney U test: W=16777; P=0.11). 304
305
Categorization by a human observer
306
The visual classification of whistles showed that in Iceland the majority of 307
whistles were upsweeps, followed by descending-ascending whistle types, while in 308
Norway, upsweeps and descending-ascending whistles were equally common (Table 309
3). Overall, the different whistle types recorded from Norway and Iceland largely 310
resembled each other in spectral and temporal characteristics (Fig. 2), in agreement 311
with the similarities suggested by the overlapping parameter distributions. In contrast, 312
whistles from the North Pacific were all downsweeps, with only one whistle being 313
For Peer Review
classified as ‘Other’. These clear differences in repertoire correspond to the 314
differences in extracted frequency parameters (above). Nevertheless, the simple 315
structure of downsweeps recorded in the North Pacific was similar to that of the few 316
downsweeps recorded in the Northeast Atlantic (Fig. 2). 317
318
Categorization using an automated method
319
An assessment of the geographic variation of whistles was also completed using 320
50 randomly chosen whistles from each location. The results of the ARTwarp 321
categorization showed that an increase in the vigilance parameter resulted in an 322
increase in the number of categories generated. The chosen categorization divided the 323
150 high-frequency whistles into 27 categories, containing between 1 and 18 contours 324
(mean ± standard deviation of contours in each category: 6 ± 4.6). This categorization 325
corresponded to the local maximum in variance ratio achieved when the vigilance 326
parameter was 95.6%. All but five categories included more than one whistle. Of the 327
five categories containing only one whistle one category contained one whistle from 328
the Pacific, two categories contained single whistles from Norway, and two categories 329
contained single whistles from Iceland. Of the 22 categories with more than one 330
whistle, five included only high-frequency whistles from the Pacific. The remaining 331
high-frequency whistles from the Pacific were grouped into three more categories that 332
also included whistles from Norway: two categories containing only two whistles 333
(one from the Pacific and one from Norway) and; one category including 17 whistles 334
from the Pacific and one whistle from Norway. All remaining categories included 335
whistles from both Norway and Iceland. 336
For Peer Review
15
Multivariate analysis of variation in time-frequency parameters
338
The multivariate DFA showed high macrogeographic variation between the 339
Northeast Atlantic and North Pacific groups, with the first discriminant function 340
accounting for 98.9% of between group variability. The loadings of the first 341
discriminant function revealed that duration, maximum frequency, and end frequency 342
were the main discriminating predictors (Loadings: duration = -2.81; maximum 343
frequency = 0.33; end frequency = -0.46). The cross-validated classification showed 344
an overall correct classification of 62.4% of whistles to the correct location, compared 345
to a by-chance proportion of 33.3%, calculated as the sum of the squares of all prior 346
probabilities. Correct classification scores per location revealed that the North Pacific 347
was the location with the highest score (95.0%), with only 8 of its 159 whistles 348
misclassified as being from Norway. Lower correct classification scores (63.9% and 349
52.4%) were achieved for whistles from Norway and Iceland, respectively. Most 350
misclassifications for Norway (77 of 84) were assigned to Iceland and conversely, 351
most misclassifications for Iceland (254 of 261) were assigned to Norway. The 352
remaining 7 misclassifications from each location were assigned to the North Pacific. 353
Figure 4 shows the first two discriminant functions and illustrates how the first 354
discriminant function achieved the most discrimination between locations, with 355
whistles from the North Pacific being clearly different from those recorded in the 356
Northeast Atlantic, while whistles from Norway and Iceland overlapped to a much 357
greater extent. However, at high values of the second discriminant function there was 358
little overlap between Iceland and Norway (Fig. 4). Inspection of these whistles 359
revealed that these have high frequency range and possibly are driving observed 360
statistically significant differences in this parameter between locations. 361
For Peer Review
To investigate whether discrimination between Iceland and Norway was more 362
apparent within whistle types, discriminant function analyses were carried out for the 363
two most common whistle types (upsweeps and descending-ascending) at these 364
locations. Descending-ascending whistles were correctly classified at rates of 60% 365
and 66.7% for Iceland and Norway, respectively. Overall correct classification was of 366
62.7%, compared to a by-chance proportion of 50%, suggesting a slight improvement 367
in classification when using this whistle type, but still considerable similarity between 368
locations. The overlap in the distribution of the discriminant scores resulting from the 369
first discriminant function is presented in Figure 5, illustrating how the discrimination 370
between these two locations was poor. Correct classification of upsweeps was 58.7% 371
and 58.5% for Iceland and Norway, respectively. For upsweeps, overall correct 372
classification was 58.6%, compared to a by-chance proportion of 50%, which also 373
suggests an overlap in the discriminant scores within this type (Fig. 5). 374
375
Discussion
376
We found clear macrogeographic variation between high-frequency whistles 377
recorded in the North Pacific and the Northeast Atlantic, while within the Northeast 378
Atlantic only subtle microgeographic variation was observed. In all locations whistles 379
could be manually classified into broad stereotyped categories, but the diversity of 380
whistle types identified varied between ocean basins. While the majority of whistles 381
recorded in the North Pacific consisted of only one whistle type, the Northeast 382
Atlantic repertoires included more types and the repertoires were similar between 383
locations. In all locations the within-location variation in most frequency parameters 384
was small in comparison to variation in frequency range and duration. It is possible 385
For Peer Review
17
under which recordings were collected. Nevertheless, in other delphinids intra-387
specific variation in frequency parameters was generally low, while variation in 388
whistle duration tended to be comparatively higher (e.g., Ding et al. 1995b, Morisaka 389
et al. 2005). It is possible that frequency parameters are constrained by morphology,
390
while the variability of whistle duration may be related to social and non-social 391
behavior or environmental factors, or random individual variation (e.g., May-Collado 392
and Wartzok 2008). 393
394
Macrogeographic variation in high-frequency whistles
395
Within the North Pacific, acoustic encounters of killer whales were not common at 396
any of the recording sites, and high-frequency whistles were infrequently observed. 397
There was broad similarity in the recorded whistles despite the considerable 398
geographic range covered by the recordings. The consistency in whistle type 399
(downsweeps) and similarities in frequency characteristics to those reported by 400
Filatova et al. (2012) suggests that within the Pacific Ocean there may be little 401
variability in high-frequency whistles. However, not all populations appear to produce 402
these signals; both Northeast Pacific resident and transient killer whales apparently do 403
not produce high-frequency whistles (Samarra et al. 2010, Filatova et al. 2012) but 404
the ecotypes of those whales that do produce them in the North Pacific remain largely 405
unknown, with the exception of North Pacific offshores (Simonis et al. 2012, Filatova 406
et al. 2012). While Pacific offshore, resident and Northeast Atlantic killer whales are
407
all closely related genetically (Morin et al. 2010), it is curious that Pacific resident 408
killer whales have not been recorded using the signals shared by their nearest 409
relatives. In contrast to the apparent similarity within the Pacific Ocean, there were 410
clear differences between whistles recorded in the Pacific and Atlantic Ocean basins. 411
For Peer Review
Whistles recorded in the North Pacific had consistently lower frequency 412
parameters, while frequency range was significantly higher in the North Pacific than 413
in either of the Northeast Atlantic populations. Differences in duration were less 414
pronounced and significant differences were only detected in comparison to Iceland. 415
The discriminant function analysis was able to correctly classify the vast majority of 416
whistles from the North Pacific, assigning duration and maximum and end frequency 417
as main discriminating predictors. Whistle types identified were also considerably 418
different between ocean basins; while downsweeps were the most common whistle 419
type in the North Pacific, this whistle type was uncommon in the Northeast Atlantic. 420
The automated categorization also grouped most whistles from the Pacific into 421
distinct categories. This divergence in whistle types will likely influence some of the 422
observed differences in frequency parameters particularly the start, mid and end 423
frequency but does not explain differences in minimum and maximum frequencies, 424
which should not be affected by whistle shape. Thus, we believe that the observed 425
differences in frequency parameters between ocean basins are not exclusively due to 426
differences in whistle type usage but reflect a real divergence in the whistle frequency 427
produced. 428
Divergence in frequency at macrogeographic scales could reflect divergence in 429
geographically isolated populations that could originate from a wide range of genetic 430
and social mechanisms. Indeed genetic data suggests considerable variation between 431
populations in the Atlantic and the Pacific in comparison to variation between Iceland 432
and Norway (Morin et al. 2010, Foote et al., 2011). Differences in the acoustic 433
environment, such as background noise or transmission properties (e.g., Morisaka et
434
al. 2005, May-Collado and Wartzok 2008), have also been proposed as factors 435
For Peer Review
19
ocean basins recordings were collected over wide geographic areas, and we therefore 437
cannot identify large and consistent habitat differences that could clearly explain the 438
patterns of variation observed in this study. Body size, however, is known to vary 439
between the two ocean basins; killer whales in the Northeast Atlantic in general have 440
smaller body sizes than killer whales in the Northeast Pacific (Christensen 1984, 441
Stenersen and Similä 2006), but Northeast Pacific offshores have smaller body size 442
than resident and transient killer whales (Ford et al. 2000, Dahlheim et al. 2008). 443
Nevertheless, we cannot exclude the possibility that divergence in frequency 444
characteristics between these ocean basins may be related to morphological 445
constraints. The reasons behind the consistent production of downsweeps in the North 446
Pacific in contrast to the more variable repertoires recorded in the Northeast Atlantic 447
are unknown. Although intriguing, to fully understand the reasons behind variations 448
in frequency and usage of whistle types across ocean basins more effort is required to 449
record killer whales with adequate sampling rates in other locations. This will reveal 450
the extent of the consistent downsweep repertoire across the North Pacific or the 451
existence of variable repertoires in other ocean basins as well as how frequency 452
characteristics may vary in other habitats. 453
454
Microgeographic variation in high-frequency whistles
455
Within the Northeast Atlantic, we found similarities in the repertoire and 456
characteristics of high-frequency whistles produced by killer whales in Norway and 457
Iceland. None of the quantitative methods employed was able to distinguish between 458
whistles from Iceland and Norway as clearly as between whistles from Northeast 459
Atlantic and North Pacific, suggesting different levels of divergence between 460
locations. Despite the apparent overlap in parameter distributions in the Northeast 461
For Peer Review
Atlantic, whistles from Norway showed significantly lower end frequency, maximum 462
frequency and frequency range when compared to Iceland. The discriminant function 463
analysis showed some degree of correct classifications, although many whistles from 464
both locations were misclassified, while the automated categorization included 465
whistles from both locations in most of the categories generated. Although the overall 466
repertoire was similar between the two locations, there were some differences in the 467
usage of whistle types. Upsweeps were the most common whistle type in Iceland, 468
while in Norway both upsweeps and descending-ascending whistles were equally 469
common. Even when trying to discriminate between locations within whistles of the 470
same type, discriminant function analyses still misclassified a large proportion of 471
whistles, suggesting similarity between whistles produced. The similarity in both 472
time-frequency parameters and overall repertoire of high-frequency whistles between 473
Norway and Iceland is in striking contrast to the divergence in pulsed call repertoires 474
(Moore et al. 1988, Strager 1995, Stenersen and Similä 2004, Shamir et al. 2014). At 475
present we have little evidence of contextual production of high-frequency whistles to 476
help us identify their function. Nevertheless, this divergence between pulsed calls and 477
high-frequency whistles possibly reflects different functions of these different signal 478
types. 479
Microgeographic variation in acoustic signals may be shaped by genealogy, the 480
timing of separation, ranging behavior of individuals, or cultural divergence in the 481
case of learned acoustic signals (e.g., Ding et al. 1995b, Azevedo and Van Sluys 482
2005, Papale et al. 2013). For killer whales in Norway and Iceland evidence for (a 483
recent) common ancestor comes from historic ranging patterns of prey, genetics 484
(Jonsgård and Lyshoel 1970, Foote et al. 2009a), and high-frequency whistle 485
For Peer Review
21
recent divergence (Moore et al. 1988, Strager 1995, Stenersen and Similä 2004, 487
Shamir et al. 2014). A small number of high-frequency whistles have also been 488
recorded from killer whales in Shetland (Samarra et al. 2010), an archipelago situated 489
between Iceland and Norway where some Icelandic killer whales are known to travel 490
(Foote et al. 2009a). Further recordings from this location and others should provide 491
an interesting comparison to evaluate the degree of divergence between adjacent 492
populations. Although the function(s) of these high-frequency whistles remain 493
unclear, the signals analyzed in this study offer a window to understanding how 494
acoustic behavior may relate to ancestry and dispersal patterns of killer whale 495
populations on multiple scales. 496
497
For Peer Review
Acknowledgments498
We would like to thank the many people who were involved in the fieldwork and 499
Woods Hole Oceanographic Institution, especially A. Bocconcelli, M.P. Johnson, and 500
P.L. Tyack for support with tagging projects. Part of the Atlantic data was collected as 501
part of the 3S collaborative research program, and 2005 data were collected in 502
collaboration with A. D. Shapiro. We would like to thank the International Fund for 503
AnimalWelfare/The Song of the Whale Team, particularly C. Lacey, for providing 504
recordings from Iceland 2004. Funding for HARP data collection and analysis was 505
provided by the Office of Naval Research, US Navy Living Marine Resources 506
(former CNO-N45), US Pacific Fleet, Pacific Life, Ocean Foundation. We would like 507
to thank S. Baumann-Pickering, R. Gottlieb, S. Wiggins and J. Hildebrand from 508
Scripps Institution of Oceanography for fieldwork, data processing, data analysis and 509
assistance. The Pacific Islands Fishery Science Center (PIFSC) supplied recordings 510
from Kauai and the Pearl and Hermes Atoll under a permit from the 511
Papahanaumokuakea Marine National Monument, number PMNM-2010-041 issued 512
to E. Oleson. We would specifically like to thank C. Yoshinaga for managing the 513
deployment and recovery of instruments in these remote locations. We are grateful to 514
S. Kuningas for providing the photo-identification information from Norway and P. 515
Wensveen for providing helpful comments on the manuscript. Funding was provided 516
by Fundação para a Ciência e a Tecnologia studentship to F.I.P.S. (grant 517
SFRH/BD/30303/2006), Office of Naval Research and Russell Trust Award (U. St 518
Andrews). All field research was carried in compliance with local regulations. This 519
manuscript was improved by helpful comments from the editors and anonymous 520
reviewers. 521
For Peer Review
23
Literature cited
523
Azevedo, A. F. and M. Van Sluys. 2005. Whistles of tucuxi dolphins (Sotalia
524
fluviatilis) in Brazil: comparisons among populations. Journal of the Acoustical
525
Society of America 117:1456-1464. 526
Baron, S. C., A. Martinez, L. P. Garrison and E. O. Keith. 2008. Differences in 527
acoustic signals from delphinids in the western North Atlantic and northern Gulf 528
of Mexico. Marine Mammal Science, 24(1): 42-56. 529
Buck, J. R. and P. L. Tyack. 1993. A quantitative measure of similarity for Tursiops
530
truncatus signature whistles. Journal of the Acoustical Society of America
531
94:2497-2506. 532
Caldwell, M. C. and D. K. Caldwell. 1968. Vocalization of naïve dolphins in small 533
groups. Science 159:1121-1123. 534
Camargo, F. S., M. M. Rollo, V. Giampaoli and C. Bellini. 2006. Whistle variability 535
in South Atlantic spinner dolphins from the Fernando de Noronha Archipelago 536
off Brazil. Journal of the Acoustical Society of America 120(6):4071-4079. 537
Christensen, I. 1984. Growth and reproduction of killer whales, Orcinus orca, in 538
Norwegian coastal waters. Report of the International Whaling Commission 539
6:253-258. 540
Dahlheim, M. E., Schulman-Janiger, A., Black, N., Ternullo, R., Ellifrit, D. and K. C. 541
Balcomb. 2008. Eastern temperate North Pacific offshore killer whales (Orcinus
542
orca): occurrence, movements, and insights into feeding ecology. Marine 543
Mammal Science 24(3):719-729. 544
Deecke, V. B. and V. M. Janik. 2006. Automated categorization of bioacoustic 545
signals: Avoiding perceptual pitfalls. Journal of the Acoustical Society of 546
America 119:645-653. 547
For Peer Review
Deecke, V.B., L. G. Barrett-Lennard, P. Spong and J. K. B. Ford. 2010. The structure 548
of stereotyped calls reflects kinship and social affiliation in resident killer whales 549
(Orcinus orca). Naturwissenschaften 97:513–518.
550
Ding, W., B. Würsig and W. Evans. 1995a. Comparisons of whistles among seven 551
odontocete species. Pages 299-323 in R. A. Kastelein, J. A. Thomas and P. E. 552
Nachtigall, eds. Sensory systems of aquatic mammals. De Spil Publishers, 553
Woerden, The Netherlands. 554
Ding, W., B. Würsig and W. E. Evans. 1995b. Whistles of bottlenose dolphins: 555
comparisons among populations. Aquatic Mammals 21.1:65-77. 556
Filatova, O.A., J. K. B. Ford, C. O. Matkin, L. G. Barrett-Lennard, A. M. Burdin and 557
E. Hoyt. 2012. Ultrasonic whistles of killer whales (Orcinus orca) recorded in the 558
North Pacific (L). Journal of the Acoustical Society of America 132:3618-3621. 559
Ford, J. K. B. and H. D. Fisher. 1982. Killer whale (Orcinus orca) dialects as an 560
indicator of stocks in British Columbia. Reports of the International Whaling 561
Commission 32:671-679. 562
Ford, J. K. B. 1989. Acoustic behavior of resident killer whales (Orcinus orca) off 563
Vancouver Island, British Columbia. Canandian Journal of Zoology 67, 727-745. 564
Ford, J. K. B.1991. Vocal traditions among resident killer whales (Orcinus orca) in 565
coastal waters of British Columbia. Canadian Journal of Zoology69:1454-1483. 566
Ford, J. K. B., Ellis, G. M. and K. C. Balcomb. 2000. Killer whales: the natural 567
history and genealogy of Orcinus orca in British Columbia and Washington. 568
Second Edition. Vancouver: University of British Columbia Press. 569
Foote, A. D., T. Similä, G. A. Víkingsson and P. T. Stevick. 2009a. Movement, site 570
fidelity and connectivity in a top marine predator, the killer whale. Evolutionary 571
For Peer Review
25
Foote, A. D., J. Newton, S. B. Piertney, E. Willerslev and M. T. P. Gilbert. 2009b. 573
Ecological, morphological and genetic divergence of sympatric North Atlantic 574
killer whale populations. Molecular Ecology 18:5207-5217. 575
Foote, A. D., J. T. Vilstrup, R. de Stephanis, et al. 2011. Generic differentiation 576
among North Atlantic killer whale populations. Molecular Ecology 20(3):629-577
641. 578
Jakobsson, J. and O. J. Østvedt. 1999. A review of joint investigations on the 579
distribution of herring in the Norwegian and Iceland Seas 1950-1970. Rit 580
Fiskideildar 16:209-238. 581
Jakobsson, J. and G. Stefánsson. 1999. Management of summer-spawning herring off 582
Iceland. ICES Journal of Marine Science 56:827-833. 583
Janik, V. M., L. S. Sayigh and R. S. Wells. 2006. Signature whistle shape conveys 584
identity information to bottlenose dolphins. Proceedings of the National Academy 585
of Sciences 103:8293-8297. 586
Janik, V. M. 2009. Acoustic communication in delphinids. Advances in the Study of 587
Behavior 40:123-157. 588
Johnson, M. P. and P. L. Tyack. 2003. A digital acoustic recording tag for measuring 589
the response of wild marine mammals to sound. IEEE Journal of Oceanic 590
Engineering 28:3-12. 591
Jonsgård, Å. And P. B. Lyshoel. 1970. A contribution to the knowledge of the biology 592
of the killer whale Orcinus orca (L.). Nytt Magasin for Zoologi 18:41-48. 593
Kvamme, C., L. Nøttestad, A. Fernö, et al. 2003. Migration patterns in Norwegian 594
spring-spawning herring: why young fish swim away from the wintering area in 595
late summer. Marine Ecology Progress Series 247:197-210. 596
For Peer Review
May-Collado, L. J. and D. Wartzok. 2008. A comparison of bottlenose dolphin 597
whistles in the Atlantic Ocean: factors promoting whistle variation. Journal of 598
Mammalogy 89(5):1229-1240. 599
Matthews, J. N., L. E. Rendell, J. C. D. Gordon and D. W. Macdonald. 1999. A 600
review of frequency and time parameters of cetacean tonal calls. Bioacoustics 601
10:47-71. 602
Miller, P. J. O. and D. E. Bain. 2000. Within-pod variation in the sound production of 603
a pod of killer whales, Orcinus orca. Animal Behaviour 60:617-628. 604
Moore, S. E., J. K. Francine, A. E. Bowles and J. K. B. Ford. 1988. Analysis of calls 605
of killer whales, Orcinus orca, from Iceland and Norway. Rit Fiskideildar 606
11:225-250. 607
Morin, P. A., F. I. Archer, A. D. Foote, et al. 2010. Complete mitochondrial genome 608
phylogeographic analysis of killer whales (Orcinus orca) indicates multiple 609
species. Genome Research 20:908-916. 610
Morisaka, T., M. Shinohara, F. Nakahara and T. Akamatsu. 2005. Geographic 611
variations in the whistles among three Indo-Pacific bottlenose dolphin Tursiops
612
aduncus populations in Japan. Fisheries Science 71:568-576.
613
Mundinger, P. C. 1982. Microgeographic and macrogeographic variation in the 614
acquired vocalizations of birds. Pages 147-208 in D. E. Kroodsma, E. H. Miller, 615
and H. Ouellet, eds. Acoustic Communication in Birds: Song learning and its 616
consequences. Vol. 2, Academic Press, New York, NY. 617
Nousek, A. E., P. J. B. Slater, C. Wang and P. J. O. Miller. 2006. The influence of 618
social affiliation on individual vocal signatures of northern resident killer whales 619
(Orcinus orca). Biology Letters 2:481-484.
For Peer Review
27
Papale, E., M. Azzolin, I. Cascão, et al. (2014). Macro- and micro-geographic 621
variation of short-beaked common dolphin’s whistles in the Mediterranean Sea 622
and Atlantic Ocean. Ethology, Ecology and Evolution 26:392-404. 623
Podos, J., V. M. F. da Silva and M. R. Rossi-Santos. 2002. Vocalizations of Amazon 624
river dolphins, Inia geoffrensis: insights into the evolutionary origins of delphinid 625
whistles. Ethology 108:601-612. 626
R Development Core Team. 2011. R: A language and environment for statistical 627
computing. R Foundation for Statistical Computing, Vienna, Austria. ISBN 3-628
900051-07-0, URL http://www.R-project.org/. 629
Rendell, L E., J. N. Matthews, A. Gill, J. C. D. Gordon and D. W. Macdonald. 1999. 630
Quantitative analysis of tonal calls from five odontocete species, examining 631
interspecific and intraspecific variation. Journal of Zoology 249:403-410. 632
Riesch, R., J. K. B. Ford and F. Thomsen. 2006. Stability and group specificity of 633
stereotyped whistles in resident killer whales, Orcinus orca, off British Columbia. 634
Animal Behaviour 71:79-91. 635
Riesch, R., J. K. B. Ford and F. Thomsen. 2008. Whistle sequences in wild killer 636
whales (Orcinus orca). Journal of the Acoustical Society of America 124:1822-637
1829. 638
Riesch, R. and V. B. Deecke. 2011. Whistle communication in mammal-eating killer 639
whales (Orcinus orca): further evidence for acoustic divergence between 640
ecotypes. Behavioral Ecology and Sociobiology 65:1377-1387. 641
Rossi-Santos, M. R. and J. Podos. 2006. Latitudinal variation in whistle structure of 642
the estuarine dolphin Sotalia guianensis. Behaviour 143:347-364. 643
For Peer Review
Samarra, F. I. P., V. B. Deecke, K. Vinding, M. H. Rasmussen, R. J. Swift and P. J. 644
O. Miller. 2010: Killer whales (Orcinus orca) produce ultrasonic whistles. Journal 645
of the Acoustical Society of America 128:EL205-EL210. 646
Sigurjónsson, J., T. Lyrholm, S. Leatherwood, E. Jónsson and G. Víkingsson. 1988. 647
Photoidentification of killer whales, Orcinus orca, off Iceland, 1981 through 648
1986. Rit Fiskideildar 11:99-114. 649
Similä, T., J. C. Holst and I. Christensen. 1996. Occurrence and diet of killer whales 650
in northern Norway: seasonal patterns relative to the distribution and abundance 651
of Norwegian spring-spawning herring. Canadian Journal of Fisheries and 652
Aquatic Sciences 53:769-779. 653
Simon, M., P. K. McGregor and F. Ugarte. 2007. The relationship between the 654
acoustic behaviour and surface activity of killer whales (Orcinus orca) that feed 655
on herring (Clupea harengus). Acta Ethologica 10:47-53. 656
Simonis, A. E., S. Baumann-Pickering, E. Oleson, M. L. Melcón, M. Gassmann, S. 657
M. Wiggins and J. A. Hildebrand. 2012. High-frequency modulated signals of 658
killer whales (Orcinus orca) in the North Pacific. Journal of the Acoustical 659
Society of America 131:EL295-EL301. 660
Shamir, L., C. Yerby, R. Simpson, A. M. von Benda-Beckmann, P. Tyack, F. 661
Samarra, P. Miller and J. Wallin. 2014. Classification of large acoustic datasets 662
using machine learning and crowdsourcing: application to whale calls. Journal of 663
the Acoustical Society of America, 135(2):953-962. 664
Steiner, W. W. 1981. Species-specific differences in pure tonal whistle vocalizations 665
of five Western North Atlantic dolphin species. Behavioral Ecology and 666
For Peer Review
29
Stenersen, J. and T. Similä. 2004. Norwegian killer whales. Henningsvær: Tringa 668
Forlag. 669
Strager, H. 1995. Pod-specific call repertoires and compound calls of killer whales, 670
Orcinus orca, Linnaeus, 1758, in the waters of northern Norway. Canadian
671
Journal of Zoology 73:1037-1047. 672
Thomsen, F., D. Franck and J. K. B. Ford. 2001. Characteristics of whistles from the 673
acoustic repertoire of resident killer whales (Orcinus orca) off Vancouver Island, 674
British Columbia. Journal of the Acoustical Society of America 109:1240-1246. 675
Thomsen, F., D. Franck and J. K. B. Ford. 2002. On the communicative significance 676
of whistles in wild killer whales (Orcinus orca). Naturwissenschaften 89:404-407. 677
Trickey, J. S., M. V. R. Reyes, S. Baumann-Pickering, M. L. Melcón, J. A. 678
Hildebrand and M. A. Iñíguez. 2014. Acoustic encounters of killer and beaked 679
whales during the 2014 SORP cruise. IWC report SC/65b/SM12. 680
Tyack, P. 1986. Population Biology, Social behavior and communication in whales 681
and dolphins. Trends in Ecology and Evolution 1:144-150. 682
Van Parijs, S. M. and P. J. Corkeron. 2001. Vocalizations and behaviour of Pacific 683
humpback dolphins Sousa chinensis. Ethology 107:701-716. 684
Venables, W. N. and B. D. Ripley. 2002. Modern applied statistics with S. Fourth 685
Edition. Springer, New York. NY. 686
Wiggins, S. M. and J. A. Hildebrand. 2007. High-frequency acoustic recording 687
package (HARP) for broad-band, long-term marine mammal monitoring. Pages 688
551-557 in International Symposium on Underwater Technology and Workshop 689
on Scientific Use of Submarine Cables and Related Technologies (2007). 690
For Peer Review
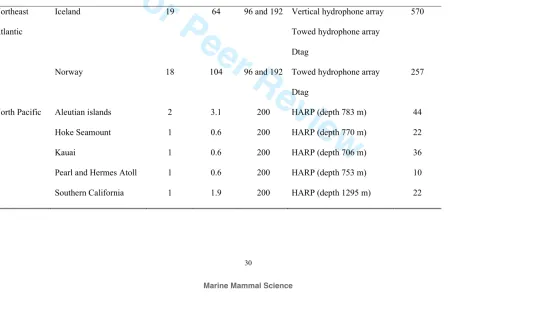
Table 1. Specifications of recordings containing high-frequency whistles analyzed in this study (further details are given in Samarra et al. 2010
691
and Simonis et al. 2012).
692
Ocean
basin
Location Recording
days
Recording
time (h)
Sampling
rate (kHz)
Recording method Whistles
analyzed
Northeast
Atlantic
Iceland 19 64 96 and 192 Vertical hydrophone array
Towed hydrophone array
Dtag
570
Norway 18 104 96 and 192 Towed hydrophone array
Dtag
257
North Pacific Aleutian islands 2 3.1 200 HARP (depth 783 m) 44
Hoke Seamount 1 0.6 200 HARP (depth 770 m) 22
Kauai 1 0.6 200 HARP (depth 706 m) 36
Pearl and Hermes Atoll 1 0.6 200 HARP (depth 753 m) 10
For Peer Review
31 Bight
Southern California
Bight
1 0.5 200 Ship-based hydrophone
array
11
Washington Coast 1 0.7 192 Ship-based hydrophone
array
14
693
694
For Peer Review
Table 2. Descriptive statistics of high-frequency whistles analyzed in this study. 695
Sample sizes for each location are included in brackets. For each parameter, values 696
given are mean ± standard deviation [minimum – maximum], with coefficient of 697
variation (calculated as the ratio of the standard deviation to the mean) given as a 698
percentage within brackets. All frequency parameters are presented in kHz and 699
duration is presented in milliseconds (ms). 700
Location Iceland
(n=570)
Norway
(n=256)
North Pacific
(n = 159)
Start frequency 32.6 ± 9.1
(27.9%)
[16.9 – 71.2]
34.7 ± 11.0
(31.7%)
[18.3 – 71.0]
29.6 ± 5.1
(17.2%)
[19.3 – 44.0]
End frequency 38.2 ± 8.7
(22.8%)
[19.4 – 74.7]
37.4 ± 9.0
(24.1%)
[21.5 – 68.3]
20.8 ± 3.2
(15.4%)
[17.1 – 33.4]
Mid frequency 33.8 ± 8.6
(25.4%)
[17.6 – 68.8]
34.6 ± 9.6
(27.7%)
[19.0 - 64.3]
25.3 ± 4.3
(16.9%)
[18.4 – 39.4]
Minimum
frequency
31.7 ± 8.6
(27.1%)
[16.9 - 68.3]
33.0 ± 9.2
(27.9%)
[18.1 – 64.3]
20.8 ± 3.2
(15.3%)
[17.1 – 33.4]
Maximum
frequency
38.4 ± 8.7
(22.7%)
[19.4 – 74.7]
38.4 ± 10.2
(26.6%)
[22.3 – 71.0]
29.7 ± 5.1
(17.1%)
[19.3 – 44.0]
Frequency range 6.8 ± 3.7
(54.4%)
5.4 ± 2.9
(53.7%)
8.9 ± 3.8
For Peer Review
33
[0.7 – 21.2] [1.0 – 19.9] [1.6 – 20.2]
Duration 138.1 ± 135.9
(98.4%)
[6 - 814]
143.6 ± 143.1
(99.7%)
[10 - 1300]
142.6 ± 74.2
(52.1%)
[37.8 – 371.2]
701
702
For Peer Review
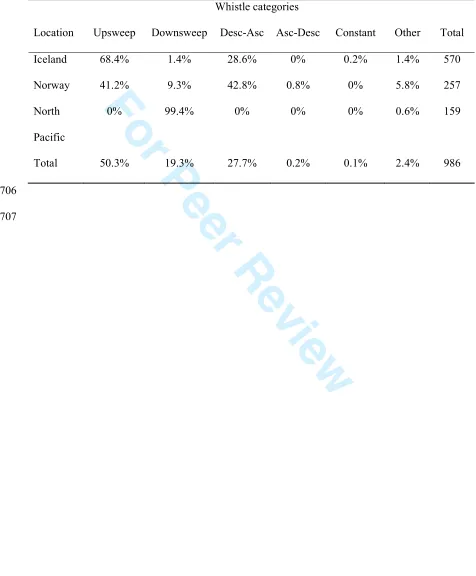
Table 3. Proportion of high-frequency whistle types produced in different locations. 703
Desc-Asc stands for descending-ascending and Asc-Desc stands for ascending-704
descending whistles. 705
Whistle categories
Location Upsweep Downsweep Desc-Asc Asc-Desc Constant Other Total
Iceland 68.4% 1.4% 28.6% 0% 0.2% 1.4% 570
Norway 41.2% 9.3% 42.8% 0.8% 0% 5.8% 257
North
Pacific
0% 99.4% 0% 0% 0% 0.6% 159
Total 50.3% 19.3% 27.7% 0.2% 0.1% 2.4% 986
706
For Peer Review
35
Figure captions
708
Figure 1. Map illustrating the approximate locations (stars) where recordings 709
containing high-frequency whistles were collected in: top) the Northeast Atlantic and; 710
bottom) the North Pacific. SCB stands for Southern California Bight. Locations where 711
recordings were conducted but no high-frequency whistles were detected are also 712
shown (circles). 713
714
Figure 2. Spectrograms showing examples of different high-frequency whistle types 715
from Iceland, Norway and the North Pacific. If a specific whistle type was only 716
produced in one location only one example was shown. Note the different y-axis 717
scaling for the Constant whistle type. 718
719
Figure 3. Distribution of all frequency parameters extracted from whistle contours. 720
Horizontal lines represent medians, boxes represent inter-quartiles, and whiskers 721
represent values within 1.5 times the inter-quartile range from the boxes. Outliers are 722
plotted as single points. Frequency range is plotted separately due to its different y-723
axis scale, as is duration. 724
725
Figure 4. Plot of the first two discriminant functions for the comparison between 726
whistles recorded in Iceland (I), Norway (N) and the North Pacific (P). Colors follow 727
the same legend as in Figure 2. Note the overlap between whistles from Norway (N) 728
and Iceland (I) in contrast to discrimination between whistles from the NE Atlantic 729
and whistles from the Pacific (P). 730
731
For Peer Review
Figure 5. Boxplots illustrating the distribution of discriminant scores (DF1) for 732
descending-ascending whistles (Desc-Asc) for the two groups (Iceland and Norway) 733
and discriminant scores for upsweep whistles for the two groups. Colors follow the 734
same legend as in Figure 2. 735
For Peer Review
37
Figure 1
737
738
739
For Peer Review
Figure 2740
For Peer Review
39 Figure 3
742
743
For Peer Review
Figure 4744
For Peer Review
41
Figure 5
746
747
-4
-2
0
2
4
DF
1
sc
or
es
Desc-Asc
Upsweeps
Iceland
Norway