Export of cashew kernel from india: its direction and
prediction
K. Padmanaban
1, P. Mishra
1*, P. K. Sahu
1and Y. N. Havaldar
2 1Department of Agricultural Statistics, Bidhan Chandra Krishi Viswavidyalaya, Mohanpur, WB – 741252, India. 2Department of Agricultural Statistics, UAS, Dharwad- 580005, India.*Corresponding author: [email protected]
Paper No. 160 Received: 8 January, 2013 Accepted: 16 December, 2014
Abstract
Cashew is one of the most important dollar earning crops of the country. The quantity of export of cashew kernel had registered a growth of 5.71% per annum. This was made possible both due to increased export to countries of import and changes in composition of India’s cashew kernel exports to various destinations. The paper quantifies the changing structure of cashew kernel exports in order to understand the dynamics of changes and the growth rate analysis. The growth rate analysis reveals that, UAE shows the highest growth rate and the countries like USA, Netherland, UK show the negative growth rates. The markov chain model was used to assess the transition probabilities for the major
cashew
kernel export from India. The result revealed that, the country USA was the highest probability of reduction (0.87) compare to all other countries. The forecasted values for, the countries UAE and ‘other countries’ show the increasing trend and the countries like USA, UK, Netherland, Japan and France show the decreasing trend.Keywords: Probability transition matrix, direction of trade, markov chain analysis, forecasting, cashew kernel
Any crop/commodity which earns valuable foreign exchange is of much importance for the economic growth of the country. Export behaviour and its trend analysis are of much importance from the points of view of countries economy. A no. of studies are there in literature with respect to export and trend analysis on different crops/commodities; among these the studies conducted by Ajjan et al. (1998) on senna and periwinkle, Mandanna et al. (2002) on tobacco export, Sadavatti (2006) on Basmati rice, Umesh et al. (2005) and Velavan (2004) on cashew are few to mention. Cashew, a native of Eastern Brazil introduced to India by Portuguese. Cashew is one of the India’s foreign exchange earners and the second biggest dollar earner (CEPCI, 2012). India is the largest producer and exporter of cashew kernels in the world. Over 65% of the world export of cashew kernels is accounted for by India. India’s share in the world raw nut production accounts to about 25% (Cashew Bulletin, 2010). In India, cashew cultivation
now covers a total area of 0.70 million hectares of land, producing over 0.40 million M.T. of raw cashew nuts annually (CEPCI, 2012).Cashew cultivation is taken up in small and marginal holdings. As more than 70% of the cashew area is under this category, cashew plays an important role in the development of small and marginal farmers in India. Cashew export is engine of employment and it provides employment to about one million workers, 95% of whom are rural women from the under privileged sections of the society (Cashew Bulletin, 2010). Angels
et al (2011) studied the growth rate and direction of trade in production and export of turmeric in India. With changing production, consumption and food habits export of cashew from India is also changing its direction. Thus, for sustainability in export of cashew from India is required to be studied. Forecasting of cashew export is also important in this aspect. As such, this study attempts to examine Publishers
growth, direction and prediction of export of cashew from India.
Methodology
Growth rate analysis
The growth rate of different major countries for import of cashew kernel were computed separately for the (1999-2010) time period by the simple growth rate and compound growth rate analysis.
Simple growth rate
t 1
1
Y Y
SGR%
X100
Y xt
−
=
t
Y
= Value at time ‘t’1
Y
=Initial value
Compound growth rate
t t
Y a.b
=
t
Y
=
dependent variable for which growth rate wasestimated
a = intercept
b= regression coefficient
t = year which takes values 1,2,...,n
Compound growth is calculated as b-1 in percentage
Direction of trade
Kumar et al. (2007) studied the changing direction of export mango from India by using Markov chain approach. The structural change in export was examined using the Markov chain approach. Central to Markov chain analysis is the estimation of the transitional probability matrix P. The elements Pij of the matrix indicates the probability that export will switch from country i to country j with the passage of time. The diagonal Pij measure the probability that the export share of a country will be retained. Hence, an examination of the diagonal elements indicates the loyalty of an importing country to a particular country’s exports.
In the context of the current application, from 1999 to 2010; six major importing countries of cashew kernel were considered. A Markov chain model is a mathematical system that undergoes transitions
Table 1. Export of cashew kernel from India statistics (1999-2010)
Country Mean Variance CV% Minimum Median Max SGR% CGR%
USA 972.4 18849.6 14.12 806.6 963.9 1288.5 -3.08 -0.01
Netherland 321.7 7022.8 26.05 215 309.8 458.1 -4.77 -0.01
UAE 184.3 19449.9 75.65 66.2 125.3 501.6 19.52 0.20
UK 119.22 1147.87 28.42 78.39 112.75 200.41 -6.03 -0.04
Japan 115.13 535.2 20.09 80.34 110.71 156.21 2.10 0.01
France 65.27 443.57 32.27 43.61 60.89 104.1 7.12 0.07
Others 526.6 57265 45.44 277.6 477.5 953.5 10.01 0.13
Total 2305 180671 18.44 1801 2338 2988 1.88 0.04
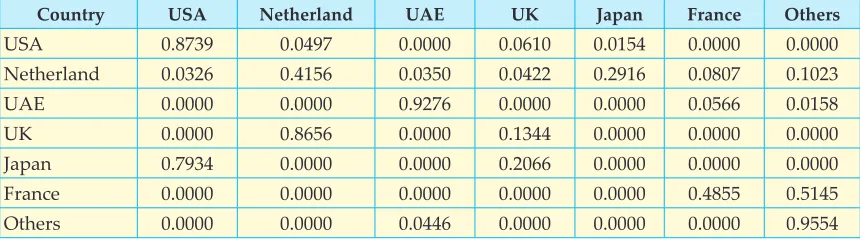
Table 2. Transitional probability matrix of cashew kernel exports
Country USA Netherland UAE UK Japan France Others
USA 0.8739 0.0497 0.0000 0.0610 0.0154 0.0000 0.0000
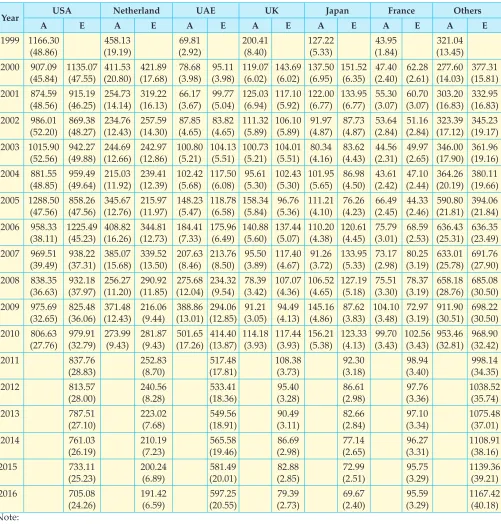
Table 3. Actual and estimated/predicted export shares of Indian cashew kernels to major importing countries
Year USA Netherland UAE UK Japan France Others
A E A E A E A E A E A E A E
1999 1166.30
(48.86) (19.19)458.13 (2.92)69.81 200.41 (8.40) 127.22 (5.33) (1.84)43.95 (13.45)321.04
2000 907.09
(45.84) 1135.07 (47.55) (20.80)411.53 (17.68)421.89 (3.98)78.68 (3.98)95.11 119.07 (6.02) 143.69 (6.02) 137.50 (6.95) 151.52 (6.35) (2.40)47.40 (2.61)62.28 (14.03)277.60 (15.81)377.31
2001 874.59
(48.56) (46.25)915.19 (14.14)254.73 (16.13)319.22 (3.67)66.17 (5.04)99.77 125.03 (6.94) 117.10 (5.92) 122.00 (6.77) 133.95 (6.77) (3.07)55.30 (3.07)60.70 (16.83)303.20 (16.83)332.95
2002 986.01
(52.20) (48.27)869.38 (12.43)234.76 (14.30)257.59 (4.65)87.85 (4.65)83.82 111.32 (5.89) 106.10 (5.89) (4.87)91.97 (4.87)87.73 (2.84)53.64 (2.84)51.16 (17.12)323.39 (19.17)345.23
2003 1015.90
(52.56) (49.88)942.27 (12.66)244.69 (12.86)242.97 100.80 (5.21) 104.13 (5.51) 100.73 (5.21) 104.01 (5.51) (4.16)80.34 (4.43)83.62 (2.31)44.56 (2.65)49.97 (17.90)346.00 (19.16)361.96
2004 881.55
(48.85) (49.64)959.49 (11.92)215.03 (12.39)239.41 102.42 (5.68) 117.50 (6.08) (5.30)95.61 102.43 (5.30) 101.95 (5.65) (4.50)86.98 (2.42)43.61 (2.44)47.10 (20.19)364.26 (19.66)380.11
2005 1288.50
(47.56) (47.56)858.26 (12.76)345.67 (11.97)215.97 148.23 (5.47) 118.78 (6.58) 158.34 (5.84) (5.36)96.76 111.21 (4.10) (4.23)76.26 (2.45)66.49 (2.46)44.33 (21.81)590.80 (21.84)394.06
2006 958.33
(38.11) 1225.49 (45.23) (16.26)408.82 (12.73)344.81 184.41 (7.33) 175.96 (6.49) 140.88 (5.60) 137.44 (5.07) 110.20 (4.38) 120.61 (4.45) (3.01)75.79 (2.53)68.59 (25.31)636.43 (23.49)636.35
2007 969.51
(39.49) (37.31)938.22 (15.68)385.07 (13.50)339.52 207.63 (8.46) 213.76 (8.50) (3.89)95.50 117.40 (4.67) (3.72)91.26 133.95 (5.33) (2.98)73.17 (3.19)80.25 (25.78)633.01 (27.90)691.76
2008 838.35
(36.63) (37.97)932.18 (11.20)256.27 (11.85)290.92 (12.04)275.68 234.32 (9.54) (3.42)78.39 107.07 (4.36) 106.52 (4.65) 127.19 (5.18) (3.30)75.51 (3.19)78.37 (28.76)658.18 (30.50)685.08
2009 975.69
(32.65) (36.06)825.48 (12.43)371.48 216.06 (9.44) (13.01)388.86 (12.85)294.06 (3.05)91.21 (4.13)94.49 145.16 (4.86) (3.83)87.62 104.10 (3.48) (3.19)72.97 (30.51)911.90 (30.50)698.22
2010 806.63
(27.76) (32.79)979.91 273.99 (9.43) 281.87 (9.43) (17.26)501.65 (13.87)414.40 114.18 (3.93) 117.44 (3.93) 156.21 (5.38) 123.33 (4.13) (3.43)99.70 102.56 (3.43) (32.81)953.46 (32.42)968.90
2011 837.76
(28.83) 252.83 (8.70) (17.81)517.48 108.38 (3.73) (3.18)92.30 (3.40)98.94 (34.35)998.14
2012 813.57
(28.00) 240.56 (8.28) (18.36)533.41 (3.28)95.40 (2.98)86.61 (3.36)97.76 1038.52 (35.74)
2013 787.51
(27.10) 223.02 (7.68) (18.91)549.56 (3.11)90.49 (2.84)82.66 (3.34)97.10 1075.48 (37.01)
2014 761.03
(26.19) 210.19 (7.23) (19.46)565.58 (2.98)86.69 (2.65)77.14 (3.31)96.27 1108.91 (38.16)
2015 733.11
(25.23) 200.24 (6.89) (20.01)581.49 (2.85)82.88 (2.51)72.99 (3.29)95.75 1139.36 (39.21)
2016 705.08
(24.26) 191.42 (6.59) (20.55)597.25 (2.73)79.39 (2.40)69.67 (3.29)95.59 1167.42 (40.18)
Note:
A= Actual
E= Estimated/Predicted
(a) USA (Value in Crores) (b) Netherland (Value in Crores)
(c) UK (Value in Crores) (d) Japan (Value in Crores)
(e) France (Value in Crores) (f) Others (Values in Crores)
Figure 1. Actual and estimated/predicted (E) shares of cashew kernel exports from India
from one state to another on a state space. It is a random process usually characterized as memoryless: the next state depends only on the current state and not on the sequence of events that preceded it. This specific kind
Where,
Ejt = Exports from India to jth country during the
A Markov chain model is a mathematical system that undergoes transitions from one state to another on a state space. It is a random process usually characterized as memoryless: the next state depends only on the current state and not on the sequence of events that preceded it. This specific kind of “memorylessness” is called the markov property. t = Number of years considered for the analysis r = Number of importing countries
The transitional probabilities Pij which can be arranged in a (c * r) matrix, have the following properties.
O < Pij < 1
n ij i 1
P
=∑
= 1, for all i
Thus, the expected export shares of each country during period‘t’ were obtained by multiplying the export to these countries in the previous period (t-1) with the transitional probability matrix.
There are several approaches to estimate the transitional probabilities of the Markov chain model such as un weighted restricted least squares, weighted restricted least squares, Bayesian maximum likelihood, unrestricted least squares, etc; in the present study, minimum absolute deviation (MAD) estimation procedure was employed to estimate the transitional probability which minimizes the sum of absolute deviations. The conventional linear programming technique was used, as this satisfies the properties of transitional probabilities of non-negativity restrictions and row sum constraints in
estimation.
The linear programming formulation is stated as Min OP* + Ie
Subject to, XP* + V = Y GP* = 1 P* > 0 Where,
P* = is the vector in which probability Pij are arranged
0 = is a vector of zero
I = is an appropriately dimensioned identity matrix
e = is a vector of absolute errors (ôVô) Y = is the vector of exports to each country X = is the block diagonal matrix of lagged values
of Y
V = is the vector of errors
G = is the grouping matrix to add the row elements of P arranged in P* to unity By using the predicted transitional probabilities, the export of cashew kernel to different countries were predicted by multiplying the same with the respective shares of base year.
Results and Discussion
Perusal of Table1 reveals that in over all period of export (1999-2010), the highest share of import of cashew kernel from India was USA (42.18%), among the importing countries the least share was for France (2.83%), the variance of import of cashew kernel was more in case of ‘other’ countries. USA is the more stable importer of cashew kernel. Compared to all importing countries UAE is the unstable importer. From the simple growth rate and compound growth rate, the data reveals that, USA, Netherland, UK shows the negative growth rate, the countries like UAE, Japan, France, ‘Others’ and total export shows the positive growth rate. Among the countries the UAE shows the highest (19.52%) growth rate.
exports share over the study period was 87.39%. UAE retains its exports share was 92.76%. Thus, USA and UAE was the most reliable and loyal market for Indian cashew. Netherland retained its export share of 41.56%. This implied that it had lost most of its share to other importing countries. The remaining countries such as UK, France had the retention of 13.44%, 48.55% of its original share. This implied that they were also the stable importers of Indian cashew kernel. Japan had the retention of 0% means compared to other major importing countries, Japan is the unstable importers of Indian Cashew kernels. The ‘other’ countries showed high stability, which retains its export share over the study period was 95.54% of its original share.
USA lost to the tune of 4.97% to Netherland, 6.10% to UK, 1.54% to Japan, whereas it gained 79.34% from Japan and 3.26% from Netherland. Therefore, USA retains its original share of 87.39% and lost about 13.61% to Netherland, UK, Japan and ‘other countries’.
The major gainer among the importers of Indian cashew kernels over period was Netherland, which was having a transfer of 86.56% from UK, 49.70% from USA. Whereas it lost 32.60% to USA, 3.50 to UAE, 4.22% to UK, 29.16% to Japan, 8.07 to France and 10.23 to ‘other countries’. Therefore, Netherlands lost about 58.44% of its total imports. UAE could retain its original share of 92.76% and gained 5.66% from France and 10.23% from ‘other countries’. Whereas it lost its share to the tune of 7.33% to ‘other countries’. Japan gained 79.34% from USA and 20.66% from UK. Probability of retention Indian cashew kernel was unstable, because it retained zero probability of retention. France had retained its original share of 48.55% and gained 51.45% from ‘other countries’. Other countries retained its original share of 95.54% and gained 4.46% from UAE, whereas it lost 10.23% to Netherland and 51.45% to France respectively. Multiplying the transitional probability matrix and the original export series for the countries for successive years, the export of cashew kernel to
East Asian Countries was registered approximately 10 fold increase since 1980. Latin American Countries had registered approximately 3 fold increase during the same period. In recent times, India is facing stiff competition from Vietnam and Brazil in international cashew trade, which revealed ample scope to improve the productivity and quality of raw cashew nut in our country (Cashew Bulletin, 2010).
The predictions in Table 3 revealed that the share of UAE and ‘other countries’ would be more from existing level of import. USA was one of the largest importer of Indian cashew kernel till 2010. But it is predicted to register declining share from 27.76 to 24.26% during 2010 to 2016 and the share of the Netherland, UK, Japan, France would have declining trend in import of Indian cashew.
As the production of raw cashew nut was not sufficient to meet the requirements of the cashew processing industry for export and domestic sales, the industry had been resorting to import of raw nuts. One of the reasons for the declining in the export of cashew kernel from India might be that some of the traditional African nut suppliers along with the countries like Brazil and Vietnam have improved their processing and export of this commodity.
Conclusion
nut production. Availability of land area to expand cashew cultivation in India may not be much except in states like Chhattisgarh or waste lands available to certain extent in coastal regions and some non-traditional area. Hence, it is essential to increase productivity per unit area.
References
Ajjan, N., Vaseeharan, S. S., Ranaganathan, C. and Raveendaran, N., 1998. An economic analysis of export performance of senna and periwinkle in India. Indian Journal of Agricultural Economics80(1 and 7):88-99.
Angels, S., Sundar, A., and Chinnadurai, M., 2011. Impact of Globalization on production and export of turmeric in India – An economic analysis. Agricultural Economic Research Review24(12): 301-308.
Anonymous, 2005. Cashew Statistics, Cashew Bulletin 43(3):
13-17
Cashew Export Promotion Council of India, 2012. (www. cashewindia.org/)
Kerala State Industrial Development Corporation 2012. (www.ksidc.org/cashew.php)
Mandanna, P.K., Urs, D.S.D and Achoth, L., 1998. Structural Change in India’s Tobacco Exports: A Markov Chain Approach. Tropical Agricultural Research 10: 134-142.
Kumar P, P.S. Badal and Lalith Achoth., 2007. Changing direction of Indian mango Exports, Ind. Journal of Agricultural Marketing21(1): 130-137.
Sadavatti, P.M. 2006. Exports of Basmati Rice and its stability: Markov Chain Analysis, Ind. Journal of Agricultural Marketing 20(1): 11-18.
Umesh, K.B., Vishnuvardhana, and Thirumalaraju, G.T. 2005. ‘Business Opportunities in Cashew Industry’. Agro-India, The Integrated Agri Business Magazine 8(1): 14-17.
Velavan, C., 2004. Performance of Cashew – A Growth Rate