DOI: 10.30954/0424-2513.4.2018.32
©2018 New Delhi Publishers. All rights reserved
Social Costs and Benefits Analysis of Drip Irrigation System in
Northern Maharashtra
Subrata Gorain*, D.R. Singh, Pramod Kumar, P. Venkatesh and G.K. Jha
Division of Agricultural Economics, ICAR-Indian Agricultural Research Institute, New Delhi, India *Corresponding author: sgorain464@gmail.comABSTRACT
Water is going to be increasingly scarce and thereby limits the agricultural development in almost all the corner of entire world. Efficient development with proper management of the scarce water resources is the key determinants for achieving food security not only for India, but for the entire world. This paper has analyzed and assessed the associated social costs and benefits with drip irrigation system. The adoption of drip irrigation has significant bearing on the society as a whole and generates various positive and negative externalities. The different components of social benefits are value of energy saved, value of water saved and off-farm employment generation. On the other side, cost of subsidy to the government and forced investment on well are the two components of social costs. The value of electricity saved in monetary terms was observed to be ` 20.3 and 11.01 thousand per ha in sugarcane and banana crops, respectively. Economic value of water used under drip and flood irrigation was computed using Cobb-Douglas production function. Economic value of water used in sugarcane was 19.90 `/m3 and banana cultivation was observed to be 19.13 `/m3. The quantity of water saved by adoption of drip irrigation, in monetary terms was found to be ` 1.1 lakh and ` 69.9 thousand rupees per ha of sugarcane and banana, respectively. As the life span of a drip system is around 10 years, the social costs and benefits have been discounted for 10 years to get the actual social benefit cost ratio. The social benefit cost ratio is found to be 2.08 at 10 per cent discount rate.
Keywords: Drip irrigation; Social Costs and Benefits; Economic value of water; Cobb- Douglas production function
In India, demand of water for all the major sectors is growing spontaneously and demand management mechanism becomes the major key strategy to manage scarce resources of water. United Nation reported that with more than 1.3 billion population in 2017, India will be emerging as most populous country by 2024 in the world (UN Revised Population Projections, 2017). Since, in India, the foremost water consuming sector is agriculture (78% of fresh water resources), for sustainable management of water resources, the major concern would be the demand management mechanism in water scarce as well as water stressed regions
(Kumar, 2008). One of the major mechanisms for
demand management is adoption of micro irrigation like drip and sprinkler methods of irrigation. In response, the government of India, in conjunction
with state governments, has provided capital-cost
subsidies, ranging over time from 30 per cent to 90 per cent of purchase costs, for potential drip users (Narayanamoorthy, 2012). Drip method of irrigation has immense potential to enhance the productivity of several crops with a reduction in the cost of cultivation. The reason is drip system of
irrigation increased benefits through well sponsored
central as well as state subsidy schemes. To manage groundwater resources sustainably which are
grounded by a sound footing of better hydro and
social sciences till now not widely accepted. In many corner of India, uncontrolled withdrawal of the groundwater for crop production, supported by subsidization of electricity in farm sector, leads to rapid declines in ground water level (Kumar,
irrigation system has widely documented, hence, in this study, the positive externality is estimated by considering only social benefits, which were
hardly quantified (Kumar and Palanisami, 2012).
However, to the best of our knowledge, no one has estimated for Maharashtra state which has a sizable area under drip irrigation. Several studies have covered drip irrigation technology, but they have not concentrated on associated social cost as
well as social benefit of this technology. Therefore,
this study has concentrated to identify and estimate
the different components of social costs and social benefits in a more comprehensive manner.
Database and Methodology
The study is based upon both primary as well as secondary information. Secondary data on micro and drip irrigation in Maharashtra state and
India were collected. Farm size-wise beneficiary’s
farmers for drip irrigation in Maharashtra were collected for selection of districts for primary data collection. Secondary data were collected from
various governmental sources like Office of the Commissioner of Agriculture, Pune, Maharashtra,
Department of agriculture Nashik and Jalgaon, Ministry of Agriculture & Farmers Welfare, Government of India.
A structured interview schedule was developed to collect primary data from the selected farmers. The data was collected by personal interview method. Data was collected regarding basic information about the farmers, adoption status of
drip irrigation system, farmer specific variables,
institutional variable, credit availability, source of irrigation, constraints in adoption of drip irrigation, perception on adoption of drip irrigation, forced
investment on non-functioning well, ground
water table information, employment generation due to adoption of drip irrigation, water market information, information on cost of cultivation etc.
Social benefit-cost analysis is a process of identifying, measuring and comparing the social benefits and
costs of an investment project or programme. The
adoption of drip irrigation has significant bearing
on the society as a whole and generates various positive and negative externalities (Dhawan, 2000). Positive externalities include a reduction in the well failure rate, a reduced cost for the deepening of existing wells or for drilling new wells, and
increased availability of irrigation water (Kumar
et al. 2008). The adoption of drip irrigation also generates negative externalities, such as forced investment on additional wells or water utilization structures, a reduction of employment due to
changes in cropping pattern e.g. moving from a
labour intensive annual cereal crop production to less labour intensive tree cultivation (Dhawan,
2000). To examine the social costs and benefits, value
of water and energy saved and other positive and negative externalities were computed.
To estimate the marginal productivity of groundwater used a log linear function was used to capture the impact of water used in the farm
on average yield for drip irrigated farms. Cobb-Douglas production function was fitted to estimate
marginal productivity of water and energy as:
Ln Y = ln a + bi LnXi
Where, ‘Y’ denotes the yield in q/ha and ‘Xi’ is the
water use in q/m3. The marginal value product of
the drip irrigated farms was derived from the
Cobb-Douglas production function, as:
*
i Y
MP b X =
Where, ‘bi’ is the elasticity coefficient of ith
independent variable.
MVP = MP * Price of output
Positive externalities have been estimated in terms of water and energy saved using drip irrigation in comparison to flood irrigated methods. For
the estimation of social cost water-guzzling crops
namely sugarcane and banana have been considered since they are being extensively irrigated using drip irrigation system. However, drip is also being used
for other crops like cotton, maize, some vegetables
and other fruit crops, but the extent of use is meagre therefore, for the simplicity, these crops were not taken into account while estimating the social
benefit and costs.
The associated benefits in the form of increase in
1 1 n i i i W n i i V = = ∇ Α = Ω Α
∑
∑
‘VW’ is the value of water saved due to adoption of drip irrigation over flood method of irrigation in `/ ha. ‘∇i’ is the difference in applied water between drip and flood irrigation system in M3. The area
under crop ‘i’ representing by ‘Ai’ is in ha (‘i’ =
1,2,…,n) and ‘Ω’ is the economic value of water used
in agriculture in the sampled area in `/M3 of water.
The economic value of water was calculated by the marginal value product (MVP) of water used.
External benefits in the form reduced consumption
of electricity were computed as:
=1 =1 n i i i E n i i
V = ∇ Α ψ
Α
∑
∑
‘VE’ represents the value of electricity saved due to adoption of drip irrigation over flood method
of irrigation in `/ha. ‘∇i’ is the difference between
energy saving in electricity consumption for irrigation in agriculture due to drip irrigation. The area under crop ‘i’ in each crop was denoted by ‘Ai’
in ha (‘i’ = 1,2, … ,n). ‘Ψ’ represents the economic
cost of energy in `/ kWh3.
The forced investment on failed wells was considered as the cost of negative externality. The externalities were implicitly incurred through forced investment
on additional wells and/or non-functional well.
Further cost of subsidy on drip irrigation was considered as social cost.
Social benefits /ha = 1n
∑
ni=1Biwhere n is the number of crops, here n = 2, since
banana and sugarcane were taken into account assuming both are having more or less same area under drip irrigation in the study area. Bi is the
discounted benefits (social rate of discounting is
@ 10%) for ith crop assuming the life of system is
10 years.
Social cost /ha = C1 + C2
Where, C1 is cost of subsidy per ha, and C2 is invest for rejuvenation of failed or less water yielding
wells. Here, Costs were discounted at the rate of
10 per cent.
RESULTS AND DISCUSSION
Pattern of water use in drip and flood irrigation in
sugarcane and banana crops was studied. Most of the pump set was of 5 HP on the selected farms.
Total number of irrigation under drip and flood
method of irrigation in sugarcane was found to be 217 and 48 per season, respectively (Table 1). The required number of hours for irrigation in sugarcane, under drip and flood method of irrigation was 2.0 and 12 hours per ha, respectively. In banana crop, the number of irrigation per crop
season was 54 and 21 in drip and flood method
of irrigation. The number of hours of irrigation in banana in each turn of irrigation is 2.5 and 8.0 hours
in drip and flood method of irrigation, respectively.
Table 1: Pattern of water use in drip and flood
irrigated crops
Crop
Name Method of irrigation
Number of irrigation per crop season Irrigation hours/ ha/irrigation Sugarcane Drip
irrigation 217 2.0
Flood
method 48 12.0
Banana Drip
irrigation 54 2.5
Flood
irrigation 21 8.0
Electricity tariff was assumed ` 5/Kwh per unit because of opportunity costs of agriculture sector
is the per unit tariff of using electricity in industrial sector. In Maharashtra, the electricity tariffs was
found to be ` 5 per Kwh. Electricity consumption of
drip and non-drip irrigation methods was estimated
and presented in Table 2. It was observed that nearly 30.68 and 26.38 per cent of electricity saved in sugarcane and banana crops respectively, by
adopting drip over flood method of irrigation. The
Electricity is the principal input for irrigation in
agriculture. Efficiency in the energy used reduces
the cost of cultivation of crops, in turn increases the net returns for the farmer himself. Therefore,
electricity use efficiency in both the drip and
non-drip irrigated crops was analysed and depicted
in Table 3. The yield difference in sugarcane and
banana in drip compared to flood irrigation is 420.2 q/ha and 100.82 q/ha, in which drip farms
yielded significantly higher than the non-drip farms. Electricity use efficiency in sugarcane was found to
be 7.45 and 16.32 Kwh per quintal yield in drip and
flood method of irrigation, respectively. In case of banana crop, electricity use efficiency was observed
to be 8.75 and 14.09 per quintal yield, respectively. It was found that drip farms require considerably lesser units of electricity to produce per quintal of sugarcane and banana crops.
Economic value of water used under drip and
flood irrigation was computed using Cobb-Douglas
production function for sugarcane and banana crops, separately (Table 4). The marginal product of sugarcane and banana crops was found to be 0.0812 and 0.0213 q/m3, respectively. Marginal
Value Product, i.e. economic value of water used in sugarcane and banana cultivation was observed to be 19.90 and 19.13 `/m3, respectively.
Table 4: Economic value of water in crop production
Crop product (q/mMarginal 3) output (Price of
`/q) Economic value of water (`/m3)
Sugarcane 0.0812 245 19.90
Banana 0.0213 900 19.13
The amount of water saved from adoption of drip irrigation is calculated for sugarcane and banana
crops and presented in Table 5. Difference in water
use was found to be higher for sugarcane (5941/m3/
ha) than banana crop (3659 /m3/ha). The quantity
of water saved by adoption of drip irrigation, in monetary terms was found to be ` 1.1 lakh and
` 69.9 thousand rupees per ha of sugarcane and banana, respectively. It was concluded that drip
irrigation saves significant amount of water, both
in physical and monetary terms in the cultivation of water intensive crops like sugarcane and banana.
Table 5: Water saved due to adoption of drip irrigation
Crops
Water consumption
(m3/hectare)
Difference
in water use (m3/ha)
Water saved in drip irrigation (`/
ha) Drip Flood
Sugarcane 7239.45 13179.98 5940.53 118216.55 Banana 4225.89 7884.70 3658.81 69993.04
Result reveals that electricity is not used efficiently in agriculture due to predominant use of flood method
of irrigation, where conveyance and distribution losses of water are substantial. Drip irrigation introduced during the eighties, specifically for
improve the water use and electricity use efficiency
has been practiced in different parts in India. Drip method supplies water directly to the root zone through a network of pipes with the help of
emitters. Since, it supplies water directly to the crop, instead of land, as followed in the flood method
of irrigation, the water losses occurring through
Table 2: Estimates of electricity consumption on drip and non drip farms
Crop Electricity Consumption (Kwh/ha) Electricity saving in drip over flood irrigation Drip irrigation Flood Irrigation Per cent Quantity saved (Kwh/ha) Money value (`/ha)*
Sugarcane 9175.53 13235.99 30.68 4060.46 20302
Banana 6145.78 8347.75 26.38 2201.97 11010
Notes: *Electricity charges @5 `/Kwh.
Table 3: Estimates of electricity use efficiency on drip and non drip farms
Crop Yield (q/ha) Electricity use (Kwh/ha) Electricity use efficiency (Kwh/yield) Drip Flood Drip Flood Drip Flood
Sugarcane 1231.0 810.80 9175.53 13235.99 7.45 16.32
Banana 702.74 601.92 6145.78 8347.75 8.75 14.09
evaporation and distribution are completely absent. Sugarcane consumes more electricity because of more number of irrigation in both the methods. There is a direct linkage between water use and electricity use.
Keeping in view of the positive and negative externalities of the adoption of drip irrigation
system, social benefits and costs were studied and
presented in Table 6. The different components of social benefits are value of energy saved,
value of water saved and off-farm employment generation. On the other side, cost of subsidy to
the government and forced investment on well are the two components of social costs. Value of energy saved in sugarcane and banana cultivation was observed to be ` 1.18 lakh and ` 69.9 thousand per
ha respectively. Off-farm employment was found
to be ` 250 per ha.
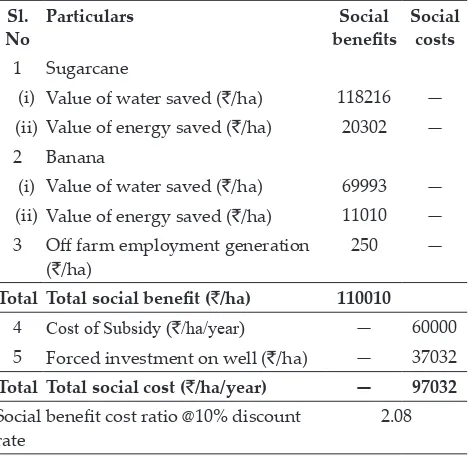
Table 6: Social benefit and cost (`/ha) analysis of drip irrigation system
Sl.
No Particulars benefitsSocial Social costs
1 Sugarcane
(i) Value of water saved (`/ha) 118216 — (ii) Value of energy saved (`/ha) 20302 — 2 Banana
(i) Value of water saved (`/ha) 69993 — (ii) Value of energy saved (`/ha) 11010 — 3 Off farm employment generation
(`/ha) 250 —
Total Total social benefit (`/ha) 110010
4 Cost of Subsidy (`/ha/year) — 60000 5 Forced investment on well (`/ha) — 37032
Total Total social cost (`/ha/year) — 97032
Social benefit cost ratio @10% discount
rate 2.08
Note:` 34000 and 26000 are subsidy per ha on drip irrigation for sugarcane and banana, respectively.
Cost of subsidy and forced investment on well were ` 60 and ` 37 thousand, respectively. It was inferred from the table that total social benefit and total social cost realized by adoption of drip irrigation was ` 1.10 lakh and ` 97 thousand per ha in a year, respectively. As the life span of a drip system is
around 10 years, the social costs and benefits have
been discounted for 10 years to get the actual social
benefit cost ratio. The social benefit cost ratio is
found to be 2.08 at 10 per cent discount rate. Though drip irrigation technology is introduced primarily
to increase the water use efficiency in agriculture,
it also delivers many other economic and social
benefits to the society.
CONCLUSION
Since green revolution in India, widespread
cultivation of water intensive crops under flood or
conventional methods of irrigation were practiced significantly. However, the private and social
benefits can also be increased by adoption solar
energy for operation of drip irrigation. As a whole, the drip irrigation system was found to be socially feasible option on account of impressive social
benefit cost ratio. This confirms that a wide adoption of drip irrigation will generates sufficient social benefits to justify the subsidization of drip irrigation
in the country. The drip irrigation in agriculture
is profitable to the farmers and socially beneficial
even though electricity cost for water extraction is very high. Hence, there is still scope for improving the profitability by reducing the cost of water extraction by adoption of solar energy along with drip irrigation.
REFERENCES
Dhawan, B.D. 2000. Drip irrigation: Evaluating returns.
Economic and Political Weekly, 3775-3780.
Kumar, D.S. 2012. Adoption of drip irrigation system in India: Some experience and evidence. The Bangladesh Development Studies, pp. 61-78.
Kumar, D.S. and Palanisami, K. 2011. Can drip irrigation technology be socially beneficial? Evidence from Southern India. Water Policy, 13(4): 571-587.
Kumar, M.D. 2008. Managing water in the face of growing scarcity, inequity and declining returns: exploring fresh approaches. In: Conference proceedings of the 7th Annual Partners Meet, IWMI TATA Water Policy Research Program, ICRISAT, Patancheru, Hyderabad, India, 2-4 April 2008. Vol. 2. Kumar, M.D. 2008. Managing water in the face of growing scarcity,
inequity and declining returns: exploring fresh approaches. In: Conference proceedings of the 7th Annual Partners Meet, IWMI TATA Water Policy Research Program, ICRISAT, Patancheru, Hyderabad, India, 2-4 April 2008. Vol. 2. Narayanamoorthy, A. 2012. Economics of drip irrigated
cotton: a synthesis of four case studies. In: Proceedings of the 7th Annual Partners Meet, International Water Management Institute (IWMI) TATA Water Policy Research Program, ICRISAT, 2-4.